Bitcoin price started a fresh decline below the $62,500 zone. BTC is showing bearish signs and might continue to move down if it dips below $61,200.
- Bitcoin failed to stay above $63,200 and extended losses.
- The price is trading below $62,500 and the 100 hourly simple moving average.
- There is a bearish trend line forming with resistance near $62,400 on the hourly chart of the BTC/USD pair (data feed from Kraken).
- The pair might extend losses if it stays below the $62,500 and $63,500 levels.
Bitcoin Price Dips Toward Support
Bitcoin price failed to stay above the $63,500 support zone. BTC remained in a bearish zone and extended losses below the $63,200 level. There was a move below the $62,500 level.
The price even dipped below $61,200. A low was formed at $60,746 and the price is still showing many bearish signs. There was a minor increase above the 23.6% Fib retracement level of the downward move from the $64,613 swing high to the $60,746 low.
Bitcoin is now trading below $62,500 and the 100 hourly simple moving average. There is also a bearish trend line forming with resistance near $62,400 on the hourly chart of the BTC/USD pair.
If the price remains stable above $60,750, it could attempt a fresh increase. Immediate resistance is near the $62,500 level and the trend line. The first key resistance is near the $63,200 level or the 61.8% Fib retracement level of the downward move from the $64,613 swing high to the $60,746 low.
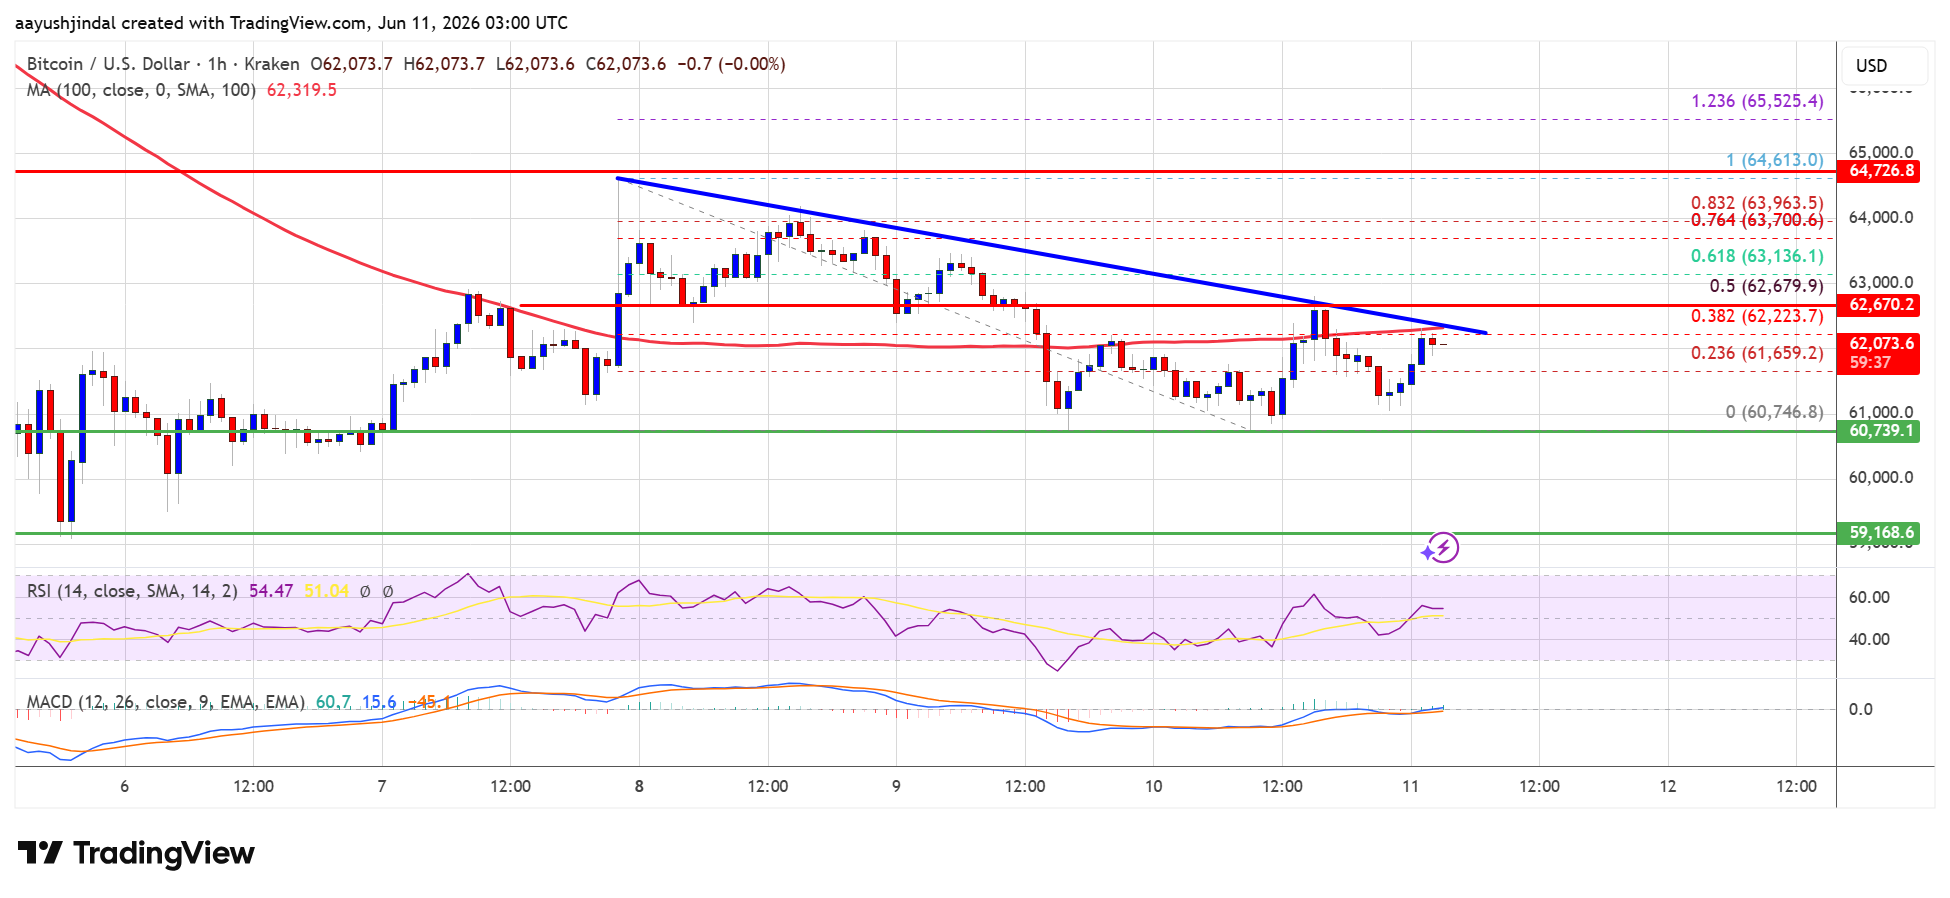
A close above the $63,200 resistance might send the price further higher. In the stated case, the price could rise and test the $63,500 resistance. Any more gains might send the price toward the $64,500 level. The next barrier for the bulls could be $65,000.
More Losses In BTC?
If Bitcoin fails to rise above the $63,200 resistance zone, it could start another decline. Immediate support is near the $61,650 level.
The first major support is near the $61,200 level. The next support is now near the $60,750 zone. Any more losses might send the price toward the $60,200 support in the near term. The main support now sits at $60,000, below which BTC might struggle to recover in the near term.
Technical indicators:
Hourly MACD – The MACD is now losing pace in the bearish zone.
Hourly RSI (Relative Strength Index) – The RSI for BTC/USD is now above the 50 level.
Major Support Levels – $61,650, followed by $61,200.
Major Resistance Levels – $62,500 and $63,500.
Cardano Looks at $0.53 as ADA Hovers Over Key Support Area With Van Rossem Hard Fork Making Progress MEXC
Source link ]]>
Cardano’s Developer Firepower Meets a Political Storm as ADA Hovers at Rock Bottom AD HOC NEWS
Source link ]]>
Dogecoin Price Hovers Near $0.095 as Whale Accumulation and Technical Patterns Signal Potential Upsi AD HOC NEWS
Source link ]]>
Dogecoin Price Hovers Near $0.095 Amid Descending Triangle Risks and Collapsing New Holder Momentum AD HOC NEWS
Source link ]]>
Make-or-break support zone for Cardano price as ADA hovers around 0.27 Cryptonews.net
Source link ]]>
Bitcoin price started a recovery wave above $68,000. BTC is now consolidating gains above $70,000 and faces hurdles near the $72,200 zone.
- Bitcoin is attempting to recover but is facing many hurdles near $72,000.
- The price is trading above $70,000 and the 100 hourly simple moving average.
- There is a rising channel forming with support at $68,800 on the hourly chart of the BTC/USD pair (data feed from Kraken).
- The pair might dip again if it trades below the $68,800 and $67,700 levels.
Bitcoin Price Stays In A Range
Bitcoin price managed to remain stable above the $66,000 zone. BTC started a recovery wave and was able to climb above the $68,800 resistance zone.
The price surpassed the 50% Fib retracement level of the main slide from the $78,988 swing high to the $60,500 low. However, the bears seem to be active near the $72,000 and $72,500 levels. Besides, there is a rising channel forming with support at $68,800 on the hourly chart of the BTC/USD pair.
Bitcoin is now trading above $70,000 and the 100 hourly simple moving average. If the price remains stable above $68,800, it could attempt a fresh increase. Immediate resistance is near the $72,000 level or the 61.8% Fib retracement level of the main slide from the $78,988 swing high to the $60,500 low.
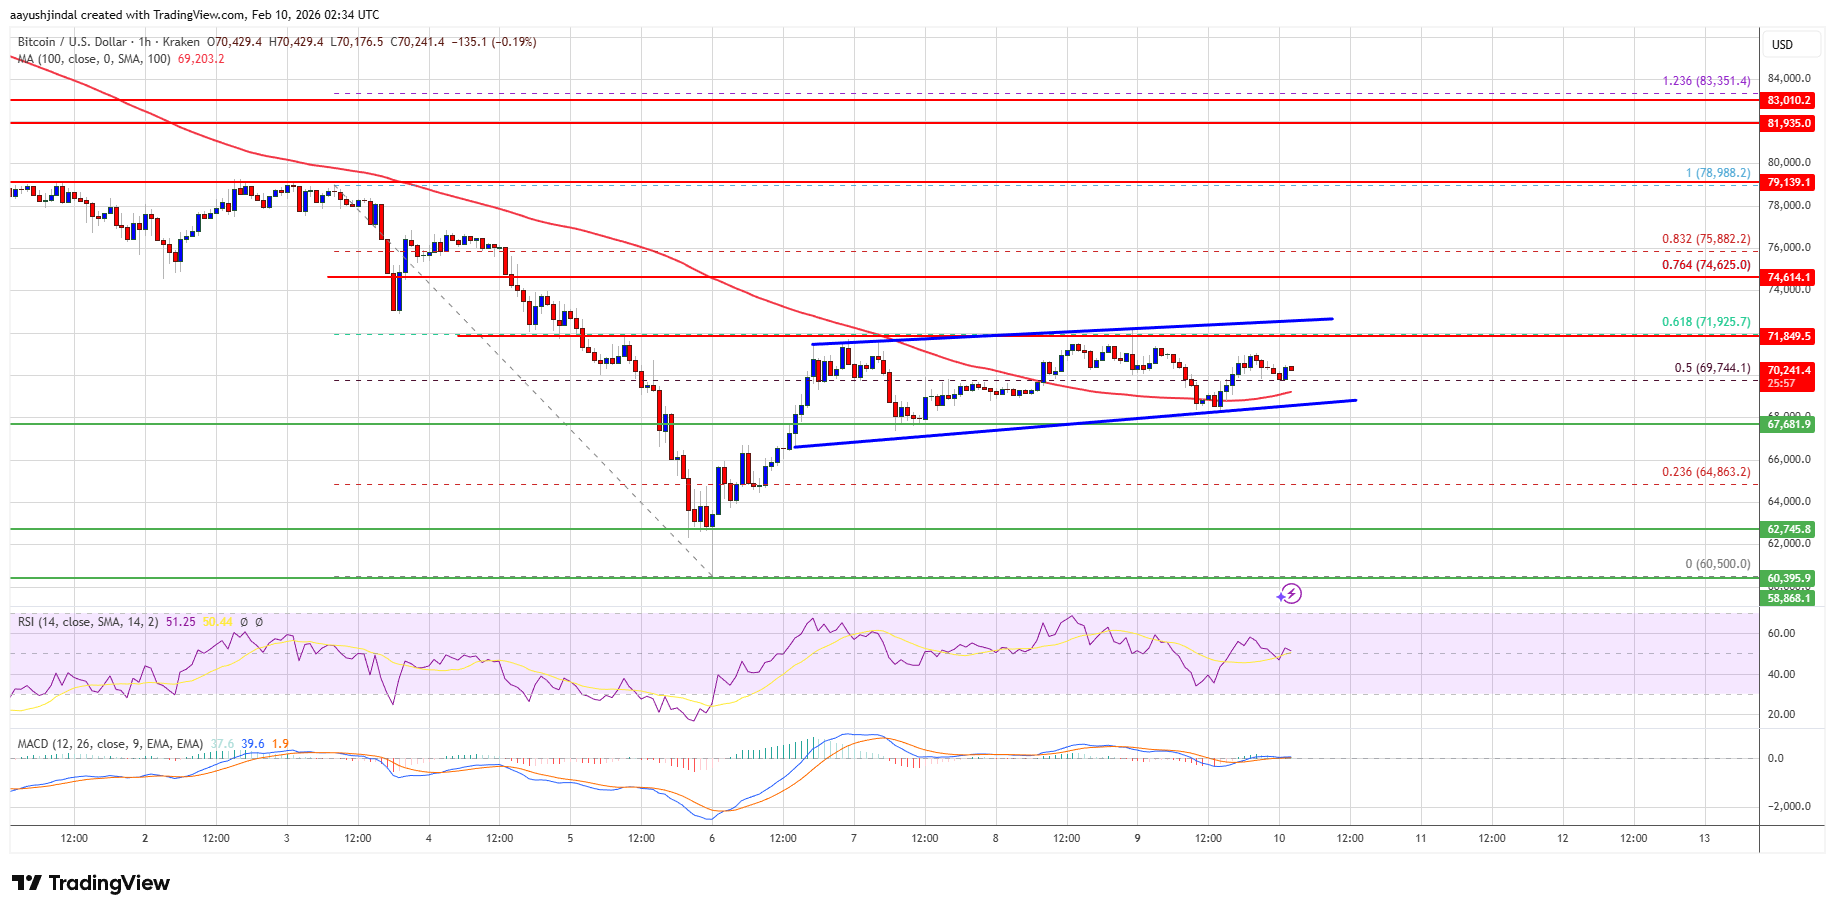
The first key resistance is near the $72,500 level. A close above the $72,500 resistance might send the price further higher. In the stated case, the price could rise and test the $74,650 resistance. Any more gains might send the price toward the $75,880 level. The next barrier for the bulls could be $76,500 and $77,200.
Another Decline In BTC?
If Bitcoin fails to rise above the $72,500 resistance zone, it could start another decline. Immediate support is near the $69,400 level. The first major support is near the $68,500 level.
The next support is now near the $67,600 zone. Any more losses might send the price toward the $66,500 support in the near term. The main support now sits at $65,000, below which BTC might struggle to recover in the near term.
Technical indicators:
Hourly MACD – The MACD is now losing pace in the bearish zone.
Hourly RSI (Relative Strength Index) – The RSI for BTC/USD is now above the 50 level.
Major Support Levels – $68,500, followed by $67,600.
Major Resistance Levels – $72,000 and $72,500.
The pioneer cryptocurrency’s recent dip below the $75k level has pushed Michael Saylor’s Bitcoin treasury firm, Strategy, into unrealized losses. The company, which boasts more than 712,000 BTC, is now sitting at an unrealized loss of over $900 million as the Bitcoin price continues to slip. Strategy Slips into Unrealized Loss as Bitcoin Tests $75K
The post Michael Saylor’s Strategy Faces $900M Unrealized Loss as Bitcoin Hovers Near $75K appeared first on CoinGape.
]]>Dogecoin Price Hovers Around $0.137 as Oversold Signals Hint at Potential Bounce Coinpaper
Source link ]]>
Cardano (ADA) USD Price Today (Dec. 18, 2025): ADA Hovers Near $0.37 as Bears Press Support — Latest News and Forecast Roundup ts2.tech
Source link ]]>