Ethereum price started a steady recovery wave above $2,050. ETH is now struggling to clear $2,150 and might trim some gains in the near term.
- Ethereum started a decent upward move above the $2,020 zone.
- The price is trading above $2,050 and the 100-hourly Simple Moving Average.
- There was a break below a short-term contracting triangle with support at $2,135 on the hourly chart of ETH/USD (data feed via Kraken).
- The pair could start a fresh decline if it stays below the $2,150 resistance.
Ethereum Price Faces Rejection
Ethereum price extended its recovery wave above $2,020, beating Bitcoin. ETH price was able to surpass the $2,050 and $2,065 resistance levels.
The bulls pushed the price above the 61.8% Fib retracement level of the downward move from the $2,198 swing high to the $1,936 low. However, the bears remained active near the $2,150 resistance zone. The price reacted to the downside below $2,120.
There was a break below a short-term contracting triangle with support at $2,135 on the hourly chart of ETH/USD. Ethereum price is now trading above $2,050 and the 100-hourly Simple Moving Average. If the bulls remain in action above $2,050, the price could attempt another increase. Immediate resistance is seen near the $2,120 level.
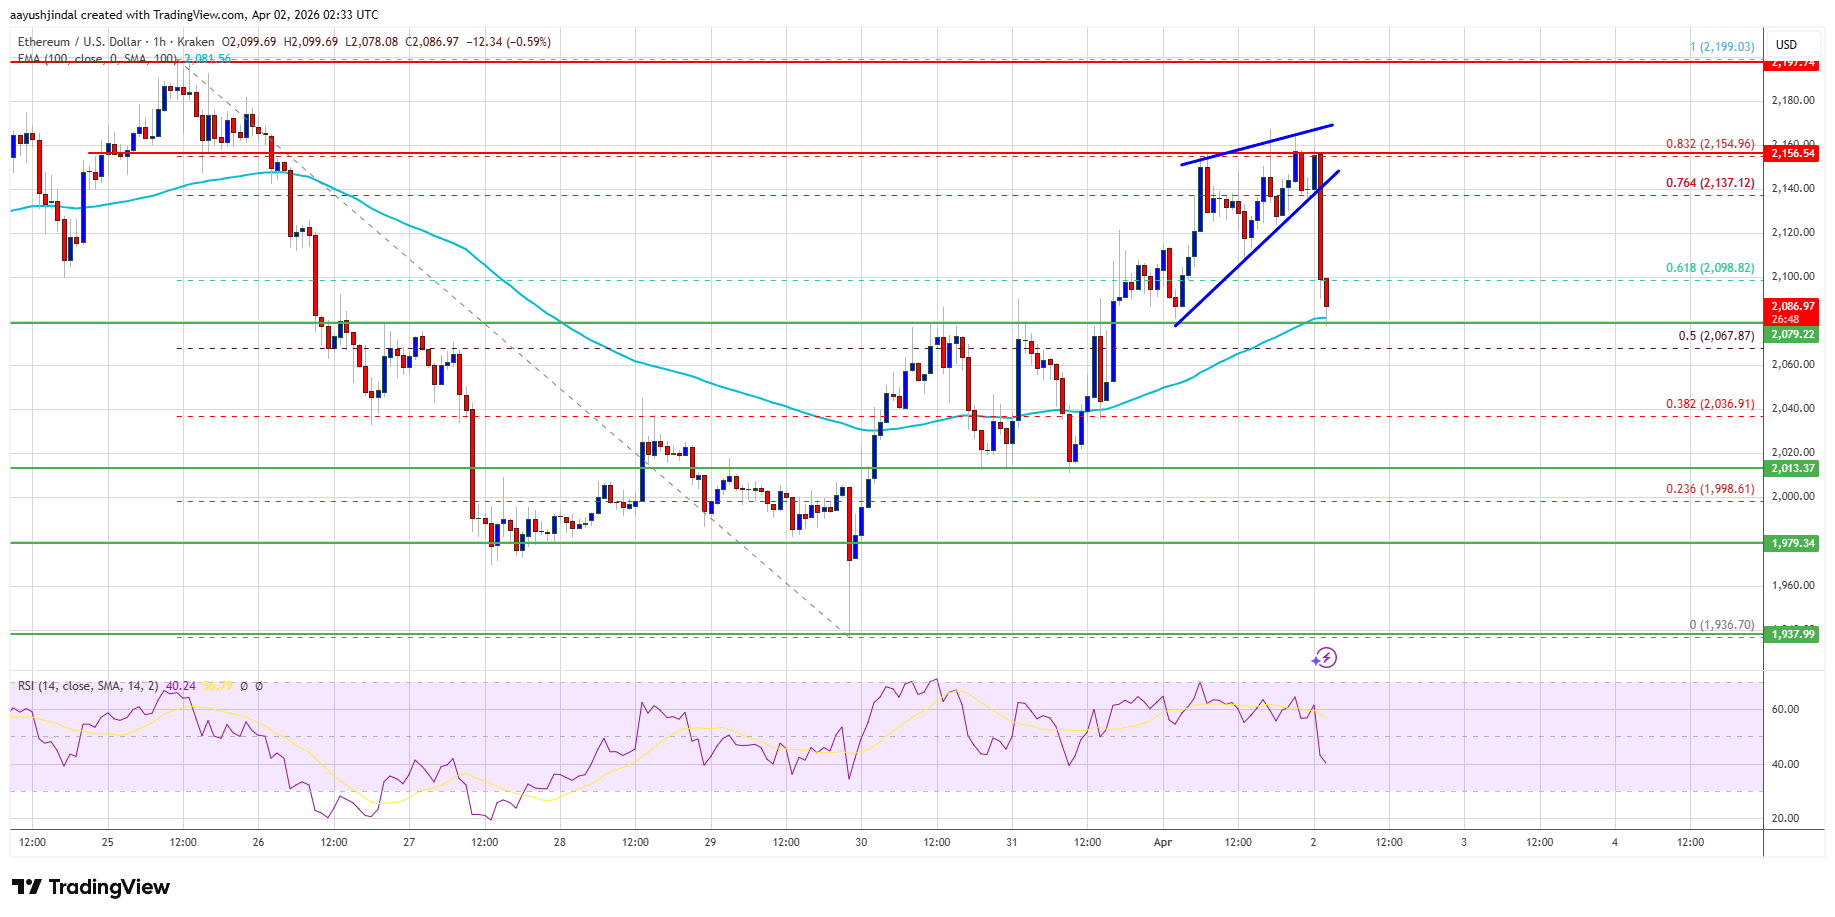
The first key resistance is near the $2,150 level or the 83.2% Fib retracement level of the downward move from the $2,198 swing high to the $1,936 low. The next major resistance is near the $2,200 level. A clear move above the $2,200 resistance might send the price toward the $2,250 resistance. An upside break above the $2,250 region might call for more gains in the coming days. In the stated case, Ether could rise toward the $2,320 resistance zone or even $2,350 in the near term.
More Losses In ETH?
If Ethereum fails to clear the $2,150 resistance, it could start a fresh decline. Initial support on the downside is near the $2,080 level. The first major support sits near the $2,050 zone.
A clear move below the $2,050 support might push the price toward the $2,000 support. Any more losses might send the price toward the $1,965 region. The main support could be $1,920.
Technical Indicators
Hourly MACD – The MACD for ETH/USD is gaining momentum in the bearish zone.
Hourly RSI – The RSI for ETH/USD is now below the 50 zone.
Major Support Level – $2,050
Major Resistance Level – $2,150
Cardano clears a critical governance hurdle with renewed on-chain authority Coinfomania
Source link ]]>
SHIB News: Shiba Inu Developers Clear Final Hurdle for LEASH v2 Migration CoinDesk
Source link ]]>
Bitcoin News Today: Dogecoin Eyes $1 Hurdle as Cardano Investors Shift to DeSoc AInvest
Source link ]]>
Cardano’s $1 Hurdle: Will Institutional Bet Signal a New Era? AInvest
Source link ]]>

- Bitcoin (BTC) must clear the $120,000 resistance to resume upward momentum.
- $200K in 2025 is unlikely without stronger volume support.
- Long-term outlook remains bullish despite short-term hurdles.
Despite recent pullback after hitting a new all-time high, Bitcoin price predictions remain bullish amid a mix of political support, institutional interest, and speculative whale activity.
However, Bitcoin (BTC) will have to overcome the short-term resistance levels and overbought conditions that have temporarily capped its upward momentum.
BTC faces a key resistance hurdle at $120,000
At press time, Bitcoin (BTC) was trading at around $118,584 after hitting a recent high of $122,838 on July 14.
And while it is still 77% up over the past year, momentum has slowed in recent sessions.
Notably, the pullback can be attributed to Bitcoin attempting to offload overbought signals on the Relative Strength Index (RSI), especially after repeated rejection at the $120,000 level.
Technical data reveals that the BTC/USDT pair is facing stiff resistance near this psychological threshold, where previous rallies have faltered.

Despite this, the price remains comfortably above its 50-day Exponential Moving Average (EMA), which continues to serve as a dynamic support.
As long as Bitcoin maintains this position, the broader bullish trend remains intact.
Futures market signals continued consolidation
The Bitcoin Futures, Jul-2025 (BTC=F) mirrors the spot market’s hesitation.
Notably, the Bitcoin Futures’ price action, as evident on Yahoo Finance, remains locked between key pivots ($123,875 on the high end and $115,340 below).
The central pivot point of $120,615 has become a battleground, with neither bulls nor bears showing dominance.
A breakout above $126,015, which aligns with the upper channel trendline, could spark renewed buying interest and potentially send prices toward the $129,000–$132,000 range.
On the flip side, failure to reclaim $120,615 could expose the contract to a retracement toward $115,340, with downside risk extending to $112,000 if support breaks.
Volume profile data supports this indecisiveness. Most of the recent trading activity has clustered between $118,000 and $122,000, highlighting this zone as a significant liquidity area.
For any breakout to sustain, a corresponding uptick in volume must accompany it — something that has yet to materialise.
Whales stir, but caution remains
Fueling speculation further, a long-dormant Bitcoin whale recently moved 10,606 BTC, worth approximately $1.3 billion.
HUGE $BTC MOVEMENT — Dormant Whale Wakes Up and Transfers 10,606 BTC ($1.26B)
Be alert — major Bitcoin movement detected.
In the past 5 hours, three wallets, likely controlled by the same long-term whale, have collectively transferred 10,606 BTC — worth around $1.26 billion —… pic.twitter.com/UltvrUPlPn
— EyeOnChain (@EyeOnChain) July 23, 2025
This reactivation, after years of inactivity, has raised questions about the whale’s intentions—be it profit-taking, institutional over-the-counter (OTC) deal prep, or strategic reallocation.
Such large-scale movements often impact market sentiment, particularly when they occur near price peaks.
If these funds are moved to exchanges, the threat of a large selloff increases.
Conversely, if transferred to cold storage, it may indicate confidence in Bitcoin’s long-term trajectory. For now, the market remains watchful, not reactive.
Macro and political tailwinds support BTC’s growth
External forces are also adding fuel to Bitcoin’s long-term prospects.
Trump Media and Technology Group recently acquired nearly $2 billion worth of Bitcoin using proceeds from stock sales and bonds.
This move coincides with increased US legislative support for crypto, including the passage of the GENIUS stablecoin bill and proposals for a Strategic Bitcoin Reserve.
Moreover, Bitcoin-backed borrowing is gaining traction. Xapo’s BTC-collateralised lending product recorded a 24% increase in Q2 usage, particularly in Europe and Latin America.
This trend suggests that holders are increasingly seeking liquidity solutions without having to sell their BTC, a dynamic that could reduce short-term selling pressure.
The $200k Bitcoin price prediction
Despite short-term hurdles, several analysts believe Bitcoin remains on a long-term path toward $200,000—just not in 2025.
Glassnode lead analyst James Check, in a recent interview with Pahueg at Less Noise More Signal, stated that while hitting $200,000 by year-end is “very improbable” due to insufficient buying volume, he fully expects BTC to exceed that mark within five years.
His outlook reflects broader sentiment: without follow-through volume, even strong rallies risk unravelling.
Others, including Bitwise’s Matt Hougan and Bernstein Research, maintain bullish 2025 targets based on anticipated institutional demand and the growing influence of Bitcoin ETFs.
However, analysts emphasise that BTC must first stabilise above $130K, $140K, and eventually $150K to credibly approach the $200K zone.
These milestones represent both technical and psychological resistance levels.

Shiba Inu to $0.000013: 38 Trillion SHIB Hurdle Awaits Bulls TradingView
Source link ]]>
Shiba Inu to $0.000013: 38 Trillion SHIB Hurdle Awaits Bulls U.Today
Source link ]]>
Shiba Inu (SHIB) Price Rebound Meets New Hurdle, Rise to $0.000020 Unlikely CCN.com
Source link ]]>
Reason to trust
![]()
Strict editorial policy that focuses on accuracy, relevance, and impartiality
Created by industry experts and meticulously reviewed
The highest standards in reporting and publishing
Strict editorial policy that focuses on accuracy, relevance, and impartiality
Morbi pretium leo et nisl aliquam mollis. Quisque arcu lorem, ultricies quis pellentesque nec, ullamcorper eu odio.
Ethereum price started another decline and traded below the $1,850 level. ETH is now consolidating and facing key hurdles near the $1,850 level.
- Ethereum struggled to continue higher above the $1,980 resistance level.
- The price is trading below $1,860 and the 100-hourly Simple Moving Average.
- There was a break above a connecting bearish trend line with resistance at $1,810 on the hourly chart of ETH/USD (data feed via Kraken).
- The pair must clear the $1,850 and $1,880 resistance levels to start a decent increase.
Ethereum Price Attempts Recovery
Ethereum price failed to continue higher above $2,050 and started another decline, like Bitcoin. ETH declined below the $1,880 and $1,850 support levels.
It tested the $1,765 zone. A low was formed at $1,767 and the price recently started a short-term recovery wave. The price climbed above the $1,800 resistance. There was a move above the 23.6% Fib retracement level of the downward move from the $2,033 swing high to the $1,767 low.
There was also a break above a connecting bearish trend line with resistance at $1,810 on the hourly chart of ETH/USD. Ethereum price is now trading below $1,860 and the 100-hourly Simple Moving Average.
On the upside, the price seems to be facing hurdles near the $1,850 level. The next key resistance is near the $1,860 level. The first major resistance is near the $1,900 level and the 50% Fib retracement level of the downward move from the $2,033 swing high to the $1,767 low.

A clear move above the $1,900 resistance might send the price toward the $2,000 resistance. An upside break above the $2,000 resistance might call for more gains in the coming sessions. In the stated case, Ether could rise toward the $2,050 resistance zone or even $2,120 in the near term.
Another Decline In ETH?
If Ethereum fails to clear the $1,850 resistance, it could start another decline. Initial support on the downside is near the $1,800 level. The first major support sits near the $1,780 zone.
A clear move below the $1,780 support might push the price toward the $1,765 support. Any more losses might send the price toward the $1,710 support level in the near term. The next key support sits at $1,665.
Technical Indicators
Hourly MACD – The MACD for ETH/USD is losing momentum in the bearish zone.
Hourly RSI – The RSI for ETH/USD is now above the 50 zone.
Major Support Level – $1,800
Major Resistance Level – $1,850