
Ethereum is trying to hold $2,000. The market is coiling for a significant move. And the organization that has been selling this asset for months has just changed what it is doing with its ETH.
Data from Arkham Intelligence has confirmed a behavioral shift at the Ethereum Foundation that the market has been waiting for without knowing it was waiting: the Foundation has stopped selling ETH and has started staking it. That sentence requires context to carry its full weight.
For much of the past several months, the Ethereum Foundation’s periodic ETH sales represented one of the most psychologically damaging overhangs in the market. Each confirmed sell transaction from the Foundation’s wallets arrived as a signal from the inside — the organization that created Ethereum, that understands its technology more deeply than any outside participant, choosing to convert its holdings into cash. The market interpreted those sales as institutional doubt expressed in the most credible possible form. Price suffered accordingly.
That chapter appears to be closing. Staking is the opposite of selling in every meaningful sense. It is locking, committing, removing from circulation, and earning yield on the conviction that Ethereum’s future justifies the commitment. The Foundation is no longer exiting. It is embedding itself deeper.
This Is No Longer a One-Time Decision
Arkham’s on-chain data documents the specific transaction that makes the behavioral shift concrete: the Ethereum Foundation has staked an additional $46.64 million in ETH, bringing its total staked position to $96.59 million. That cumulative figure is the number that matters most — not because of its size relative to the Foundation’s total treasury, but because of what it represents as a repeated, deliberate, escalating commitment.

A single staking transaction can be dismissed as treasury optimization. Two transactions totaling nearly $100 million cannot. The Foundation has now made the same decision twice, in the same direction, at a price level that the broader market has treated as fragile support. Each transaction is a vote. The second vote confirms the first was not an anomaly.
The supply consequence is direct and permanent for the duration of the stake. $96.59 million in ETH now sits in staking contracts — unavailable for sale, removed from the liquid float, contributing nothing to the sell-side pressure that has weighed on the $2,000 level for weeks. The Foundation’s previous selling added to that pressure. Its current staking position actively reduces it.
The organization that built Ethereum has now committed nearly $100 million to its own protocol at exactly the moment the market is deciding whether $2,000 holds. That timing is not incidental. It is a statement.
Related Reading: $410 Million In Bitcoin Losses Realized In A Week. Two Key Indicators Say the Stress Is Not Over Yet
Ethereum’s weekly structure shows a market at an inflection point, not in a confirmed breakdown. Price is currently holding near $2,060, sitting just above the 200-week moving average — a level that has historically acted as a long-term trend boundary. That positioning matters. Unlike lower timeframes, this is where structural bull and bear regimes are defined.

The rejection from the $4,000–$4,500 region established a clear lower high, breaking the sequence of higher highs that defined the prior expansion phase. Since then, Ethereum has retraced sharply, losing the 50-week and 100-week moving averages, both of which are now flattening and beginning to roll over. That shift signals weakening momentum, but not yet a completed trend reversal.
The key issue is follow-through. The recent bounce off sub-$2,000 levels has not been strong enough to reclaim the 100-week average decisively. Without that, price remains vulnerable to another test of the 200-week level.
Volume does not show aggressive accumulation at current levels. That absence raises a question: is this a structural defense or a temporary pause?
If $2,000 fails on a weekly basis, the next meaningful support sits significantly lower. If it holds, Ethereum remains in a contested but still salvageable long-term structure.
Featured image from ChatGPT, chart from TradingView.com
Editorial Process for bitcoinist is centered on delivering thoroughly researched, accurate, and unbiased content. We uphold strict sourcing standards, and each page undergoes diligent review by our team of top technology experts and seasoned editors. This process ensures the integrity, relevance, and value of our content for our readers.
Dogecoin’s Next Big Move? Deep Dive into the Meme Coin Wall Street Can’t Ignore AD HOC NEWS
Source link ]]>
Cardano Price Prediction for 2026: DeepSnitch AI Looks Like the Ultimate 100x Moonshot, Though ADA and Toncoin Are Hard to Ignore, Too CoinCentral
Source link ]]>
Dogecoin breakout sparks memecoin revival – But don’t ignore THIS risk! AMBCrypto
Source link ]]>
Is Dogecoin About to Rally? Three Bullish Signals Investors Can’t Ignore Coinpaper
Source link ]]>
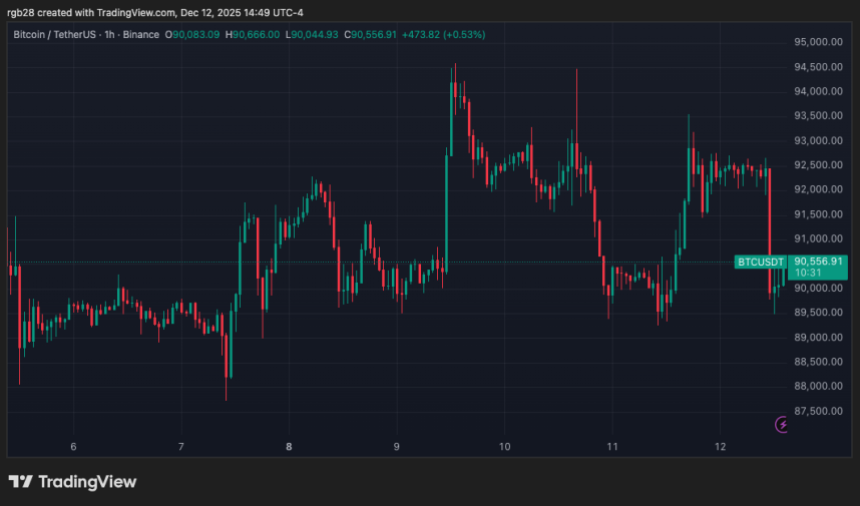
As Bitcoin (BTC) tries to hold the $90,000 barrier, some analysts affirm that the flagship crypto’s bear market signals are becoming clearer, suggesting that a breakdown to new lows could be around the corner.
Related Reading
Bitcoin Bear Flag Raises Concerns
On Friday, Bitcoin shredded its Thursday gains, dropping 3.2% intraday to retest the $89,500-$90,500 support zone once again. The cryptocurrency has been trading between the $84,500-$94,500 range for the past four weeks, briefly falling to a seven-month low of $80,600 during the late November correction.
This week, the flagship crypto’s price has seen more volatility, fueled by the expectations of the Federal Reserve’s interest rate cut and positive regulatory developments in the US. However, BTC has failed to successfully break and hold above its local range’s upper boundary after multiple retests, ultimately falling to the mid-zone of its range.
Analyst Ted Pillows highlighted a concerning pattern on Bitcoin’s chart, warning that the cryptocurrency risks a drop to new multi-month lows if the price fails to hold key support levels.
Per the post, BTC has been forming a bear flag for nearly a month, which “is too hard to ignore” after the price continues to be rejected from the formation’s upper boundary. The analyst affirmed that this pattern follows a trend that has been developing over the past two months.

As he pointed out, bearish flags have been continuously forming on BTC’s chart since the October 10 market pullback, with each pattern resolving in a breakdown to lower levels. To Ted, the new formation signals “that the overall trend is still to the downside.”
He suggested that a close above the $96,000 level would invalidate the bearish pattern. On the contrary, a drop to below the $86,000 support, where the formation’s lower boundary is located, could push Bitcoin to the April lows, around the $76,000 mark.
Is The 2022 Playbook Repeating?
The market observer also noted a resemblance between the last cycle and the current one, which could lead to a drop below the $70,000 level. The chart shows that after losing the 50-Week EMA indications, Bitcoin consolidated within a bear flag before breaking down and descending to the 2022 lows.
Now, BTC displays a similar performance after losing the 50-Week EMA and breaking down from its October bear flag. “If this plays out, a pump to $100,000 and then a dump below $70,000” would follow, the analyst added.
Meanwhile, Robert Mercer shared a similar perspective in a series of X posts. The analyst affirmed that the classic four-year cycle has not changed despite the significant increase in institutional adoption:
Bitcoin is breaking crucial supports one by one and entering a bear market. The same happened back in the end of 2021. At the moment, BTC is forming an ascending channel with the top near $100,000 – $104,000, you can see a clear Right Shoulder of H&S in this move. Something similar happened in the beginning of 2022.
Related Reading
Nonetheless, he concluded that “no such breakdown happens without a retest,” forecasting a relief bounce up to $98,000-$102,000, followed by a dump to the support level of $55,000-$60,000.
As of this writing, BTC Trades at $89,990, a 2.75% decline in the daily timeframe.
Featured Image from Unsplash.com, Chart from TradingView.com
Traders Ignore Bullish Cardano Price Indicators As Market Wide FOMO Hits For ‘SHIB 2.0’ Layer Brett CoinCentral
Source link ]]>
Dogecoin Price Prediction: Ignore $1 Hype, Top Experts Are Targeting $2+ For DOGE Crypto Economy
Source link ]]>
Dogecoin Price Prediction: DOGE Could Hit $1, But Analysts Say Layer Brett’s 150x Upside Is Hard to Ignore Crypto Economy
Source link ]]>
Cardano, Vechain, And Unilabs: 3 Cryptos You Cannot Ignore If You Want 220% Gains BlockchainReporter
Source link ]]>