
Ethereum is navigating a period of heightened volatility and uncertainty as it hovers around the critical $2,000 threshold. While recent price action suggests temporary stabilization after weeks of selling pressure, conviction remains limited. The $2,000 level is functioning less as confirmed support and more as a psychological battleground where short-term positioning, liquidity conditions, and sentiment are colliding.
A recent analysis from Arab Chain offers additional structural insight through the ETH Binance Liquid vs. Illiquid Supply Model. This framework separates Ethereum held on Binance into liquid supply — coins readily available for trading — and illiquid supply, which is comparatively less likely to move in the short term. As of February, Binance’s total ETH reserves stand at approximately 3.57 million ETH. Of this amount, around 1.16 million ETH is classified as liquid supply, while 2.40 million ETH is categorized as illiquid.
This distribution matters. A relatively smaller liquid component can limit immediate sell-side pressure, but it does not eliminate risk if sentiment deteriorates. Conversely, a larger illiquid base may reflect longer holding behavior or strategic positioning rather than imminent distribution.
At a moment when price hovers near a key technical pivot, the composition of exchange reserves becomes a meaningful variable in assessing Ethereum’s next structural move.
Liquid vs. Illiquid Supply Signals A Fragile Equilibrium
The current reserve composition on Binance suggests Ethereum is operating within a structurally balanced environment rather than an immediate distribution phase. With illiquid supply accounting for the majority of the 3.57 million ETH held on the platform, a substantial portion of coins appears relatively dormant. Illiquid balances are typically associated with longer holding horizons or reduced trading frequency, which tends to dampen immediate sell-side pressure.

This matters at a time when ETH is hovering near $2,000. A dominant illiquid share implies that most holders are not actively positioning for a rapid exit. In previous cycles, sharp increases in liquid supply often preceded volatility spikes, as coins became readily available for market execution. That dynamic is not yet evident at scale.
By contrast, liquid supply historically expands during speculative phases, when traders rotate capital aggressively or prepare for directional exposure. The absence of a pronounced expansion suggests that, for now, speculative intensity remains contained.
The relatively stable gap between liquid and illiquid supply indicates equilibrium between holding behavior and active trading. However, this balance is conditional. A meaningful shift toward higher liquid supply would increase the probability of renewed volatility. Conversely, sustained illiquid dominance could help absorb price shocks and moderate downside acceleration.
Ethereum Tests Long-Term Support As Downtrend Accelerates
Ethereum remains under structural pressure as price hovers near the $2,000 region following a sharp breakdown from the $3,200–$3,400 zone. The weekly chart shows a clear loss of bullish structure, with lower highs forming since the late-2025 peak and momentum decisively shifting to the downside.

Price is now trading below the 50-week and 100-week moving averages, both of which are beginning to flatten or slope downward. This configuration typically signals weakening intermediate momentum and a transition into a corrective phase. Notably, Ethereum briefly tested levels near $1,800 before bouncing, suggesting the presence of reactive demand in that liquidity pocket. However, the recovery remains limited and has not yet reclaimed key moving averages.
The 200-week moving average, positioned lower on the chart, remains upward sloping, indicating that the broader macro trend has not fully reversed. Historically, this level has served as strong structural support during deeper cycle corrections. If downside pressure resumes, this zone could become a critical area to monitor.
Volume expanded significantly during the recent selloff, reflecting forced positioning adjustments rather than gradual distribution. Since then, activity has moderated, pointing to temporary stabilization.
Featured image from ChatGPT, chart from TradingView.com
Editorial Process for bitcoinist is centered on delivering thoroughly researched, accurate, and unbiased content. We uphold strict sourcing standards, and each page undergoes diligent review by our team of top technology experts and seasoned editors. This process ensures the integrity, relevance, and value of our content for our readers.
‘Fat-Finger’ Fail? Cardano Whale Torches $6M After Hitting Illiquid USDA Pool CoinDesk
Source link ]]>
Following a rejection at $4,946 on August 24, Ethereum (ETH) is now trading in the low $4,000 level. However, some analysts are still hopeful that ETH is likely to surge beyond $5,000 in the coming weeks, thanks to its rising illiquid supply and positive exchange-traded fund (ETF) momentum.
Ethereum To Hit $5,500 In September?
According to a CryptoQuant Quicktake post by contributor Arab Chain, Ethereum’s latest upswing in August which pushed the digital asset from a range of $3,700 – $4,000 to its latest all-time high (ATH) of $4,946, was largely buoyed by broader market rally and positive ETF inflows.
Related Reading
The analyst noted that ETH reserves on Binance crypto exchange witnessed a sharp uptick in August. The quick surge in inflow of tokens to the exchange shows that holders are choosing to sell or take profits at higher prices.
Arab Chain shared the following chart which shows both liquid (green) and illiquid (beige) ETH supply. According to the chart, the vast majority of ETH supply remains illiquid, creating a structural supply shortage.
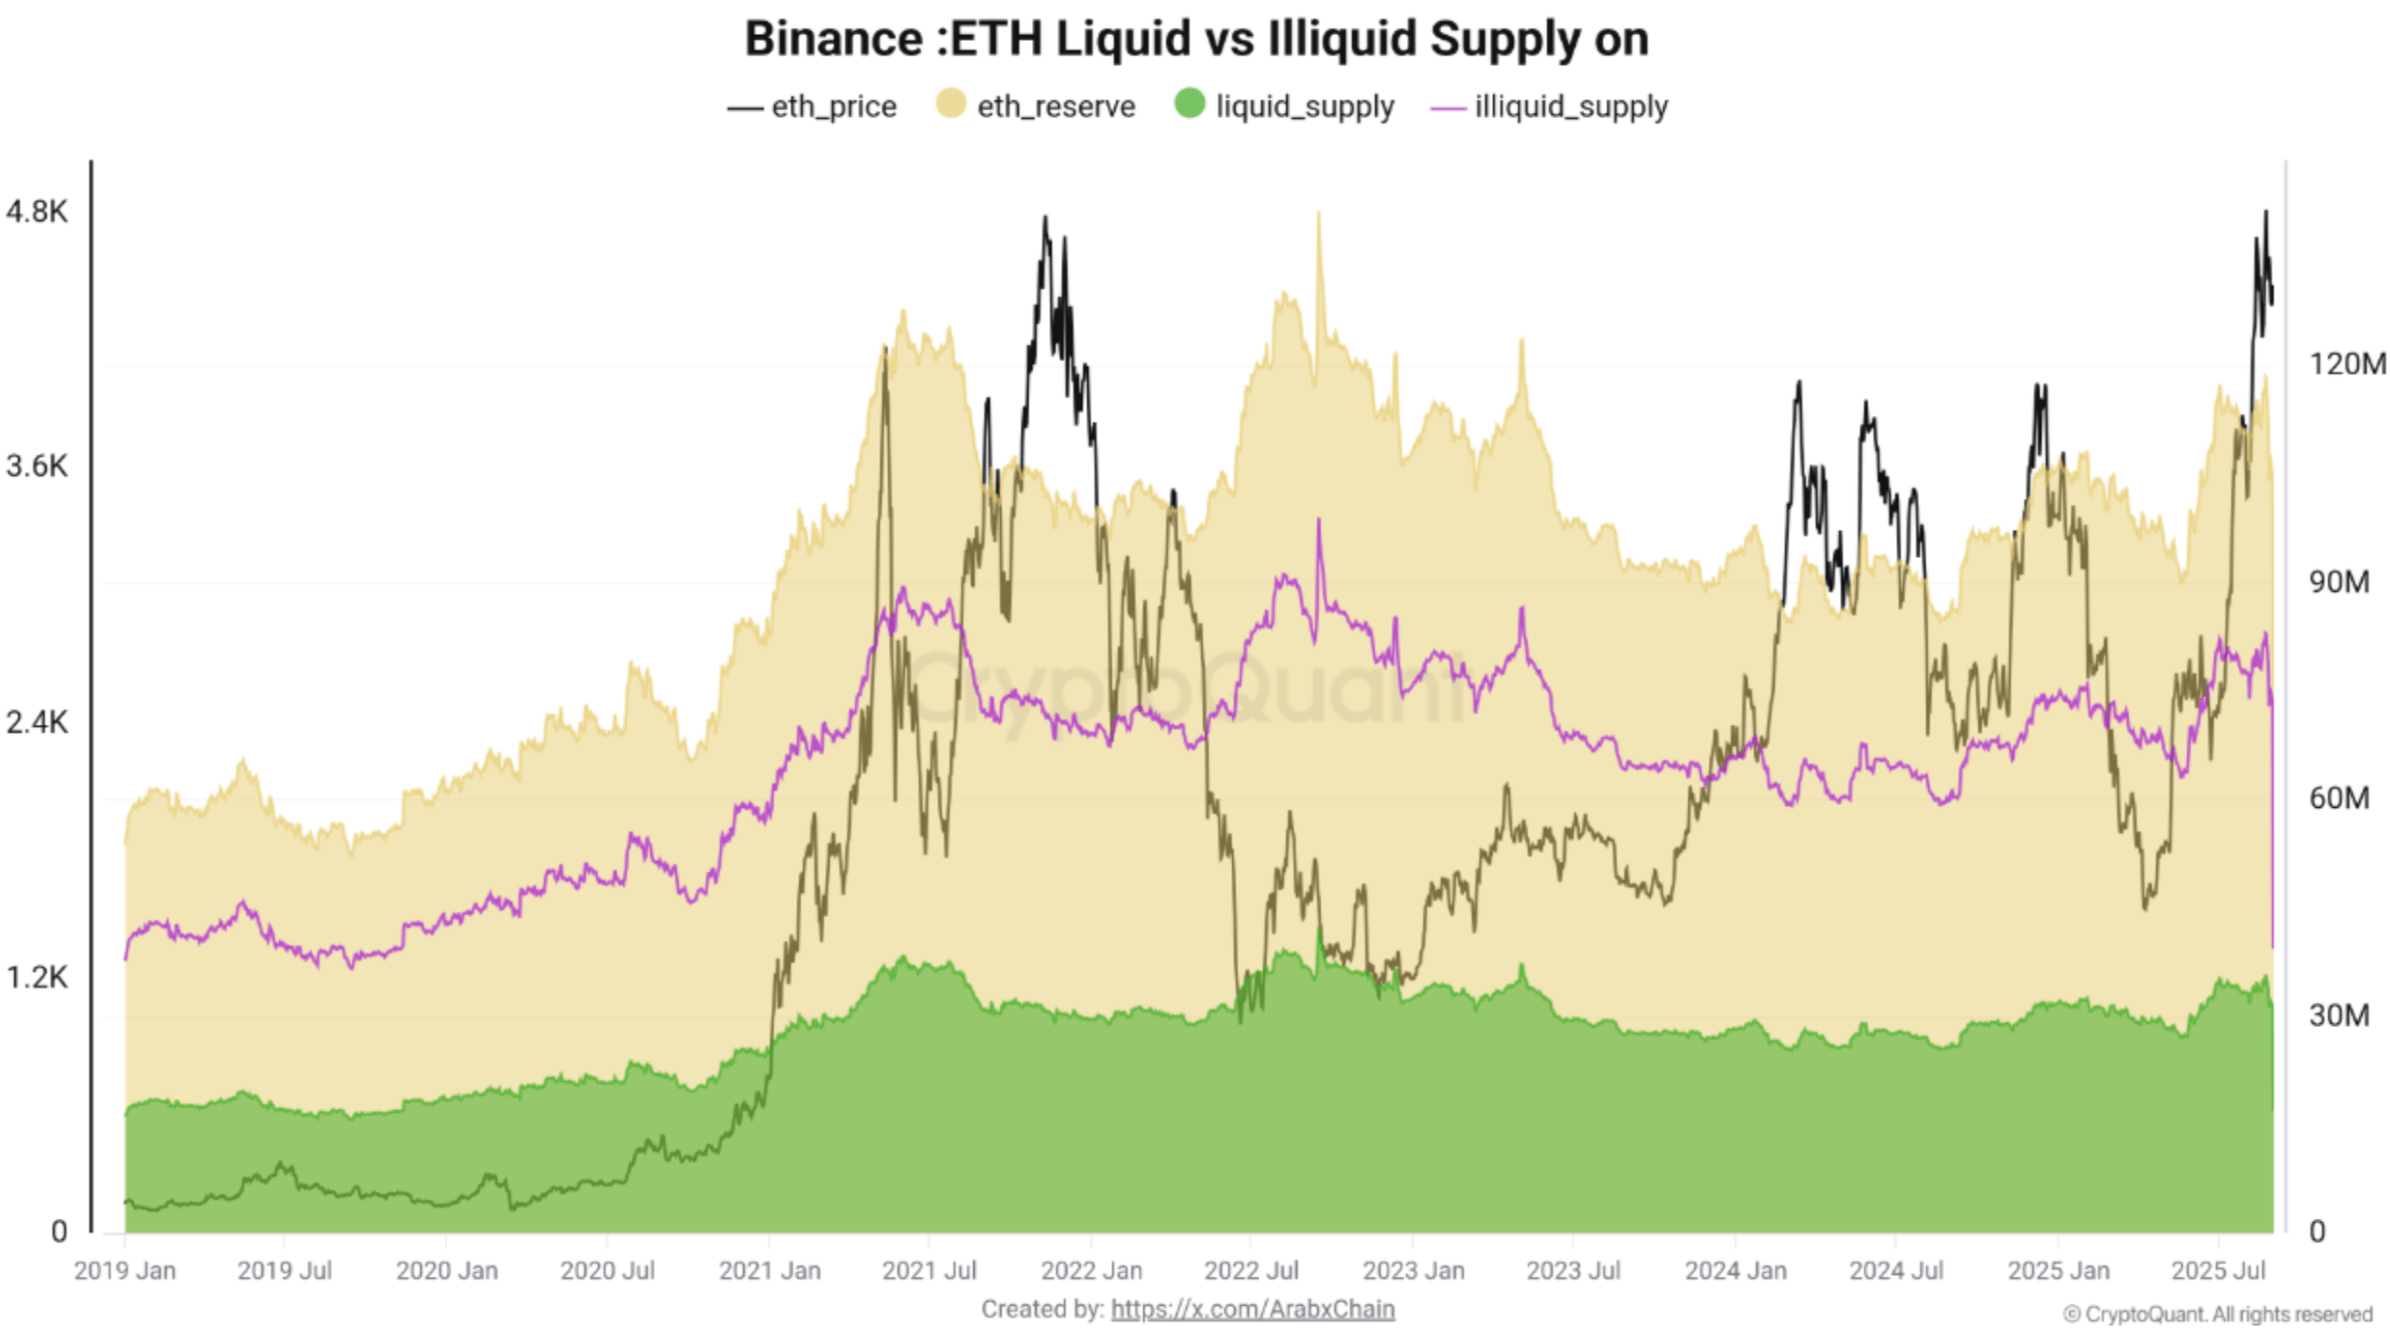
On the other hand, the chart shows a slight increase in the liquid supply, suggesting that a portion of ETH has returned to circulation and could add to short-term selling pressure. The analyst remarked:
The overall illiquidity of the supply reinforces the long-term bullish outlook. Short-term cautionary signals – rising Binance reserves combined with a small increase in liquid supply – suggest a potential correction after the recent strong upswing.
If the growth in ETH reserves on Binance shows signs of slowing down or withdrawals resume, the digital asset’s supply shortage will remain pronounced. Consequently, a clear and decisive break above the $4,800 resistance level could propel ETH toward $5,200 – $5,500 in the near term.
The CryptoQuant analyst concluded by saying that September is likely to witness sideways to a slightly bullish move for ETH between $4,300 to $5,000. However, a failure to break through the $4,800 level – coupled with rising exchange reserves – could raise the possibility of a correction to $4,200.
What’s In Store For ETH?
While a breakout above $4,800 is possible, some analysts are tempering their expectations by saying that ETH may test the psychologically important $4,000 level before resuming its uptrend.
Related Reading
Meanwhile, on-chain data shows whales accumulating ETH at record pace. According to a recent report, ETH whales added a whopping 260,000 ETH to their wallets on September 1.
Offering a more ambitious prediction, Ethereum co-founder and ConsenSys CEO Joseph Lubin recently said that “ETH will likely 100x from here.” At press time, ETH trades at $4,429, up 2% in the past 24 hours.

Featured image from Unsplash, charts from CryptoQuant and TradingView.com
Glassnode data reveals intriguing trends in the Bitcoin market, with the illiquid supply of BTC continuing to expand and Bitcoin dominance on the rise. These developments suggest a strong inclination towards HODLing and a shifting of capital from altcoins to major cryptocurrencies.
BTC HODLers Multiply
According to Glassnode, the illiquid supply of Bitcoin is steadily increasing at a rate of +119K BTC per month. This indicates that coins are increasingly accumulating in wallets with minimal transaction history, reinforcing the notion that HODLing remains the prevailing market dynamic.
This trend suggests that a significant portion of BTC holders are choosing to retain their coins rather than actively trading or selling them.

In parallel, Bitcoin dominance has been climbing, currently standing at 47.6%, representing a year-to-date increase of 7.6%. This upward trajectory indicates a consistent rotation of capital from altcoins to major cryptocurrencies.
As investors seek liquidity and stability, they are favoring the most established and liquid crypto asset, Bitcoin. This phenomenon highlights the growing preference for the market leader and the continued consolidation of capital in Bitcoin.

Bitcoin Price Action
Bitcoin’s price has seen some fluctuations, with a 0.33% increase in the past hour. However, it has experienced a 4.41% decline over the past 24 hours, dropping below $25K for the first time in 3 months is true.
BTC couldn’t stay in a positive zone after the Fed’s interest rate decision and fell below the $25,500, a new weekly low. This comes in when the Federal Reserve pauses rate hikes for the first time in the last 15 months.
Read CoinGape’s story on crypto market sell off today, where Ethereum and XRP turned out to be one of the biggest losers in the ongoing sell-off.

AD
The presented content may include the personal opinion of the author and is subject to market condition. Do your market research before investing in cryptocurrencies. The author or the publication does not hold any responsibility for your personal financial loss.
Data from on-chain analytics firm Glassnode shows that despite price volatility, rising inflation, and geopolitical tensions, the majority of the BTC supply has not left its wallet since the start of the year. It signifies the rising appeal of Bitcoin among institutional and retail investors, with nobody interested in selling it.
Glassnode tweeted on Monday that the Bitcoin Illiquid Supply Shock Ratio (ISSR), which represents the coins held in wallets with little to no history of spending, has ticked significantly higher this week.
Bitcoin Interest Rises Among Investors
The Bitcoin Illiquid Supply Shock Ratio, first developed by on-chain analyst Will Clemente, has been moving significantly higher since the start of the year. And, this week, the ratio jumps even higher. The illiquid BTC supply represents coins held in wallets with little to no history of spending. It is now 3.2 times larger than Liquid and Highly Liquid supply combined.
The #Bitcoin Illiquid Supply Shock Ratio, first developed by @WClementeIII, has ticked significantly higher this week.
Illiquid $BTC supply represents coins held in wallets with little to no history of spending. It is now 3.2x larger than Liquid and Highly Liquid supply combined pic.twitter.com/N0xejizRDE
— glassnode (@glassnode) March 13, 2022
The data is important as it implies that long-term hodlers are patiently hodling because they know what’s likely coming soon. Even Elon Musk says he is not planning to sell his Bitcoin, Ethereum, and Doge despite rising inflation. Musk’s tweet pushed crypto prices slightly higher on Monday, with Bitcoin rising nearly 2% to above $39,000.
Moreover, as per the historic price movement, a downtrend on two previous occasions in 2016 and 2020 followed and preceded a major bounceback in Bitcoin price action.
However, Other factors must also be considered, such as EU ministers are expected to vote on approving two versions of the MiCA bill, one with the POW ban and one without it. The high energy cost and carbon footprint of mining POW tokens is a sticking point for the EU parliament.
Meanwhile, over the weekend, a comparison of top assets by market cap indicates that Bitcoin, and are showing signs of traders expecting price rises. However, trader sentiment is negative on , as per a tweet from Santiment, a financial market data and content platform.
A comparison of #crypto‘s top assets by market cap reveals #Bitcoin, #XRPNetwork, and #BinanceCoin are showing signs of traders expecting price rises. Meanwhile, #Polkadot is one of the few top caps where trader sentiment is more negative than usual. https://t.co/nlBy5q9oMz pic.twitter.com/9QgSI5oV2E
— Santiment (@santimentfeed) March 13, 2022
Disclaimer
The presented content may include the personal opinion of the author and is subject to market condition. Do your market research before investing in cryptocurrencies. The author or the publication does not hold any responsibility for your personal financial loss.
About Author
The way bitcoin holders move the BTC in and out of their wallets can often be a strong indicator of where the market might be headed next. Not just the movements of the asset, but where they are being moved to. An example of this is when more investors are moving their holdings to exchanges, which means that sell sentiment has risen and investors are dumping their coins, and vice versa.
In this same line, looking at the liquid and illiquid supply of bitcoin can also be another strong indicator. And this time around, the percentage of bitcoin supply that remains illiquid point towards a bull trend and hold sentiment among investors.
Bitcoin Illiquid Supply At 4-Year Highs
Bitcoin illiquid levels have shot up in the past few years. In 2017, the total illiquid supply of BTC had risen above 76%. This number had remained under this level for the next four years, until now. Currently, the total BTC illiquid supply has risen back above 76% to its present 76.%. It points to more investors being more interested in holding their assets for the long term.
Related Reading | Bitcoin Supply On Exchanges Hits New Multi-Year Low Of 13.27%
Total liquid and highly liquid supply are split between 23.8% of the supply. The illiquid supply is held in wallets that show little to no history of spending of any kind. These wallets have held on to their holdings for longer than a year for the most part, and their history point towards the owners being in full accumulation mode. The contents of these wallets have barely moved, and if so, have not been in the direction of exchanges.

Illiquid supply touch four-year highs | Source: Glassnode
Price and illiquid supply are now going in opposite directions of each other. While the price is going down, pointing towards bearish sentiment, the volume of illiquid supply is going up. This report shows that illiquid supply went up by 0.27% over the course of a week, showing bullish sentiment among investors.
Exchange Outflows Grow
Bitcoin exchange outflows have also surpassed inflows in recent times, contributing to the growing illiquid supply. The past week saw outflows hit as high as 59K BTC per month leaving exchanges. The illiquid supply has been placed at approximately 51K BTC for the same time period. So, it is only natural to assume that the exchange outflows are being moved to personal storage by investors.
Total change reserves have continued to decline in light of this. For the first time in over two years, the total supply on Bitcoin exchanges has reached 13.27%, one of the lowest ever recorded.

BTC supply on exchanges drops to 13.55% | Source: Glassnode
As for the digital asset, its price movements have maintained a particular trend. With the low momentum in the market, the digital asset has been unable to move upwards out of its $37,000 price point. Meanwhile, it has not fallen below this point either, showing that bulls are still successfully holding up the asset despite being in a bearish trend.
Related Reading | Bitcoin Inflows Suggest Institutional Investors Are Moving Back Into The Market
Exchange outflows and illiquid supply currently point to an accumulation sentiment as fewer and fewer coins are being spent and sold with each downtrend.
BTC down to $37,000 | Source: BTCUSD on TradingView.com
Featured image from The Crypto Associate, charts from Glassnode and TradingView.com
Data shows Bitcoin supply has been relatively illiquid recently as long-term holders haven’t started realizing profits much.
Bitcoin Supply Last Moved Within 30 Days Has Been Relatively Low
As per the latest weekly report from Arcane Research, despite a rise in BTC’s price recently, the supply moved within the last 30 days hasn’t risen much.
The percentage of Bitcoin supply last moved in the past 30 days is an important indicator that tells us about the liquidity of the market.
Usually, when coins start aging more, they become less likely to be moved. Because of this reason, a low proportion of short-term supply implies low liquidity in the market. This can be a bullish signal for BTC.
On the other hand, if a high percentage of Bitcoin supply is young, then the liquidity would be high. This may be a sign of bearish trend.
Based on the trend of the indicator, it may be possible to tell whether the market is nearing a peak or not. Here is a chart that shows how the value of the BTC young supply has changed since 2017:

Looks like the current percentage of supply moved in the last thirty days is relatively low | Source: The Arcane Research Weekly Update - Week 44
The above graph shows some interesting features between the indicator and the Bitcoin price during the two bull runs of 2017 and 2018.
Related Reading | Bitcoin Sentiment Suggests Serious Greed, But Will A Correction Come?
In 2017, whenever the short-term supply peaked, the price of the crypto also made a top. But the trend didn’t hold true in 2021 as the sole sharp spike in the metric has been followed by a strong bull market that lasted three months.
The sharp spike in the short-term supply this year was seen when Bitcoin broke the 2017 all-time high. Long-term holders started selling then, increasing the liquidity.
The demand for the coin only increased in the following months, but the supply shock became too big. The price started moving down soon after.
Related Reading | S2F Creator PlanB Believes In $98k Nov Target For Bitcoin
Currently, the short-term supply is sitting at a healthy 10%, which means it has enough room to grow still, despite already making a new ATH. This means that if Bitcoin’s strength remains, the market can still grow before hitting a top.
BTC Price
At the time of writing, Bitcoin’s price floats around $68.2k, up 10% in the last seven days. Over the past month, the crypto has gained 18% in value.
Below is a chart that shows the trend in the price of the coin over the last five days.

BTC's price has made a new ATH above the $68k mark | Source: BTCUSD on TradingVIew
Featured image from Unsplash.com, charts from TradingView.com, Arcane Research