
Ethereum’s current price structure is being compared to a phase that once played out in a major stock price, where years of sideways movement and repeated rejections eventually gave way to a powerful breakout above resistance. The comparison, shared by crypto analyst Crypto Tice on X, points out that what looks like long-term stagnation around $2,000 on Ethereum’s chart may be a setup that has appeared before in Netflix’s price history.
A Repeating Structure Inside A Range
Technical patterns have a way of resurfacing across different markets, which is why analysts often study past price behavior of one cryptocurrency to predict how another cryptocurrency could also play out in the future. In many cases, these comparisons stay within the crypto market itself or extend to traditional stores of value like precious metals, where similarities in cycles and investor behavior are easier to justify.
This analysis, however, takes a different approach by stepping outside those usual comparisons. It provides a comparison between Ethereum’s current price structure and the way Netflix, Inc. (NFLX) traded between 2003 and 2009.
The chart highlights a sequence of six distinct interactions with range boundaries in both assets. In Netflix’s case, the price spent years bouncing between support and resistance, forming a compressed structure with multiple failed breakout attempts. Each rejection added to the range but also built pressure over time.
Ethereum’s price action on a multi-year timeframe is showing a nearly identical formation. Since 2021, the Ethereum price has repeatedly pushed into resistance around $4,900, pulled back to support, and returned again for another attempt.
The current price action, which is the sixth interaction, places Ethereum near the lower boundary of the range, which is just the same stage Netflix was before its eventual breakout.

Price Chart Comparison. Source: @CryptoTice_ On X
Pressure Building. What Comes Next?
The structure outlined in the chart ultimately points to one outcome: a breakout rally. This is how Netflix broke out of the resistance trendline in 2009. The important thing for Ethereum now is reclaiming and holding above resistance above $4,900 with conviction. However, there are other intermediate price targets that Ethereum needs to break above before this move. These targets include $2,150, $2,350, $3,100, $3,900, and $4,600.
The analogy, however, is not without its critics. Some comments argue that comparing Ethereum to Netflix ignores the fundamental differences between the two. One comment, for instance, noted that Netflix’s consolidation took place during a period of steady business expansion, with clear growth in subscribers and revenue supporting its long-term trajectory.
Ethereum’s situation, on the other hand, is more layered and has a different economic regime. The rise of Layer 2 networks has moved activity away from the base layer, reducing fee generation at the protocol level. These factors, and many others, introduce unknowns that cannot be represented through chart structure.
Featured image created with Dall.E, chart from Tradingview.com
Editorial Process for bitcoinist is centered on delivering thoroughly researched, accurate, and unbiased content. We uphold strict sourcing standards, and each page undergoes diligent review by our team of top technology experts and seasoned editors. This process ensures the integrity, relevance, and value of our content for our readers.
Cardano Still an Interesting Trade Opportunity: Top Analyst Cryptonews.net
Source link ]]>
The Ethereum Foundation is making headlines once again for selling ETH, but this time the spotlight is also on the buyer. The foundation has dumped approximately 5,000 ETH amid broader market volatility and fluctuating prices. The foundation has provided reasons for its large-scale ETH sale, citing ongoing support of operations and activities.
Ethereum Foundation Sells ETH To Crypto Company
The Ethereum Foundation has completed a new ETH sale to support its ongoing development efforts. In an X post on March 14, the organization announced that it was offloading 5,000 ETH, worth approximately $10 million, at an average price of $2,042.96 through an over-the-counter (OTC) transaction. The buyer in this deal is Bitmine, a publicly traded Bitcoin mining company that operates under the ticker BMNR.
According to the Ethereum Foundation, the ETH transaction was confirmed on-chain through the organization’s Safe multisig wallet at address: 0x9fC3dc011b461664c835F2527fffb1169b3C213e. The sale represents part of the foundation’s broader treasury management strategy, which is guided by detailed policies published in 2025.
The Ethereum Foundation has also stated that the funds raised from the sale will be used for its core operations and activities. These include protocol research and development, ecosystem management, and community grant funding. Bitmine’s involvement as an OTC counterparty highlights a growing network of institutional buyers interested in participating in the Ethereum ecosystem. The company has continued to buy ETH even during volatile market conditions.
Notably, the move also follows a series of previous ETH sales by the organization, demonstrating a structured approach toward funding its operational and developmental priorities. In July 2025, the foundation sold 10,000 ETH to SharpLink Gaming through a similar OTC arrangement. Before that, the Ethereum Foundation had carried out dozens of small ETH sales throughout the year, quietly offloading thousands of coins across multiple transactions to cover operational costs.
Foundation’s Policy Guides For ETH Sales
The Ethereum Foundation’s treasury policy, published in July 2025, is designed to support the long-term sustainability of the blockchain’s ecosystem. The policy emphasizes that all capital deployments must balance the earning returns above a set benchmark rate while also supporting the Ethereum network and adhering to core principles.
Regarding ETH sales specifically, the policy explains that the foundation will regularly measure the extent to which its fiat-denominated assets differ from its Opex Buffer target. Based on that calculation, they will decide how much ETH, if any, to sell over the next three months. These sales can happen either through fiat off-ramps or on-chain swaps into fiat-denominated assets.
While the organization has explained the reasons for its ETH sales, the broader market could still feel its impact. Ethereum is trading above $2,200 after rising by more than 12% over the past 24 hours. While its price appears to be rebounding from its previous downtrend, large-scale ETH sales, especially from prominent entities, could influence market sentiment and price stability.
Featured image from Pixabay, chart from Tradingview.com
Editorial Process for bitcoinist is centered on delivering thoroughly researched, accurate, and unbiased content. We uphold strict sourcing standards, and each page undergoes diligent review by our team of top technology experts and seasoned editors. This process ensures the integrity, relevance, and value of our content for our readers.
How Low Can Cardano (ADA) Go in February: 4 AIs Make Interesting Predictions CryptoPotato
Source link ]]>
Crypto analyst Steph has pointed to an “interesting” chart, which has previously led to an XRP price rally. This came as the analyst also suggested that the altcoin may be forming a bottom in preparation for the next leg to the upside.
Analyst Shares Why This Chart Is Interesting For The XRP Price
In an X post, Steph highlighted the 3-week XRP price chart, stating that it was “interesting” for one reason. He revealed that the Stochastic Relative Strength Index (RSI) has dropped to 0.00 on the 3-week timeframe, which is extremely rare and has only happened once before, which was the 2022 bear market bottom.
Related Reading
Steph further explained that on such a high timeframe, this indicator only reaches zero when selling pressure is fully exhausted, which is a positive for the XRP price. The analyst added that this means that momentum to the downside has dried up, although he warned that this doesn’t mean that price must instantly reverse.

Steph noted that the last time this signal appeared, the XRP price entered a long accumulation phase before the next major move higher. As such, the analyst claimed that this again suggests that the downside risk is structurally limited and that long-term holders are absorbing supply rather than distributing. He further remarked that these signals tend to mark cycle lows rather than short-term trades.
The XRP ETFs also mark a positive for the XRP price as these funds maintain their inflows streak. These funds have recorded daily inflows since the Canary’s fund launched on November 13. As a result, they now boast net assets of over $1.1 billion, even as XRP continues to see significant demand from institutional investors.
XRP Remains Below Key Levels
In an X post, CryptoXLarge stated that on the weekly chart, the XRP price remains below the descending trendline around the 8 to 21 EMA levels. He further remarked that this week, the price is attempting to break below the key support zone around $1.95, which aligns with the Fib 0.5 level and the 89-week EMA, which is a support that has held throughout the year.
Related Reading
CryptoXLarge stated that a weekly close below this level could increase the probability of a move toward the $1.60 support, which is the Fib 0.618. Meanwhile, a weekly close above $1.95 may boost buying interest, which could trigger a relief XRP price rally toward $2.30 and then $2.70. Crypto analyst Crypto King also echoed a similar sentiment, stating that a reclaim of $1.98 could eventually send the altcoin to as high as $3.66.
At the time of writing, the XRP price is trading at around $1.87, up in the last 24 hours, according to data from CoinMarketCap.
Featured image from Adobe Stock, chart from Tradingview.com
Analyst Highlights Interesting Dogecoin Double Top Adam & Eve Pattern TradingView
Source link ]]>
Why is Cardano (ADA) Price Crashing? Analysts Note Interesting Rotation Toward Cheaper Crypto at $0.035 and With Better Tech Cryptopolitan
Source link ]]>
Bitcoin has held up strongly compared to the companies that have adopted it as part of their treasury strategy, but the gap between the digital asset and these firms is becoming more pronounced.
Over the last 10 weeks, stocks of Bitcoin Treasury Companies (BTCTCs) have fallen sharply, shedding between 50% and 80% of their value. This divergence shows an unusual pattern, effectively creating a “1:4 ratio” in cycle behavior.
Related Reading
12 Mini-Bear Markets In 18 Months
Bitcoin’s price action in the past 18 months has mostly been in a bullish cycle on the macro end, with the leading cryptocurrency creating new price highs upon new price highs within this period. This has caused an increase in many companies adopting a Bitcoin treasury strategy in their balance books, also known as Bitcoin Treasury Companies (BTCTCs).
However, according to data from crypto commentator Mark Moss, the stock prices of companies with a Bitcoin strategy have diverged from Bitcoin, shedding between 50% and 80% of their stock value over the last ten weeks. This divergence, Moss noted, shows an unusual 1:4 cycle ratio where corporate Bitcoin holders undergo four mini-cycles for every one Bitcoin market cycle.
The Japanese firm MetaPlanet is the prime case study for this occurrence. Over the last 18 months, its stock ($MTPLF) has gone through 12 distinct drawdowns, ranging from sharp single-day plunges to prolonged declines stretching over months. On average, these downturns erased 32.4% of value and lasted about 20 days. The shortest correction was a brutal one-day slide of 22.2% in April 2024, while the longest and deepest crash lasted 119 days from July to November 2024, wiping out 78.6%.
The chart below, of MetaPlanet’s stock, shows repeated selloff cycles that appear far more compressed and extreme than Bitcoin’s price corrections in the past 18 months or so.
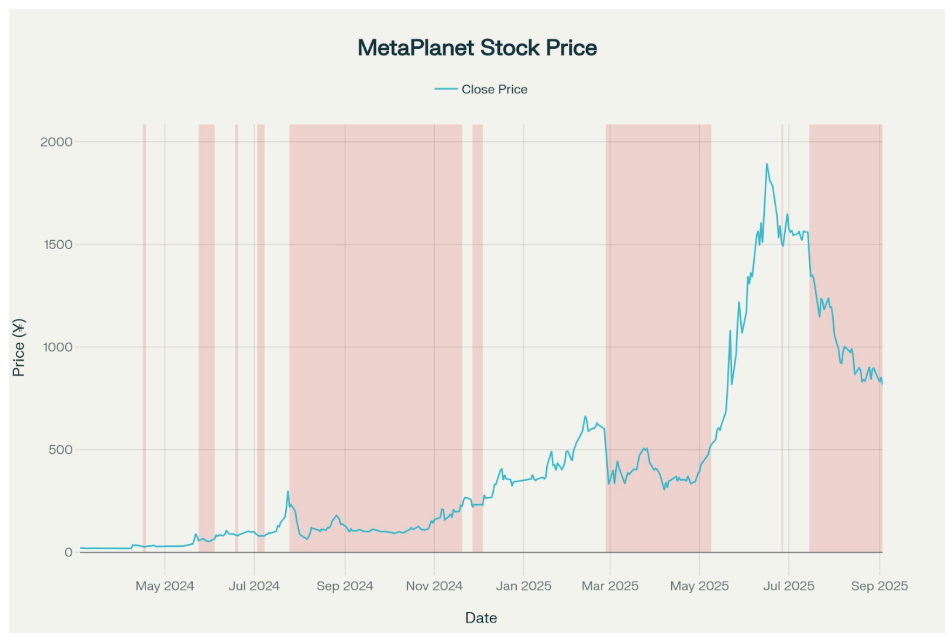
MetaPlanet Stock Price: Mark Moss on X
Correlation With Bitcoin?
Interestingly, only 41.7% of MetaPlanet’s drawdowns have directly lined up with Bitcoin’s corrections. Out of the 12 mini-bear markets identified, just 5 occurred in sync with BTC’s declines. The majority (7 out of 12) were unrelated to Bitcoin and were instead caused by company-specific factors. According to Moss, these factors include warrant exercises, fundraising activities, and compression of the Bitcoin premium that MetaPlanet trades at compared to its BTC holdings.
The two most severe drawdowns, however, did overlap with Bitcoin volatility. The -78.6% collapse in late 2024 and a -54.4% drawdown both coincided with periods when Bitcoin itself was undergoing corrections. These overlapping events suggest that while BTC volatility sometimes adds to the drawdown, MetaPlanet’s stock selloffs tend to extend beyond Bitcoin downturns.
Essentially, what this means is that instead of BTC 4-year cycles, BTCTCs are now more like 4 cycles in 1 year.
At the time of writing, Bitcoin is in a correction phase and is struggling to hold above the $110,000 support level. Popular BTCTC stocks are also struggling with downtrends alongside Bitcoin. Strategy’s stock is down 37.1% from its 52-week high, while MetaPlanet is down 58.6%. Others, like The Smarter Web Company PLC (-83.6%) and The Blockchain Group (-70.7%), are at greater losses.
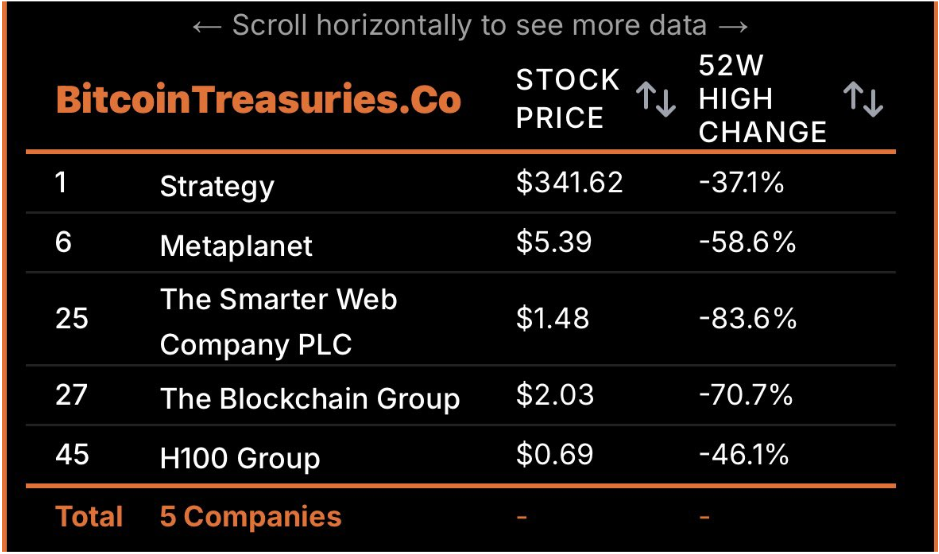
BTCTC Stock Prices: BitcoinTreasuries
Related Reading
Featured image from Unsplash, chart from TradingView
Interesting Times For Shiba Inu: Potential 500% Upside, Target $0.00008 CryptoRank
Source link ]]>
Reason to trust
![]()
Strict editorial policy that focuses on accuracy, relevance, and impartiality
Created by industry experts and meticulously reviewed
The highest standards in reporting and publishing
Strict editorial policy that focuses on accuracy, relevance, and impartiality
Morbi pretium leo et nisl aliquam mollis. Quisque arcu lorem, ultricies quis pellentesque nec, ullamcorper eu odio.
Bitcoin (BTC) has surged nearly 4% in the past 24 hours amid the ongoing volatility. As the price retests the $85,000 resistance, some analysts suggest a jump to $90,000 could be around the corner.
Related Reading
Bitcoin Retests $85,000 Barrier
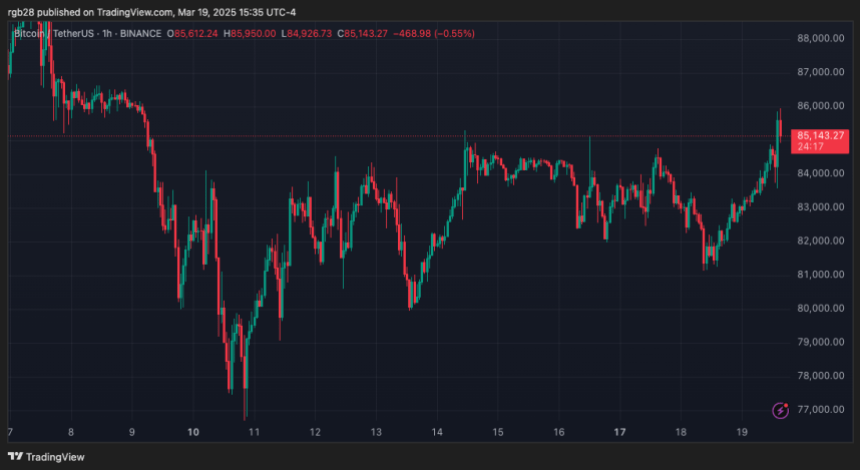
On Wednesday, Bitcoin broke above the $85,000 resistance after surging over 5% from yesterday’s lows. The flagship crypto has been unable to reclaim the $85,000-$86,000 zone throughout the last 10 days, struggling to hold the $84,000 support during this period.
Nonetheless, BTC climbed over the last 24 hours ahead of Today’s Federal Open Market Committee (FOMC) meeting. As some market watchers pointed out, the expectations of Federal Reserve Chair Jerome Powell’s statement could “make or break” the recent reclaim of key support levels.
Analyst CRG explained, “The rate change (or lack thereof) at FOMC is usually not important (unless surprise change) – as it’s baked in. It’s the forward guidance, tonality, etc., that’s important. New info surrounding the end of QT/dot plot revisions important to watch today.”
The Federal Reserve announced its interest rate decision, setting the upper bound at 4.50%. As Wu Blockchain reported, the decision was in line with the expected rate and unchanged from the previous one.
Meanwhile, “The dot plot indicates an expected 50 basis point rate cut in 2025. Additionally, starting in April, the Fed will slow the pace of balance sheet reduction, lowering the monthly Treasury redemption cap from $25 billion to $5 billion while maintaining the cap for agency debt and MBS at $35 billion.”
Daan Crypto Trades noted that BTC’s price could “get quite interesting” with the FOMC volatility. The news could send the flagship crypto to reclaim the key $85,000 barrier or retrace to the range lows.
According to the trader, Bitcoin’s liquidation heatmap showed a “few big clusters on both sides” of the weekly range. As a result, the $80,000-$81,000 and $85,000-$86,000 price ranges are two key zones to watch amid the ongoing volatility.
BTC Must Hold This Key Zone
The Federal Reserve’s report propelled Bitcoin’s price to a 10-day high of $85,880, registering a 3.8% surge in the daily timeframe. Daan warned investors that the current $84,000-$85,000 range is a key level to overcome, as BTC has been “unable to break back above the Daily 200MA/EMA cluster.”
Reclaiming this zone could send Bitcoin back to the $90,000 resistance and reclaim its post-election breakout price range. On the contrary, a rejection could see BTC hit new lows, risking a fall to the $73,500 mark.
Analyst Rekt Capital noted a decline in seller volume over the last few days, which has allowed buyers “to step in.” According to the analyst, “Buyers need to showcase above-average volume for there to be more conviction in this move.”
Related Reading
Additionally, he highlighted that Bitcoin’s Daily Relative Strength Index (RSI) has turned into a resistance level as it has been in a downtrend since November 2024. To him, this level is worth watching in the future since “an RSI Downtrend break would likely precede a trend reversal to the upside in price.”
As of this writing, Bitcoin trades at $85,132, a 4.9% increase in the past week.
Featured Image from Unsplash.com, Chart from TradingView.com