The market intelligence platform IntoTheBlock has revealed how Ethereum has built up strong on-chain demand zones that should keep it afloat above $4,000.
Ethereum Has Two Major Support Centers Just Below Current Price
In a new post on X, IntoTheBlock has discussed about how the on-chain demand zones for Ethereum are looking right now. Below is the chart shared by the analytics firm that shows the amount of supply that the investors bought at the price ranges near the current spot ETH value.
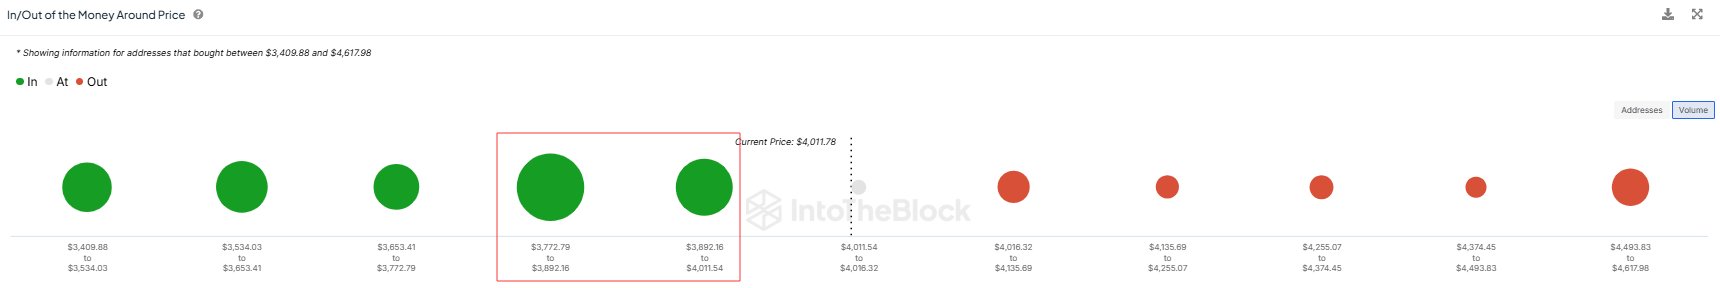
As is visible in the graph, the Ethereum price ranges up ahead have only small dots associated to them, meaning not much of the supply was last purchased at those levels.
It’s different for the price ranges below, however, with the $3,772 to $3,892 and $3,892 to $4,011 ranges in particular hosting the cost basis of a significant amount of addresses. In total, the investors purchased 7.2 million ETH (worth almost $28.4 billion at the current exchange rate) at these levels.
Related Reading
Demand zones are considered important in on-chain analysis due to how investor psychology tends to work out. For any holder, their cost basis is an important level, so they can be more likely to make a move when a retest of it occurs.
When this retest occurs from above (that is, the investor was in profit prior to it), the holder might decide to purchase more, thinking that the level would be profitable again in the near future. Similarly, investors who were in loss just before the retest might fear another decline, so they may sell at their break-even.
Naturally, these effects don’t matter for the market when only a few investors participate in the buying and selling, but visible fluctuations can appear when a large amount of holders are involved.
The aforementioned price ranges satisfy this condition, so it’s possible that Ethereum retesting them would produce a sizeable buying reaction in the market, which would end up providing support to the cryptocurrency.
During the past day, Ethereum has seen a slight dip into this region, so it now remains to be seen whether the high demand can push back the coin above $4,000 or not.
Related Reading
In some other news, the Ethereum Exchange Netflow has been negative since the beginning of this month, as IntoTheBlock has pointed out in another X post.
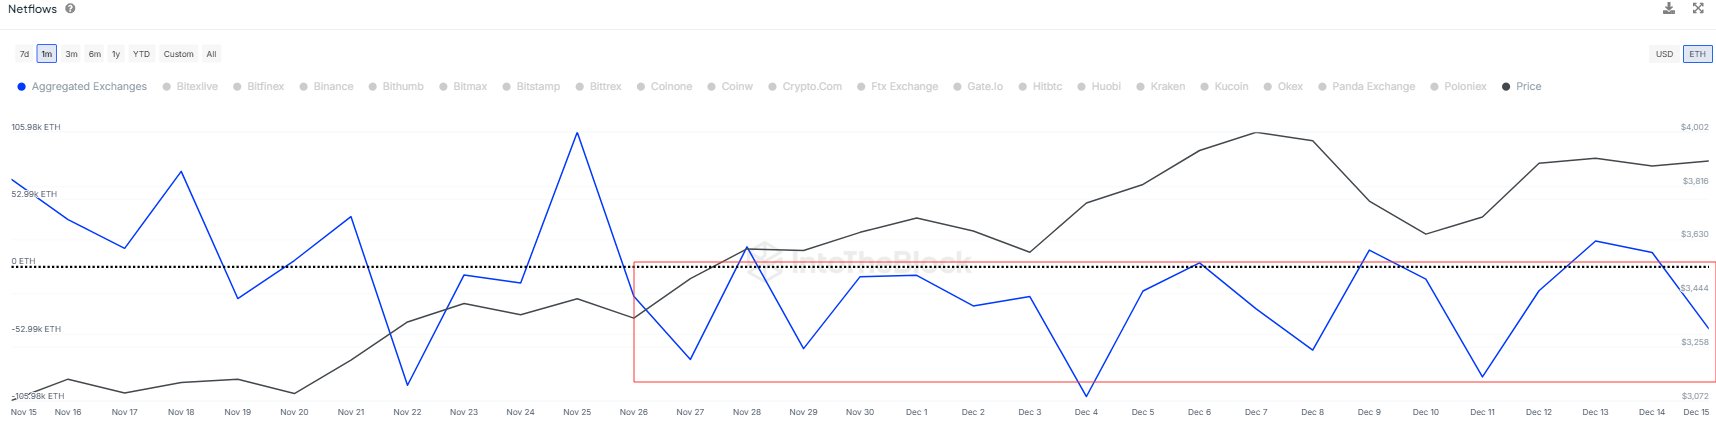
The Exchange Netflow is an on-chain indicator that keeps track of the net amount of Ethereum that’s flowing into or out of the wallets associated with centralized exchanges. “Over 400k ETH have flowed out since December 1st, suggesting a trend of accumulation,” notes the analytics firm.
ETH Price
At the time of writing, Ethereum is trading around $3,950, up 10% over the last week.
Featured image from Dall-E, IntoTheBlock.com, chart from TradingView.com
IntoTheBlock has explained how Ethereum could challenge its all-time high (ATH) based on the current on-chain cost basis distribution.
Ethereum Has Little Resistance On The Path To New ATH
In a new post on X, the market intelligence platform IntoTheBlock has talked about what the on-chain cost basis distribution is like for Ethereum right now. Below is the chart shared by the analytics firm that breaks down the amount of coins that the investors bought in each price range near the current one.
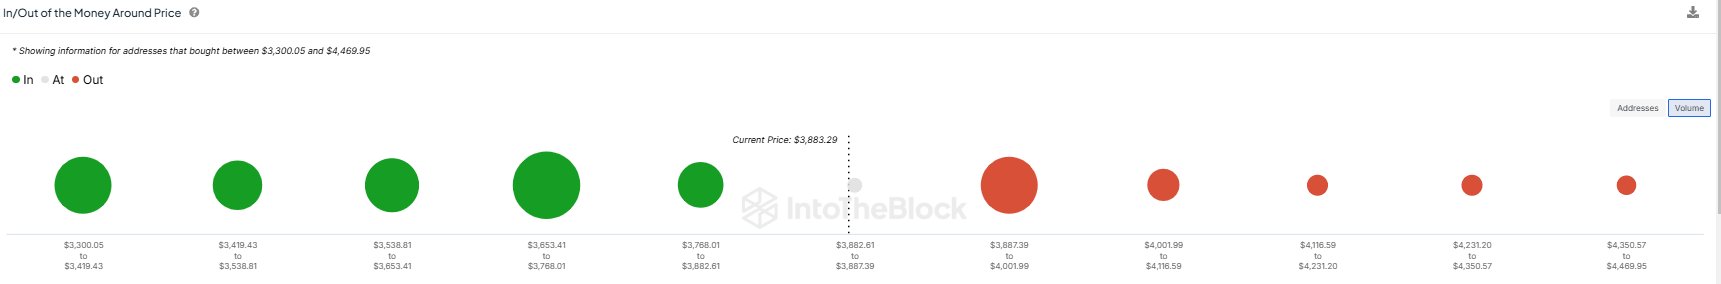
Looks like the levels ahead are relatively thin in terms of investor cost basis | Source: IntoTheBlock on X
From the graph, it’s visible that several ranges below the current ETH spot value have a large dot associated to them, signifying that a large amount of investors bought at those levels, while there is only one such dot for the levels above.
To any holder, their cost basis is naturally a level of interest, as a potential retest of it can lead to a flip in their profit-loss status. Thus, whenever the price touches the level, they can be more prone to showing some kind of reaction.
A few investors displaying any kind of reaction isn’t enough to cause visible fluctuations in the market, but when a large number of addresses have their cost basis inside a tight range, like in those large dots in the chart, a retest may produce a reaction large enough to be relevant.
How exactly the investors might react to a retest of their break-even mark comes down to the direction from which the retest is occurring. Investors who were in loss prior to the retest may decide to sell in fear that Ethereum would dip back again in the near future.
When the retest takes place from above, though, holders may be tempted to believe the price would go up once more, so they could decide to participate in more accumulation.
Because of these buying and selling effects, large cost basis centers below the price are considered to be support zones, while those above can prove to be resistance blocks.
As it stands, Ethereum has many former ranges, but only one of the latter type. “With only minor on-chain resistance levels ahead, ETH seems ready to challenge its previous all-time high,” notes IntoTheBlock.
In some other news, the ETH Funding Rate has witnessed a spike to a multi-month high recently, as an analyst has pointed out in a CryptoQuant Quicktake post.

The trend in the ETH Funding Rate over the past year or so | Source: CryptoQuant
The “Funding Rate” is an indicator that keeps track of the ratio between long and short positions open on the Ethereum derivatives market. The indicator currently has a notable positive value, which suggests the dominance of bullish sentiment.
While some bullish mentality can be positive for rallies, an excess of it can be a warning sign. It now remains to be seen whether ETH will be able to continue its run despite the high funding rate or if it will observe a cooldown first.
ETH Price
At the time of writing, Ethereum is trading at around $3,900, up more than 7% over the past week.
The price of the coin seems to have been stuck in consolidation recently | Source: ETHUSDT on TradingView
Featured image from Dall-E, CryptoQuant.com, IntoTheBlock.com, chart from TradingView.com
Bitcoin, Dogecoin, And Shiba Inu Have The Longest HODL Period: IntoTheBlock CoinGape
Source link ]]>
According to the market intelligence platform IntoTheBlock, Bitcoin (BTC), Dogecoin (DOGE), Shiba Inu (SHIB), and Ethereum (ETH) have emerged as the coins with the longest holding period. This is significant because it indicates that crypto investors have the most faith in these coins.
Bitcoin, Dogecoin, And Shiba Inu Top The List Of HODL Period
IntoTheBlock revealed in an X post that the top cryptocurrencies, Bitcoin, Ethereum, Dogecoin, and Shiba Inu, top the list for the longest holding period for different assets among crypto investors. The chart showed that Bitcoin is number one with an average HODL time of four years and four months by BTC investors.
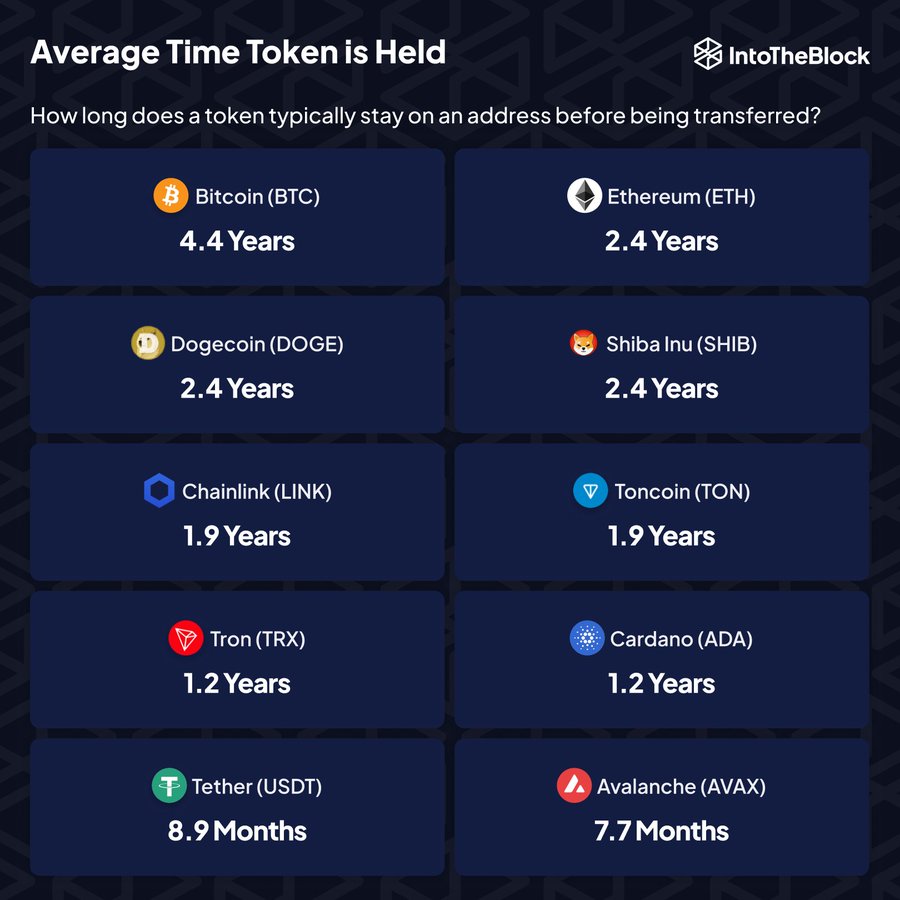
Ethereum comes in second place with an average HODL time of two years and four months. Interestingly, the top meme coins, Dogecoin and Shiba Inu, are on par with Ethereum, as they also have an average HODL time of two years and four months.
Chainlink (LINK), Toncoin (TON), Tron (TRX), Cardano (ADA), Tether (USDT), and Avalanche (AVAX) complete the top ten list. Crypto investors have held Chainlink and Toncoin for an average of one year and nine months, Ton and Cardano for an average of one year and two months, and Tether and Avalanche for an average HODL time of eight and seven months, respectively.
How Their Holders Have Fared
IntoTheBlock data shows that betting on Bitcoin has been profitable for those who have held it this long. All BTC holders are currently either in the money or at the money—specifically, 95.19% of these holders are currently in the money, while 4.81% are at the money.
Investors who have held the flagship crypto for the average hold time of four years and four months most likely fall under those who are in the money since the current Bitcoin price is around the 2021 bull run market top.

For Dogecoin, 78.92% of DOGE addresses (4.999 million) are currently in the money, while 18.38% and 2.70% of these holders are out of and at the money, respectively. DOGE investors who are currently in profit bought the meme coin while the Dogecoin price was at $0.11 or below.

Shiba Inu holders can be termed as the real ‘Diamond Hands’ considering that the meme coin launched in 2021 and already has an average HODL time of 2 years and four months. This indicates that most investors who bought the meme coin around when it launched still hold their coins.
However, these Shiba Inu holders’ convictions haven’t exactly paid off, as only 52.41% of SHIB addresses (588,810) are in profit. Meanwhile, 43.41% and 4.18% of these SHIB addresses are out of and at the money, respectively.

Boluwatife Adeyemi
Boluwatife Adeyemi is a well-experienced crypto news writer and editor who has covered topics that cut across DeFi, NFTs, smart contracts, and blockchain interoperability, among others. Boluwatife has a knack for simplifying the most technical concepts and making it easy for crypto newbies to understand. Away from writing, He is an avid basketball lover and a part-time degen.
Disclaimer: The presented content may include the personal opinion of the author and is subject to market condition. Do your market research before investing in cryptocurrencies. The author or the publication does not hold any responsibility for your personal financial loss.
Majority of Dogecoin, Shiba Inu and Pepe Holders Remain Profitable Despite Latest Crypto Correction: IntoTheBlock The Daily Hodl
Source link ]]>
Majority of Dogecoin, Shiba Inu and Pepe Holders Remain Profitable Despite Latest Crypto Correction: IntoTheBlock … CryptoDaily
Source link ]]>
Two Lower-Cap Memecoins Overtake Dogecoin in Weekly Active Traders: Crypto Analytics Firm IntoTheBlock The Daily Hodl
Source link ]]>
Dogecoin HODLERs Are Beating Shiba Inu With 57% Landing In Profits, IntoTheBlock Data Reveals Benzinga
Source link ]]>
- IntoTheBlock Estimates 90% Cardano, Polygon Holders in Red While InQubeta Presale Promises 1,500 Gains to Its … Analytics Insight
- Cardano & XRP Sailing in Sinking Ship; Here’s What’s Next for ADA & XRP Price Coinpedia Fintech News
- Cardano Price Prediction as ADA Pushes Past Dogecoin in Coin Rankings – Can ADA Reach $10 in 2023? Cryptonews
More Than 80% of the Holders of Shiba Inu and These Three Dogecoin Competitors Are Now Underwater: IntoTheBlock The Daily Hodl
Source link ]]>
✓ Share: