A crypto analyst has announced that Bitcoin (BTC) has hit its last bull trap, signaling that the price of the flagship cryptocurrency could fall much further before a potential reversal begins. The analyst has shared a chart highlighting key accumulation areas at levels below $60,000, the lowest price BTC has reached since its all-time high in 2025.
Bitcoin Reaches Final Bull Trap
Following Bitcoin’s rebound over the weekend, a pseudonymous whale and crypto analyst known as NoName shared an update on Bitcoin’s latest price action and what its next moves may be. In a post on X, NoName announced that Bitcoin has recently hit its second and final bull trap since reaching a price peak in 2025.
Related Reading
He shared a video chart showing how the Bitcoin price has moved throughout its ongoing bear market. After a prolonged rally that eventually pushed Bitcoin to an all-time high above $126,700, the market shifted direction and entered a sustained downtrend, marked by multiple corrective waves.
Later during Q1 2026, Bitcoin experienced its first major bull trap. At the time, the price spiked sharply upward, drawing in late buyers and briefly reviving bullish sentiment before quickly reversing and resuming its decline. The move ultimately caught overleveraged traders off guard, leading to significant losses for those who entered near the top.

After this initial trap, the price continued to slide and establish lower price levels before forming its latest bull trap this month. Here, BTC surged above $72,000 shortly after the US-Iran ceasefire announcement. The rally held for several days, sustaining optimism slightly, before momentum faded and the price retraced back toward the $70,000 level at the time of writing.
With this last bull trap in place, NoName has stated that Bitcoin’s path has become clearer. The analyst is now anticipating a final downside flush, suggesting that more volatility and pain could lie ahead for BTC. He projects a potential price crash to $50,000, representing a more than 28% drop from its current price and a drawdown of about 60% from BTC’s peak.
Notably, NoName has marked the $50,000 level as a potential accumulation area, and investors and traders could begin entering the market again to prop up their positions.
What’s Next For The BTC Price?
Based on NoName’s analysis, the $50,000 level is likely Bitcoin’s final price bottom before a bullish reversal. Once the cryptocurrency hits this accumulation point, the analyst anticipates an upward move to the next re-accumulation area between $75,000 and $85,000.
Related Reading
After consolidating around this range for a bit, NoName projects that Bitcoin could rise sharply to his “mark-up” target between $95,000 and $110,000, before skyrocketing to a new all-time high above $130,000.
Featured image from Pixabay, chart from Tradingview.com
What Lies Ahead For Shiba Inu: Recovery or Collapse? Watcher Guru
Source link ]]>
Popular crypto analyst PlanD has drawn attention to a key development on the Bitcoin price chart, and identifies a pivotal development around $90,650 price level. Notably, the premier cryptocurrency has struggled to break past the $90,000 price region since crashing below the price zone in mid-December.
Bitcoin Set For Potential Rally To $97,000 On Resistance Break — Analyst
In an X post on Friday, PlanD explains that an ascending chart pattern is forming on the BTCUSD 4-hour chart following the price action of last week. For context, the rising or ascending triangle formation is a bullish chart pattern that forms when the price makes higher lows while repeatedly facing resistance at a relatively flat horizontal level.
In technical analysis, the ascending triangle formation primarily signals growing buying pressure and a potential upside breakout. According to PlanD, the flatline resistance aligns with $90,650 after two price rejections, making this level a critical breakout point in the present price structure. Upon the likely event that the market bulls conquer this price level, the analyst postulates that Bitcoin would experience a forceful price surge into the upper band of the $93,500 to $97,000 price region.

This reactive price rise can be attributed to the potential short-squeeze that will be created when the short positions around the resistance region are forcefully closed by the price breakout. However, PlanD warns traders and investors should only interpret this price gain as a “short-term stop hunt/relief rally” rather than a structural trend reversal following Bitcoin bearish fortunes in Q4 2025.
The seasoned analyst advocates for a cautious market stance, stating that investors should prepare for a position reassessment at $97,000 unless the price decisively moves above this target.
Bitcoin Market Overview
At the time of writing, Bitcoin trades at $87,661 following a minor decline of 0.18% in the past day. Meanwhile, daily trading volume is up by 133.35%, suggesting increased trader activity and positioning ahead of a potential major price move.
Interestingly, analysts of both sentiment camps have reiterated their positions in recent days. Prominent market expert Ali Martinez is convinced that the bear market began after Bitcoin reached its all-time high of $ 126,100 in early October. According to Martinez, the market is currently in a phase of complacency, where investors continue to anticipate another price surge instead of actively de-risking or reducing their positions.
From the bullish camp, analyst Ash Crypto states the bull market run remains active, considering the price surge and new all-time highs in commodities markets such as gold and silver. The pundit expects an eventual rotation of capital from these markets into Bitcoin, with price targets set at $150,000 in the new year.
]]>Cardano Founder Charles Hoskinson Says Something Magical Lies Ahead, So No Time Off This Holiday Bitget
Source link ]]>
Bitcoin is trading in the $117,000 price region following a rather eventful week, which allowed investors to experience both sides of the market volatility. Notably, the premier cryptocurrency established a new all-time high at $124,457 before experiencing a sharp crash to below $118,000 driven by recent US PPI data. As enthusiasts await the asset’s next move, prominent analytics firm Glaasnode has unveiled the potential price targets based on short-term holders’ (STH) market activity.
Short-Term Holder Cost Basis Tips Bitcoin To Race Towards $144K
In an X post on August 16, Glassnode shares data from its Bitcoin STH cost basis model, which suggests the cryptocurrency is headed for an overheating region. For context, short-term holders refer to entities that acquired their BTC within the last 155 days. Their cost basis, i.e., average price of acquisition, often serves as a proxy for the sentiment and profitability of newer market entrants, thus dictating short-term price dynamics.
Glassnode’s on-chain data shows that Bitcoin’s STH cost basis has now climbed to $107,000, with standard deviation bands indicating the next crucial resistance at $127,000. Notably, this price level aligns with the +1σ band, often viewed as a “heated” market threshold. This zone is expected to act as a major pivot point, either marking the onset of consolidation or serving as the launchpad for a euphoric final leg upward.

However, if Bitcoin can decisively break above $127,000, the STH deviation bands suggest it may trigger accelerated market buying momentum, potentially pushing the price toward the +2σ band at $144,000 zone. Notably, the +2σ band is termed as the overheating region as it often coincides with local or cycle top and frequently introduces significant sell pressure from investors.
Meanwhile, the base STH cost basis at $107,000 now serves as a crucial short-term support; therefore, a breakdown below this could imply weakening confidence among recent buyers. In such a bearish scenario, market attention would turn to the lower deviation -1σ band at $93,000, at which investors may expect some price stability.
Bitcoin Price Overview
At the time of writing, Bitcoin was trading at $117,396, reflecting a price decline of 1.02% in the past 24 hours. Meanwhile, daily trading volume has also crashed by 33.56% and is now valued at $70.56 billion.
Notably, popular analyst Ali Martinez tips the premier cryptocurrency to soon make a recovery after the flash crash of last week. The market expert explains that Bitcoin always produces a price rally following any PPI-induced decline.
]]>XRP has entered a period of quiet movement following its rally last week that pushed its price to new all-time highs. Particularly, XRP’s price has hovered between $3.40 and $3.60 over the past few days. This structure has caught the attention of crypto analyst CasiTrades, who shared her detailed outlook on the social media platform X. Her accompanying chart breaks down the ongoing setup and shows the significance of the $3.40 support alongside the bullish implications of XRP’s behavior just beneath the resistance zone.
Former Resistance Now Support
CasiTrades points to a classic bullish flip taking place in XRP’s chart pattern on the 1-hour candlestick timeframe. A key trendline, which had previously served as overhead resistance, has now been flipped and is acting as support. This shift has played out with precision, as price has tested the trendline three times and each bounce affirms that buyers are stepping in with confidence. According to her analysis, this kind of structural transition might be subtle, but momentum is quietly building up for XRP’s next price move.
Related Reading
The trendline, which has now flipped to support, sits just above the $3.40 level, and its resilience has helped XRP avoid any serious breakdowns since last week. As long as this line continues to hold, bulls will remain in control. To sum it up, the analysis shows that XRP is now in an accumulation phase rather than exhaustion, which is notable considering its significant rise earlier in the first half of July.
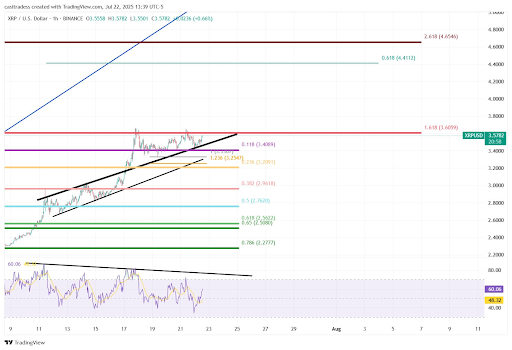
Furthermore, a look at the Relative Strength Index (RSI) on the 1-hour candlestick timeframe chart shows that there’s still room for momentum to push higher than $3.65 before the end of the month.
However, the analyst also acknowledges that nothing is guaranteed. If the $3.40 support gives out, the XRP price could retrace to $3.20, where the 0.236 Fibonacci retracement level lines up. Other Fibonacci price levels to watch for a rebound are at $2.96, $2.76, $2.56, $2.50, and $2.27.
Next Target Lies At $4.65
The trendline’s consistency, combined with the RSI levels, makes a stronger case for a breakout than a breakdown. The road ahead could open up well if XRP can bounce well at $3.40 and finally punch through the $3.60 to $3.66 resistance range. CasiTrades identified $4.65 as the next major level to watch, a target derived from the 2.618 Fibonacci extension of the previous rally. In the meantime, a middle price level to watch is at $4.11 on the path to $4.65. “The volatility above here gets wild and fast,” the analyst said.
Related Reading
Once the XRP price clears $3.65, the path to $4.65 becomes much more probable, especially if the wider market sentiment shifts in favor of bullish price action.
Featured image from Getty Images, chart from Tradingview.com

Ethereum price action on the 1-day chart continues to unfold in line with prior expectations, showing steady progress within its established bullish setup. The price remains well-structured with ETH holding above key support and respecting trend dynamics.
Ethereum’s Next Key Targets — Where Price Could Be Headed
Ethereum is facing resistance from a tight cluster of EMAs, which is acting as a ceiling and compressing price action. Crypto Devil highlighted on X that ETH needs to show strength and break above these EMAs to shift short-term momentum back to bull.
The price action has already hit the RSI target and rejected from the initial chart target, indicating a possible exhaustion of momentum, but not a breakdown. ETH is showing signs of a potential spring test, a setup that often signals the final shakeout before a bullish breakout.
The key confirmation signals to watch are: A break above the tight EMAs signals a bullish control trend, reclaiming the $2.600 level, which is a significant resistance and chart target. This would push the RSI above 53, indicating renewed strength and momentum.

Barry | ChartMonkey also noted that the Ethereum weekly chart shows price steadily rising as expected, maintaining a clean bullish structure, and now approaching a critical resistance zone between $2,600 and $2,900. This resistance zone marks a pivotal moment for ETH.
However, a break above $2,900 could ignite a new wave of bullish momentum, potentially setting the stage for a broader breakout toward higher targets. Thus, ETH could be on the verge of a significant upside move.
On the 4-hour chart, Ethereum is gaining momentum, up 7.58% on the day and trading around $2,593. According to Wayne Liang, this surge is due to a combination of strong accumulation patterns, steady ETF inflows, and rising staking activity.
Despite the impressive move, Wayne stated that the short-term outlook remains slightly bearish, with overhead resistance and cooling indicators, the broader trend remains bullish on the long-term trajectory. He refers to the current technical setup as a beautiful blue diamond, a symbolic description for the coiling structure before momentum could explode to the upside.
Ethereum In Bullish Continuation Zone
Whales_Crypto_Trading analyzed that Ethereum is holding above the lower boundary of an ascending triangle formation on the 2-hour chart, a bullish continuation pattern that precedes upward movement. If the pattern plays out, ETH could surge toward the $3,200 target, a move that aligns with technical projections and bullish market sentiment.
The analyst also revealed that Ethereum is testing a key resistance level that has now turned into support. This level is where ETH might determine whether it maintains an upward trend or faces a pullback.
If this support holds, ETH price could climb toward the $4,000 level in the next few months. This level represents a milestone that aligns with technical targets and growing market enthusiasm.
Featured image from Istock images, chart from tradingview.com
Editorial Process for bitcoinist is centered on delivering thoroughly researched, accurate, and unbiased content. We uphold strict sourcing standards, and each page undergoes diligent review by our team of top technology experts and seasoned editors. This process ensures the integrity, relevance, and value of our content for our readers.
Opeyemi is a proficient writer and enthusiast in the exciting and unique cryptocurrency realm. While the digital asset industry was not his first choice, he has remained absolutely drawn since making a foray into the space over two years. Now, Opeyemi takes pride in creating unique pieces unraveling the complexities of blockchain technology and sharing insights on the latest trends in the world of cryptocurrencies.
Opeyemi savors his attraction to the crypto market, which explains why he spends the better parts of his day looking through different price charts. “Looking” is a rather simple way to describe analyzing and interpreting various price patterns and chart formations. However, it appears that is not Opeyemi’s favorite part – in fact, far from it.
Being able to connect what happens on a price chart to on-chain movements and blockchain activities is what keeps Opeyemi ticking. “This emphasizes the intricacies of blockchain technology and the cryptocurrency market,” he would say. Most importantly, Opeyemi thinks of any market insights as the gospel, while recognizing that he is only a messenger.
When he is not clicking away at his keyboard, Opeyemi is most definitely listening to music, playing games, reading a book, or scrolling through X. He likes to think he is not loyal to a particular genre of music, which can be true on many days. However, the fast-rising Afrobeats genre is a staple in Opeyemi’s Spotify Daily Mix.
Meanwhile, Opeyemi is a voracious reader who enjoys a wide category of books – ranging from science fiction, fantasy, and historical, to even romance. He believes that authors like George R. R. Martin and J. K.
Rowling are the greatest of all time when it comes to putting pen to paper. Opeyemi believes his reading of the Harry Potter series twice is proof of that.
Indeed, Opeyemi enjoys spending most of his time within the four walls of his home. However, he also sometimes finds solace in the company of his friends at a bar, a restaurant, or even on a stroll. In essence, Opeyemi’s ambivert (haha! been searching for an opportunity to use the word to describe myself) nature makes him a social chameleon who is able to quickly adapt to different settings.
Opeyemi recognizes the need to constantly develop oneself in order to stay afloat in a competitive and ever-evolving market like crypto. For this reason, he is always in learning mode, ready to pick up the slightest lesson from every situation. Opeyemi is efficient and likes to deliver all that is required of him in time – he believes that “whatever is worth doing at all is worth doing well.” Hence, you will always find him striving to be better.
Ultimately, Opeyemi is a good writer and an even better person who is trying to shed light on an exciting world phenomenon – cryptocurrency. He goes to bed every day with a smile of satisfaction on his face, knowing that he has done his bit of the holy assignment – spreading the crypto gospel to the rest of the world.
Reason to trust
![]()
Strict editorial policy that focuses on accuracy, relevance, and impartiality
Created by industry experts and meticulously reviewed
The highest standards in reporting and publishing
Strict editorial policy that focuses on accuracy, relevance, and impartiality
Morbi pretium leo et nisl aliquam mollis. Quisque arcu lorem, ultricies quis pellentesque nec, ullamcorper eu odio.
On-chain data shows Ethereum has broken under all major investor cost basis levels, except for one. Here’s where this price level is currently situated.
Ethereum Has Only Realized Price Of Mega Whales To Rely On Now
In a CryptoQuant Quicktake post, analyst MAC_D has discussed about where the next major support level could lie for Ethereum. The line in question is a version of the Realized Price.
The “Realized Price” is an on-chain indicator that, in short, keeps track of the average cost basis of investors belonging to a given ETH cohort. When this metric is under the spot price, it means the average member of the group is holding coins at a net loss. On the other hand, it being above the asset’s value suggests the cohort as a whole is in a state of net profit.
Related Reading
Investor cost basis is considered an important topic in on-chain analysis, as holders can be more likely to show some kind of move when their profit-loss status is challenged.
Whether investors react by buying or selling can come down to which direction the retest of their acquisition level is occurring from. When it’s from above, holders may decide to accumulate more if the atmosphere is bullish, as they can consider the pullback to be just a ‘dip.’ This provides support to the asset, thus defending their cost basis.
Similarly, investors who were underwater just prior to the retest might believe the surge wouldn’t last and they would fall back into losses again. So, they could make the decision to exit, to at least escape with their entire investment back.
A cost basis level that has shown particular importance for not just Ethereum, but digital assets in general is the Realized Price of the entire network. As the chart shared by the quant shows, this level is currently situated around $2,250 for ETH.

From the graph, it’s apparent that the line provided support to Ethereum last year, but it has failed recently as the coin’s price has significantly fallen under it. This means that the average holder on the blockchain is now sitting on a notable loss.
With this major level gone, the Realized Price of the individual cohorts could help point to where the next support could be. Here is a chart displaying the trend in the indicator for investors holding between 100 to 1,000 ETH, 1,000 to 10,000 ETH, 10,000 to 100,000 ETH, and more than 100,000 ETH:

As is visible in the graph, Ethereum has put three of the cohorts underwater with the latest crash. Now, only the largest of holders in the sector, those with over 100,000 ETH in their balance, are still in the green.
Related Reading
Back in the 2022 bear market, ETH found support at the Realized Price of these humongous whales. Thus, it’s possible that this line could once again be of relevance to ETH.
At present, the cohort has its average acquisition level at $1,290, so it will take more bearish action before a retest can take place.
ETH Price
At the time of writing, Ethereum is trading around $1,500, down more than 16% in the last 24 hours.
Featured image from Dall-E, CryptoQuant.com, chart from TradingView.com
ADA Price At Key Support: What Lies Ahead For Cardano? The Coin Republic
Source link ]]>