Bitcoin held steady near $71,000 on Wednesday as traders await clear signals from the latest developments in US-Iran peace talks. Iran has launched new strikes on Israel and the US bases in the Middle East after President Donald Trump approved new military deployments. Gold and oil prices are fluctuating today amid a mix of positive
The post Bitcoin Steady as US-Iran Peace Talks in Limbo amid New Strikes, Military Deployment appeared first on CoinGape.
]]>
Ethereum is trading below the $3,000 mark as it attempts to push higher and reclaim key structural levels needed to signal the start of a recovery. So far, those efforts have failed. Price remains capped by persistent resistance, and market confidence continues to deteriorate.
While short-term bounces have emerged, most analysts and investors expect the broader downtrend to continue, arguing that Ethereum lacks the demand and momentum required to sustain a meaningful reversal. Sentiment has turned deeply pessimistic, with traders increasingly positioned for further downside rather than recovery.
On-chain and technical data reinforce this cautious outlook. A recent CryptoQuant report shows that after Ethereum’s steep decline from its $4,800 peak, the price has become trapped in a narrow range centered around the $2,800 level for nearly a month. This zone has effectively turned into a state of market purgatory. Bulls have been unable to generate the conviction needed to reclaim higher highs, while bears have repeatedly failed to force a decisive breakdown below support.
The result is a prolonged phase of volatility compression. Price action has tightened, signaling widespread indecision among market participants and a lack of directional commitment. Historically, such compression often precedes a sharp move, but the direction remains uncertain.
Muted Layer-2 Flows Reflect Ethereum’s Stalemate
A recent report from CryptoOnchain highlights that Ethereum’s price stagnation is being closely mirrored by on-chain behavior. Weekly ETH netflows on Arbitrum, one of Ethereum’s most important Layer-2 networks and a common proxy for smart-money positioning and DeFi activity, remain subdued and highly choppy.
Rather than showing a clear inflow or outflow trend, the data reflects a market operating without strong conviction, reinforcing the idea that larger participants are choosing to remain on the sidelines.
This lack of directional flow suggests that capital is not aggressively entering or exiting the ecosystem. Instead, investors appear to be waiting for clearer macroeconomic signals or a definitive shift in market structure before committing.
In previous cycles, sustained expansions in Arbitrum netflows have often coincided with periods of renewed risk appetite or decisive trend changes. The current inactivity stands in sharp contrast to those environments.
The alignment between compressed price action around key support levels and dormant on-chain activity points to a buildup of latent energy within the market. Ethereum is effectively coiling. While this equilibrium can persist for extended periods, it rarely resolves quietly. When the balance breaks, moves tend to be swift and forceful.
Arbitrum netflow is now a critical metric to watch. A sudden and sustained expansion in flows could act as an early signal that this prolonged phase of indecision is nearing its resolution, potentially setting the direction for Ethereum’s next major move.

Ethereum Stabilizes Near $3,000 as Downtrend Pressure Persists
Ethereum is trading near the $2,970 level on the daily chart, attempting to stabilize after an extended decline from the $4,800 highs recorded earlier this cycle. While recent candles show modest recovery attempts, the broader structure remains fragile. ETH continues to print lower highs and lower lows, signaling that bearish momentum has not yet been invalidated despite short-term relief bounces.
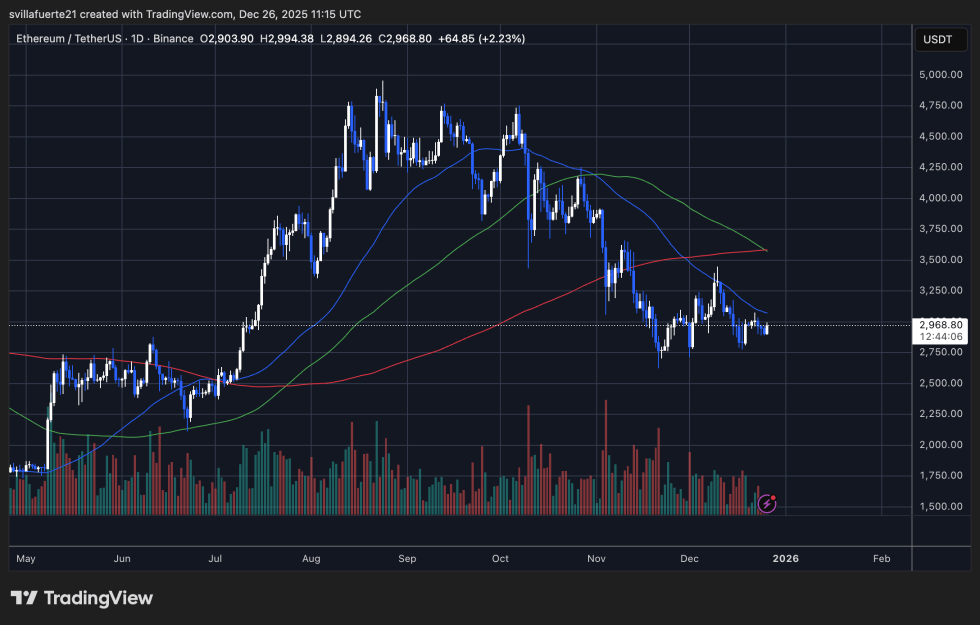
Technically, price remains below its key daily moving averages. The faster moving average has rolled over sharply and is acting as immediate resistance, while the 111-day and 200-day simple moving averages converge in the $3,300–$3,600 range. This cluster forms a heavy overhead supply zone, limiting the probability of a sustained upside move unless volume and momentum expand meaningfully.
The recent bounce from the $2,800–$2,900 area has helped Ethereum avoid a deeper breakdown for now. However, this move has occurred on relatively muted volume, suggesting a lack of conviction from buyers. In contrast, the initial leg lower was accompanied by strong selling pressure, reinforcing the idea that the dominant trend remains to the downside.
From a structural standpoint, the $2,800 level remains critical support. A decisive break below this zone would likely accelerate losses and confirm bearish continuation. Conversely, for Ethereum to shift momentum, price must reclaim $3,200–$3,300 and hold above its declining daily averages.
Featured image from ChatGPT, chart from TradingView.com
Editorial Process for bitcoinist is centered on delivering thoroughly researched, accurate, and unbiased content. We uphold strict sourcing standards, and each page undergoes diligent review by our team of top technology experts and seasoned editors. This process ensures the integrity, relevance, and value of our content for our readers.
Cardano and XRP ETFs in limbo as SEC deadline meets US government shutdown Yahoo Finance
Source link ]]>
Cardano and XRP ETFs in limbo as SEC deadline meets US government shutdown dlnews.com
Source link ]]>
SEC To Keep XRP, Solana and Dogecoin ETFs in Limbo Until Paul Atkins is Confirmed Chair CCN.com
Source link ]]>
Cardano Price in Limbo as Mysterious Address Transfers Millions in ADA CoinGape
Source link ]]>
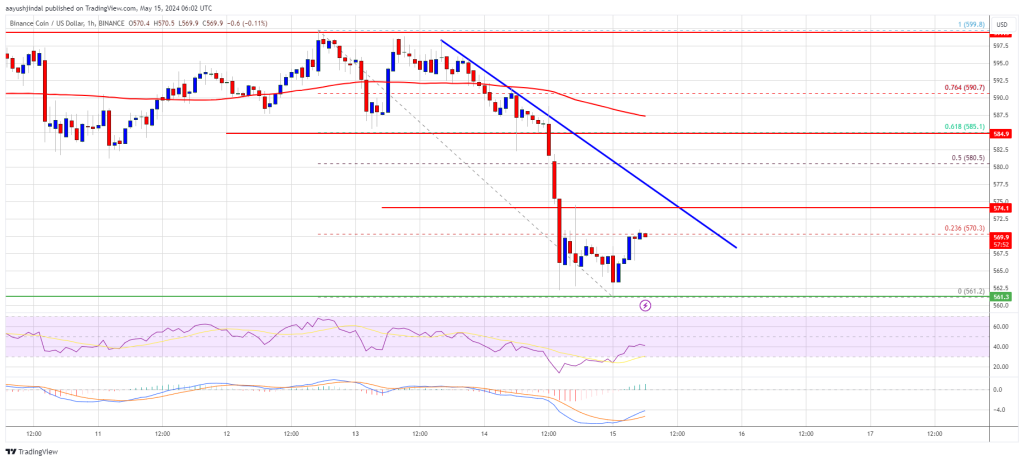
BNB price is showing bearish signs below the $600 level. The price must settle above the $575 and $585 resistance levels to gain bullish momentum.
- BNB price started a fresh decline after it failed to clear the $600 resistance zone.
- The price is now trading below $585 and the 100 simple moving average (4 hours).
- There is a key bearish trend line forming with resistance near $575 on the hourly chart of the BNB/USD pair (data source from Binance).
- The pair could gain bullish momentum if it clears the $585 resistance zone.
BNB Price Dips Again
After a decent increase, BNB price struggled near the $600 resistance. As a result, there was a bearish reaction below the $585 support, like Ethereum and Bitcoin.
The price dipped below the $575 support and the 100 simple moving average (4 hours). It traded as low as $561 and is currently consolidating losses. There was a minor upward move above the $565 level. The price tested the 23.6% Fib retracement level of the downward move from the $600 swing high to the $561 low.
It is now trading below $585 and the 100 simple moving average (4 hours). Immediate resistance is near the $575 level. There is also a key bearish trend line forming with resistance near $575 on the hourly chart of the BNB/USD pair.
The next resistance sits near the $585 level or the 61.8% Fib retracement level of the downward move from the $600 swing high to the $561 low. A clear move above the $585 zone could send the price higher.
In the stated case, BNB price could test $600. A close above the $600 resistance might set the pace for a larger increase toward the $650 resistance. Any more gains might call for a test of the $680 level in the coming days.
More Losses?
If BNB fails to clear the $575 resistance, it could continue to move down. Initial support on the downside is near the $560 level.
The next major support is near the $550 level. The main support sits at $532. If there is a downside break below the $532 support, the price could drop toward the $510 support. Any more losses could initiate a larger decline toward the $500 level.
Technical Indicators
Hourly MACD – The MACD for BNB/USD is losing pace in the bearish zone.
Hourly RSI (Relative Strength Index) – The RSI for BNB/USD is currently below the 50 level.
Major Support Levels – $565, $550, and $532.
Major Resistance Levels – $575, $585, and $600.
]]>Dogecoin Stuck In Limbo: Will Valentine’s Day Bring Love (And Price Gains)? NewsBTC
Source link ]]>
Solana (SOL) and Dogecoin (DOGE) Prices in Green as Crypto Market Remains in Limbo U.Today
Source link ]]>