After hitting its 2023 high of $35,000 earlier this week, the Bitcoin price has been consolidating at $34,500 for a while as the bulls continue to hold the bandwagon.
Will the Bitcoin Price Rally Continue?
The surge in Bitcoin’s value is due to the expectations that the first US exchange-traded funds (ETFs) directly investing in the cryptocurrency will soon receive approval. The key question at this point is whether the ETFs’ actual approval will trigger some investors to take profits.
Thus, BTC continues to face the litmus test of whether the rally shall continue once the spot Bitcoin ETF arrives in the US market. Hayden Hughes, co-founder of social-trading platform Alpha Impact told Bloomberg:
“Markets have priced in a Bitcoin spot ETF approval and I expect a sell-the-news event if it’s approved”.
The biggest digital currency surged by 16% this week and even briefly exceeded $35,000, a level it hasn’t reached since 2022. In contrast, worldwide stock markets are struggling as long-term Treasury yields rise and geopolitical uncertainties deepen.
Amid the current macro conditions, Bitcoin and crypto have deviated from other risk-ON assets such as US equities. But it will be interesting to see how far Bitcoin’s outperformance of US equities continues.
BTC Technical Test and Derivatives Data
Fibonacci ratios highlight a potential challenge for the Bitcoin rebound just below the $36,000 level. This zone is marked by the 38.2% Fibonacci retracement of Bitcoin’s year-long decline until November 2022.

The weekly relative-strength index (RSI) for Bitcoin, a momentum indicator, recently crossed the 70 level for the first time since 2021. An RSI reading above 70 is typically considered “overbought,” which may suggest lower chances of experiencing rapid rallies similar to the recent 10% intraday surges.
Data from Deribit, the largest cryptocurrency options exchange, indicates a significant accumulation of bullish wagers on BTC reaching $40,000 by the year’s end. This would represent a 16% increase from the current price levels.
On the other hand, Bitcoin seems to stealing attention away from Gold in the recent rally. Bloomberg’s Senior Macro Strategist, Mike McGlone, believes that the dynamics between Bitcoin and gold are evolving. The previous resistance level, with a crypto-to-gold multiple of around 10x until 2020, may be shifting toward a more lasting transformation. The forthcoming approval of US spot Bitcoin ETFs is likely to further solidify Bitcoin’s position as it increasingly becomes a part of the mainstream, potentially eroding gold’s relative standing.
The presented content may include the personal opinion of the author and is subject to market condition. Do your market research before investing in cryptocurrencies. The author or the publication does not hold any responsibility for your personal financial loss.
- BNB price ranges below 50 and 200 EMA on the daily timeframe.
- BNB shows bullish strength on the 4H timeframe as price breaks an asymmetric triangle.
- The price could be poised to retest the 1D and 4H resistance of $280.
Binance Coin (BNB) price showed bullish strength in recent weeks, but the price has failed to match that run against tether (USDT). With the price of Binance Coin facing resistance to breaking above $337, acting as a tough resistance area, the price of BNB has maintained a downtrend as the price broke its bullish structure. (Data from Binance)
Binance Coin (BNB) Price Analysis On The Weekly Chart

The price of BNB has recently declined after bouncing from its weekly low of $210 as a price rally to a high of $340 before facing a stip rejection, and the price has struggled to re-establish its bullish trend.
The price of BNB is still above a critical support level of $270, which acts as a good demand zone for buy orders. The price of BNB must break through its weekly resistance of $280 in order to trend higher.
To restore a relief bounce, the price of BNB must break and hold above the $280 resistance, which is preventing the price of BNB from trending higher. If the price of BNB continues to reject $280, we may see a retest of $270 and possibly a lower support area of $210 on the weekly chart.
If the price of BNB breaks and holds above $340, this could start a major rally as this has proven to be a tough area to break out for BNB price.
Weekly resistance for the price of BNB – $340.
Weekly support for the price of BNB – $270.
Price Analysis Of BNB On The Four-hourly (4H) Chart

The price of BNB continues to show strength in the 4H timeframe, breaking out of its downtrend range after forming an asymmetric triangle with good volume.
The price of BNB is $278, which is higher than the 50 EMA but lower than the 200 EMA. The 50 EMA acts as a support for the BNB price, while the 200 EMA acts as resistance. Prices at the 50 and 200 EMA for BNB are $274 and $280, respectively.
Four-Hourly resistance for the BNB price – $280.
Four-Hourly support for the BNB price – $274-$250.
Onchain Analysis Of BNB

The price of BNB from the on-chain analysis looks more decent, producing a reasonable return on investment (ROI) compared to other crypto assets that have struggled for the past three months. With backing from investors and partnerships, the price of BNB could do well.
Featured Image From zipmex, Charts From Tradingview and Messari
-
BNB has been boosted by recovering crypto market
-
The token is currently trading at a resistance of $326
-
Watch for a breakout to buy higher; otherwise, sell to snap it lower
Binance coin BNB/USD has been one of the strongest cryptocurrencies recently. At the current trading of $321, BNB has risen by more than 30% in a month. Estimates by CoinMarketCap show that BNB will end August at $360.91. The cryptocurrency is now facing speed bumps, which coincides with resistance at $326.
BNB powers the world’s largest cryptocurrencies, which explains the recent gains. Investors once again getting back to cryptocurrencies could be boosting the trading volumes. Leading cryptocurrencies, including Bitcoin and Ethereum, escaped their prior bottoms.
BNB hits resistance after the latest pump
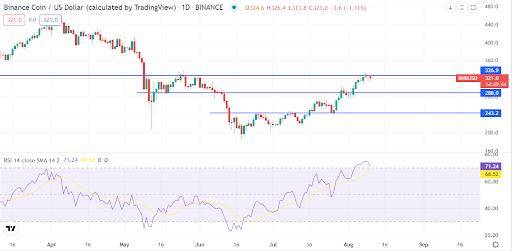
Source – TradingView
Technically, BNB is bullish. The cryptocurrency has been moving in a system of higher highs and higher lows since mid-June. The cryptocurrency has also been on an upward momentum.
BNB has hit resistance at $326, and the bullish momentum has slowed. The cryptocurrency’s bullish momentum still remains in place. An RSI reading of 71 suggests that investors have been piling up on BNB, and it is already overbought.
Concluding thoughts
Although the bullish momentum for BNB has slowed, it remains in place and could break out soon. That is evident from the strong bullish push at the key resistance where the token is currently trading.
Alternatively, profit-taking at the resistance could force a bear weakness on the BNB. If that becomes a reality, BNB could correct to $288, the next support.
Investors should consider selling now to buy lower or buy after a breakout. The next potential resistance level for BNB is $380. For now, we recommend watching the price action for the next trigger for buy trades.
✓ Share: