Over the last month, Bitcoin ranged within the $100,000 — $110,000 price region until its recent breakout to reach a new all-time high. On-chain data show that a shift in BTC holder behavior may have played a significant role in the flagship cryptocurrency’s recent price action.
LTHs Begin Distributing, But STHs Accumulate
In a July 12 post on the X platform, on-chain analyst Boris explained how a shift in Bitcoin holder activity has affected the market over the past months. This explanation was based on indicators measuring the Accumulation Vs Distribution of Long-Term Holders (LTH) and Short-Term Holders (STH).
For these two holder categories, the metric tracks and analyzes wallet behavior to determine whether they are increasing or decreasing their Bitcoin holdings over time.
Related Reading: Bitcoin Breaks Records: What Miners and Leverage Traders Are Doing Behind the Scenes
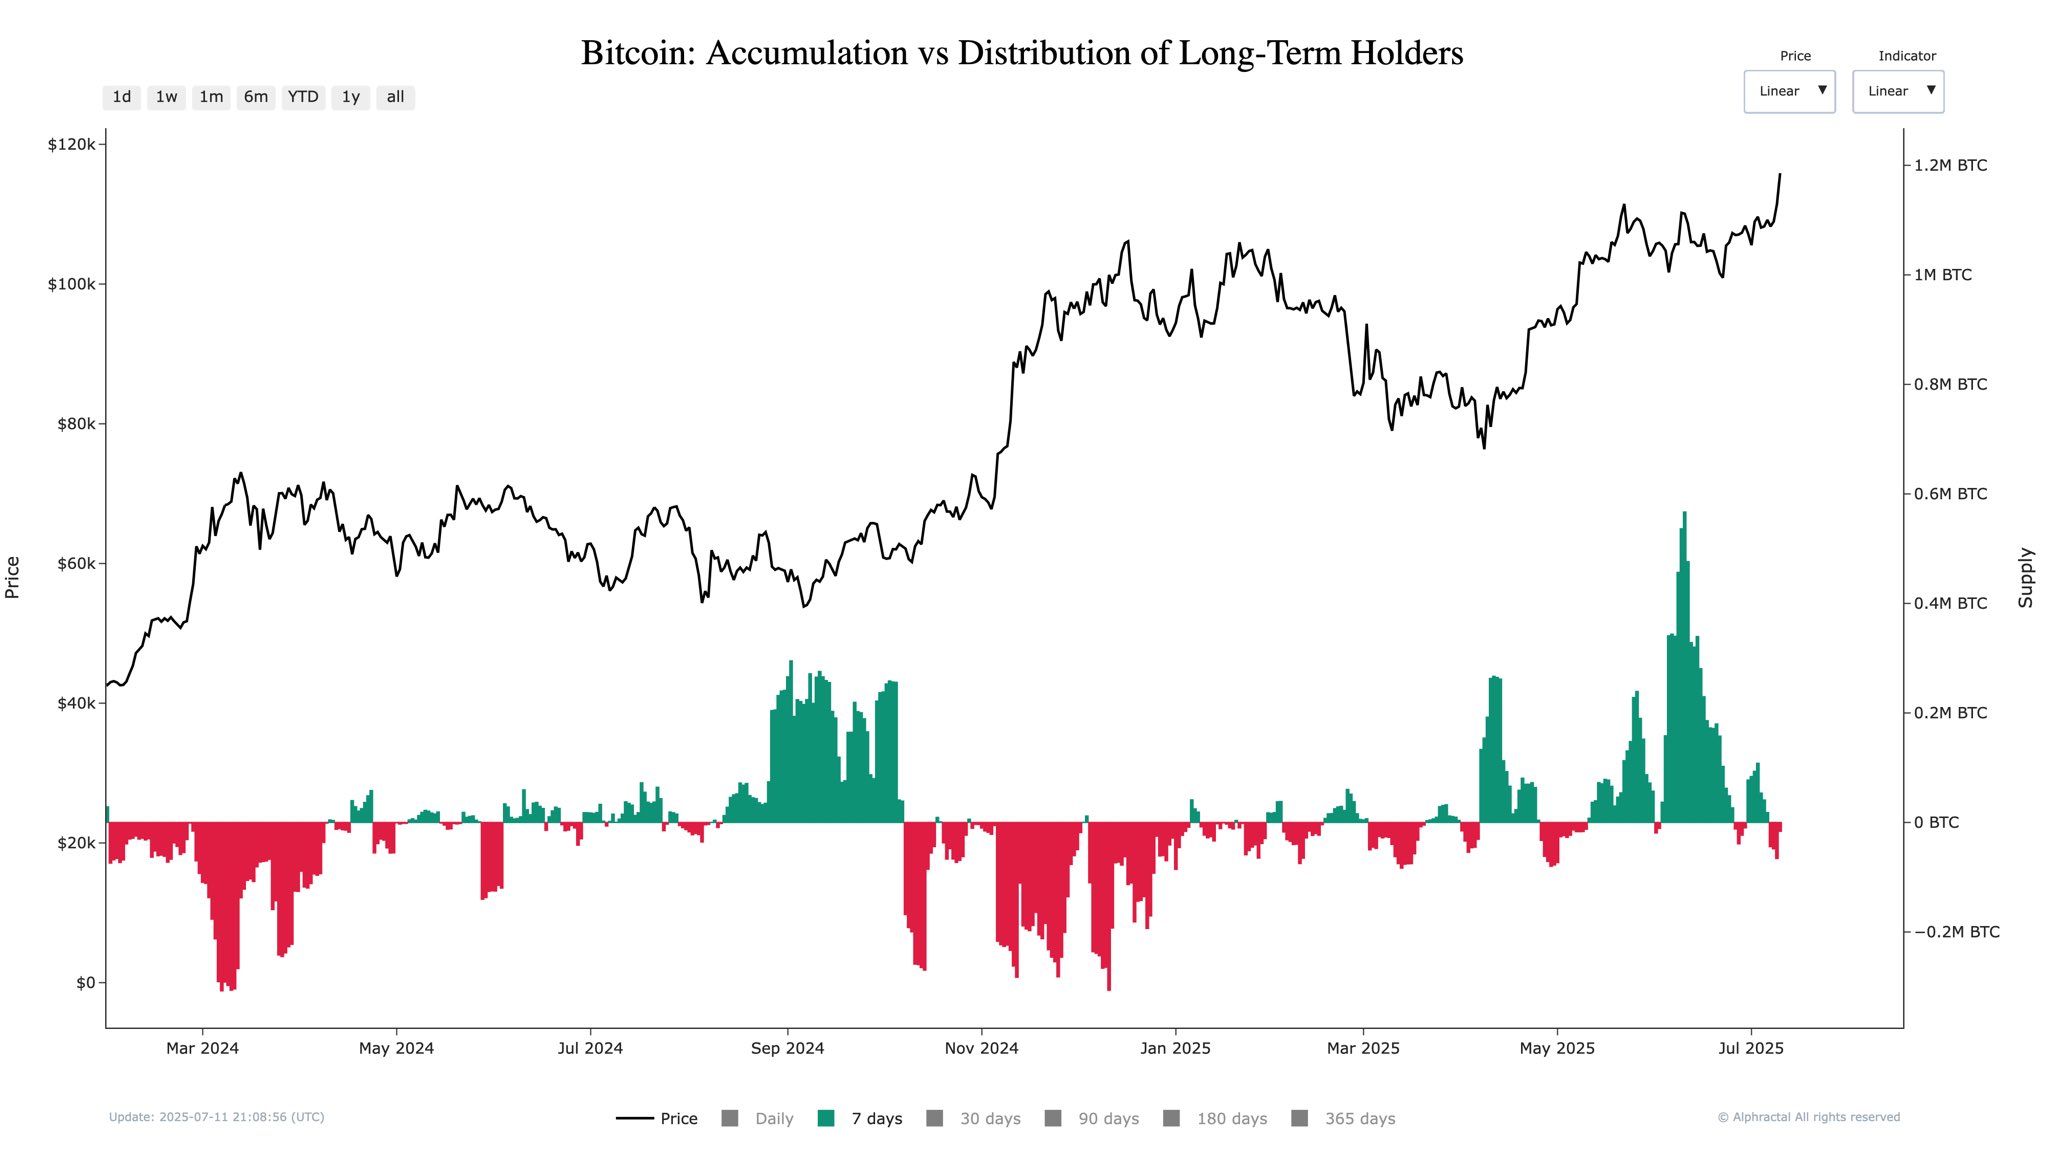
For the long-term holders, the chart above shows how accumulation grew from the later days of May to the end of June. This is represented by the growing green graphs over the red.
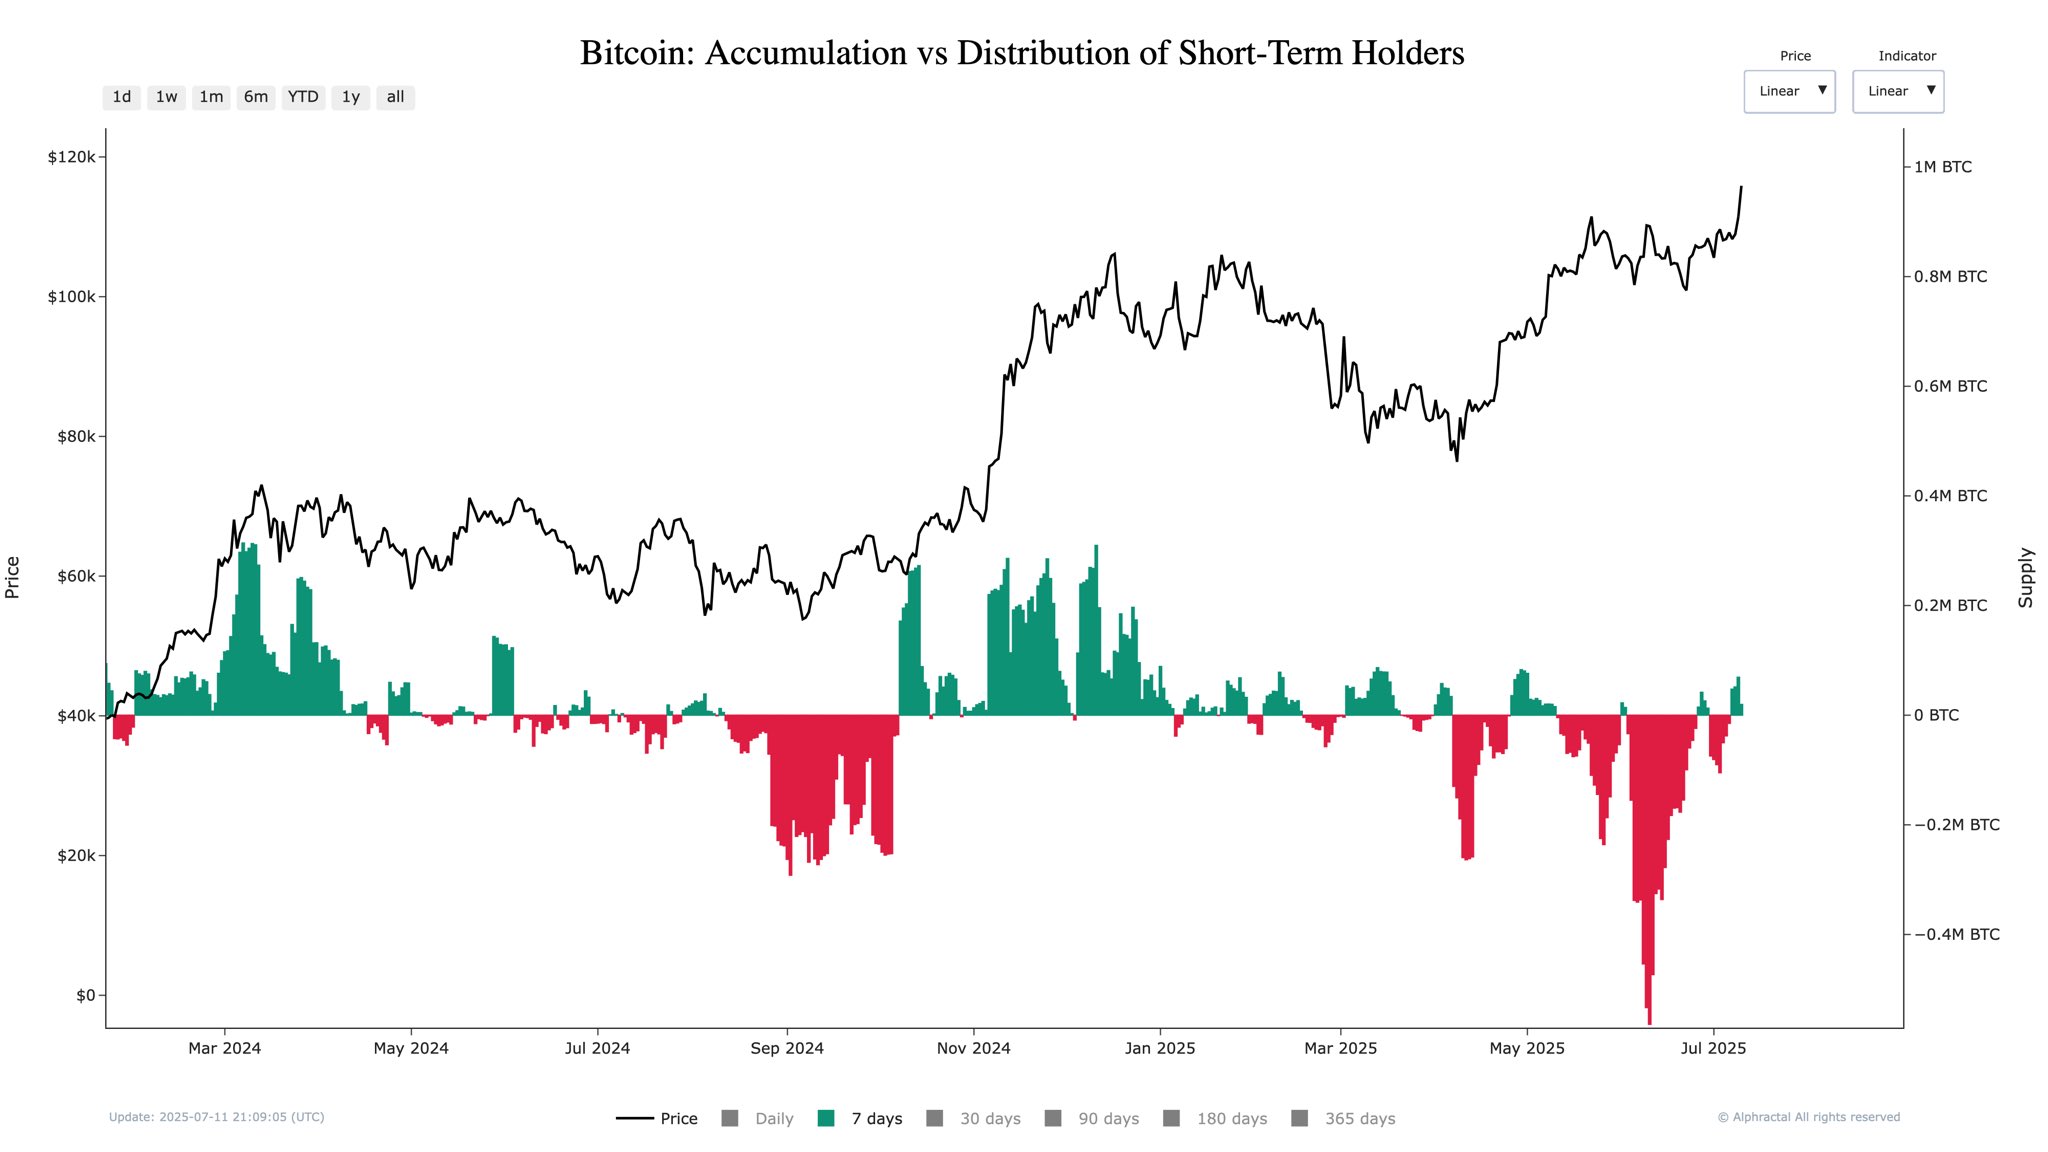
Within the same timeframe, the chart below shows short-term holders were represented more by the red graphs than the green, indicating more distribution than accumulation in the past month.
Boris credited the LTHs for Bitcoin’s survival above the $100,000 support zone. “Despite heavy STH distribution and retail selling pressure, BTC defended the 100K support — a clear sign of structural accumulation led by LTH wallets,” the on-chain analyst said.
According to Boris, the short-term holders were observed to have sold more than 563,000 BTC as Bitcoin continued to range. As this happened, the Long-Term holders steadily accumulated Bitcoin, and this absorbed most of the selling pressure from STHs.
However, this dynamic seems to have reversed very recently. The online pundit reported that the Long-Term Holders started distributing their Bitcoin holdings. This sell-off from the LTHs may be a result of profit-taking, as the cryptocurrency’s upward drift would necessitate.
On the other hand, the short-term holders have started to accumulate Bitcoin. This trend seen with this reactive group of investors indicates renewed retail interest or speculative entry amidst the current bullish rally.
Boris further inferred that this handover from LTH support to STH support must have fuelled Bitcoin’s latest breakout, as short-term momentum is injected into the market.
What’s Next For Bitcoin?
While this rotation of supply between holder classes may not be strange in crypto market cycles, the scale and timing of this switch suggest that Bitcoin’s price action holds more interesting rallies in the near future. However, if the short-term buying pressure should taper, the absence of long-term support may cause a lower support to be retested. As of this writing, Bitcoin is valued at $117,300, reflecting no significant movement in the past 24 hours.
Related Reading
Featured image from iStock, chart from TradingView
Dogecoin’s LTHs In ‘Denial’ — Why It Could Still Be Right For Them To Hold On? The Coin Republic
Source link ]]>
Is Dogecoin a Buy? Examining why LTHs are still betting on it AMBCrypto News
Source link ]]>
Data from Glassnode shows the recent selling from Bitcoin long-term holders has come from those who bought at more recent prices, and not the hodlers who got in during the 2017-2020 cycle.
Bitcoin Long-Term Holders Have Been Selling At An Average Loss Of 33%
As per the latest weekly report from Glassnode, the BTC long-term holder SOPR has had a value of less than one during recent weeks.
The “spent output profit ratio” is an indicator that tells us whether Bitcoin investors are selling at a profit or at a loss right now.
When the value of the ratio is greater than one, it means the market as a whole is selling at some profit right now. On the other hand, the indicator’s value being less than one implies the investors are realizing some loss on average currently.
Naturally, the metric’s value being exactly equal to one suggests the market is just breaking even at the moment.
The “long-term holder” group is a cohort that includes all investors who held their Bitcoin for at least 155 days before selling.
Now, here is a chart that shows the trend in the SOPR over the last decade specifically for these LTHs:
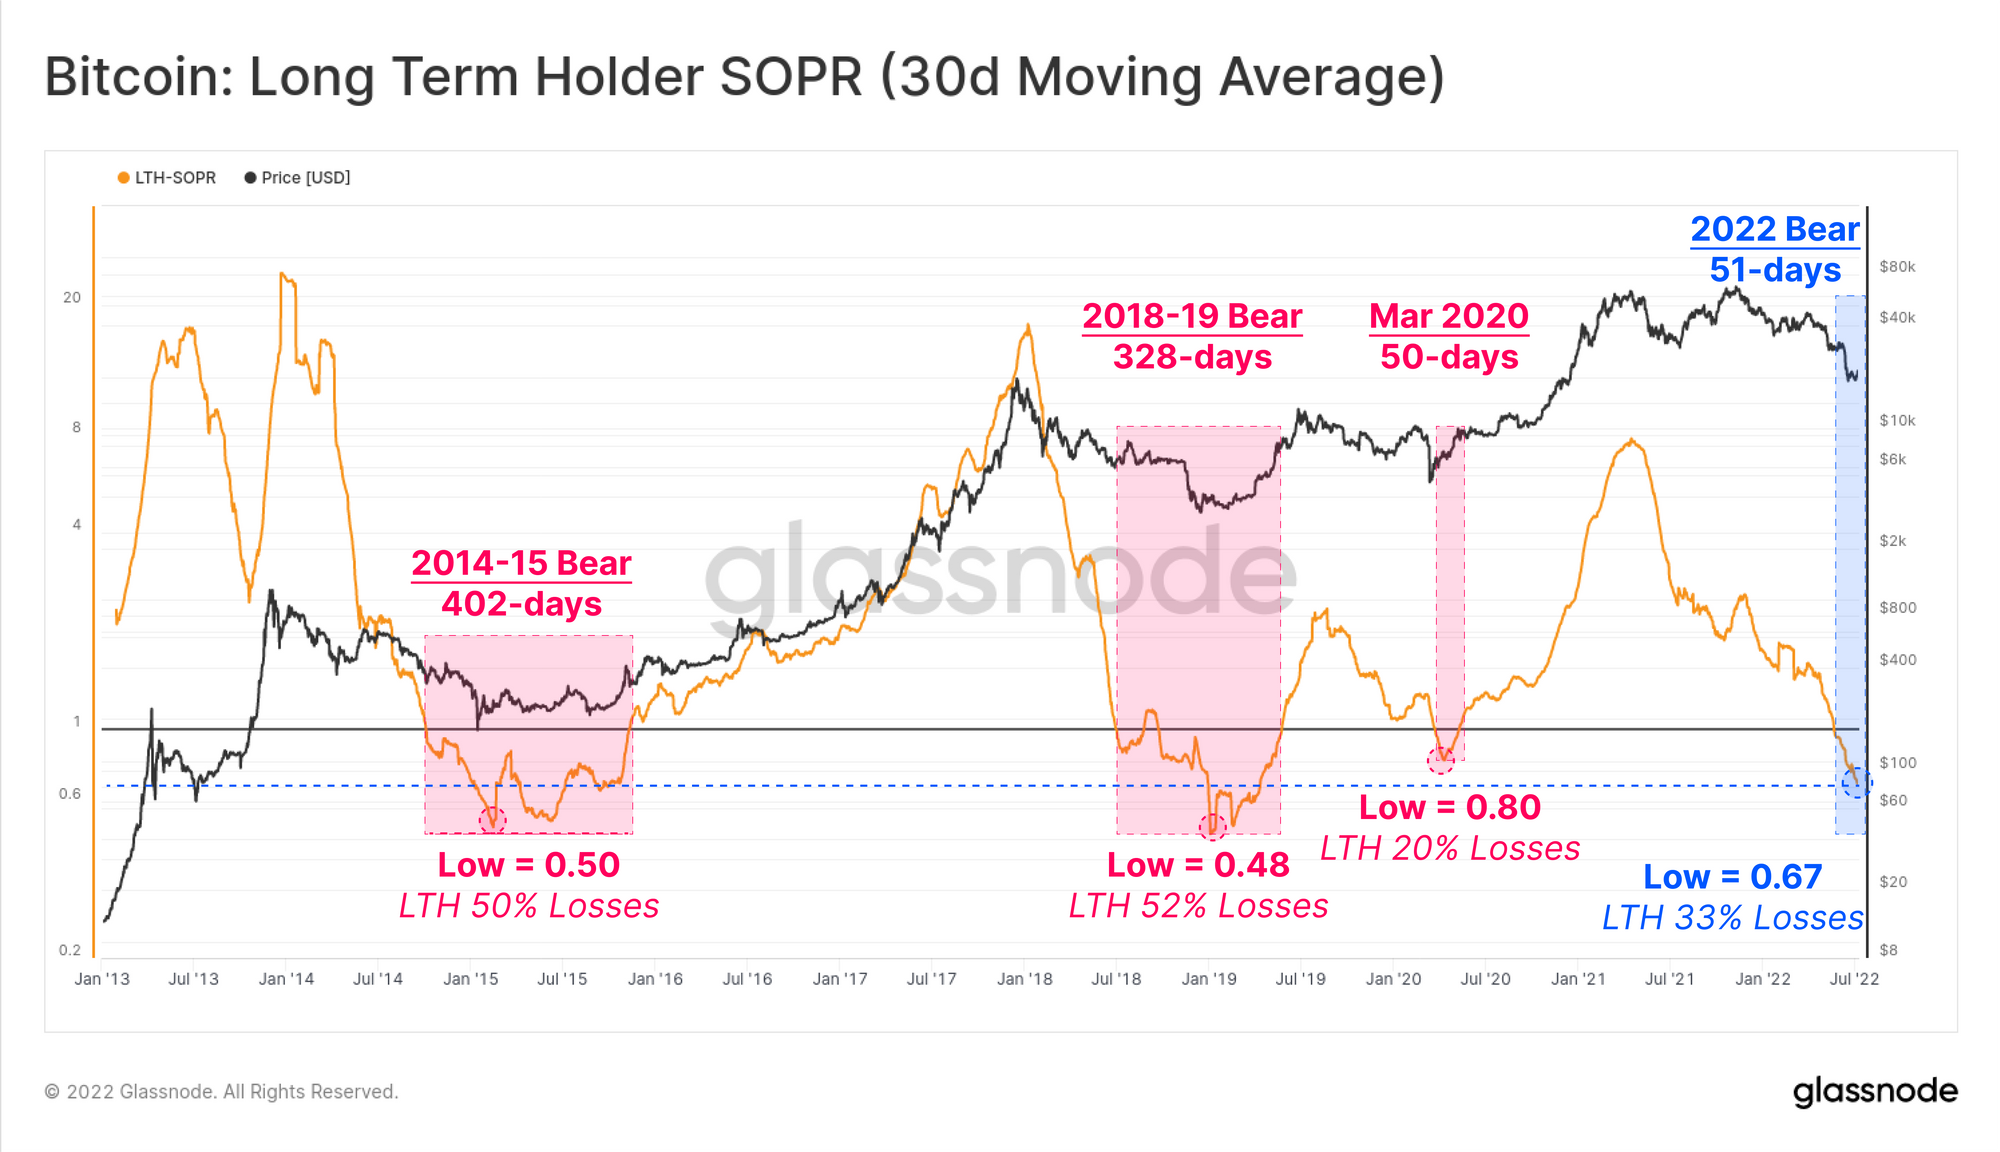
Looks like the value of the indicator has been going down recently | Source: Glassnode's The Week Onchain - Week 28, 2022
As you can see in the above graph, the Bitcoin long-term holders have been selling at an average loss of 33% in recent days.
Related Reading | Bitcoin Bearish Signal: Leverage Ratio Is Still Very High
However, as the below chart shows, the average cost basis of the LTHs is around $22.3k, which is only around 6% below the BTC price at the time the report came out (it’s now 10% at the current rate).
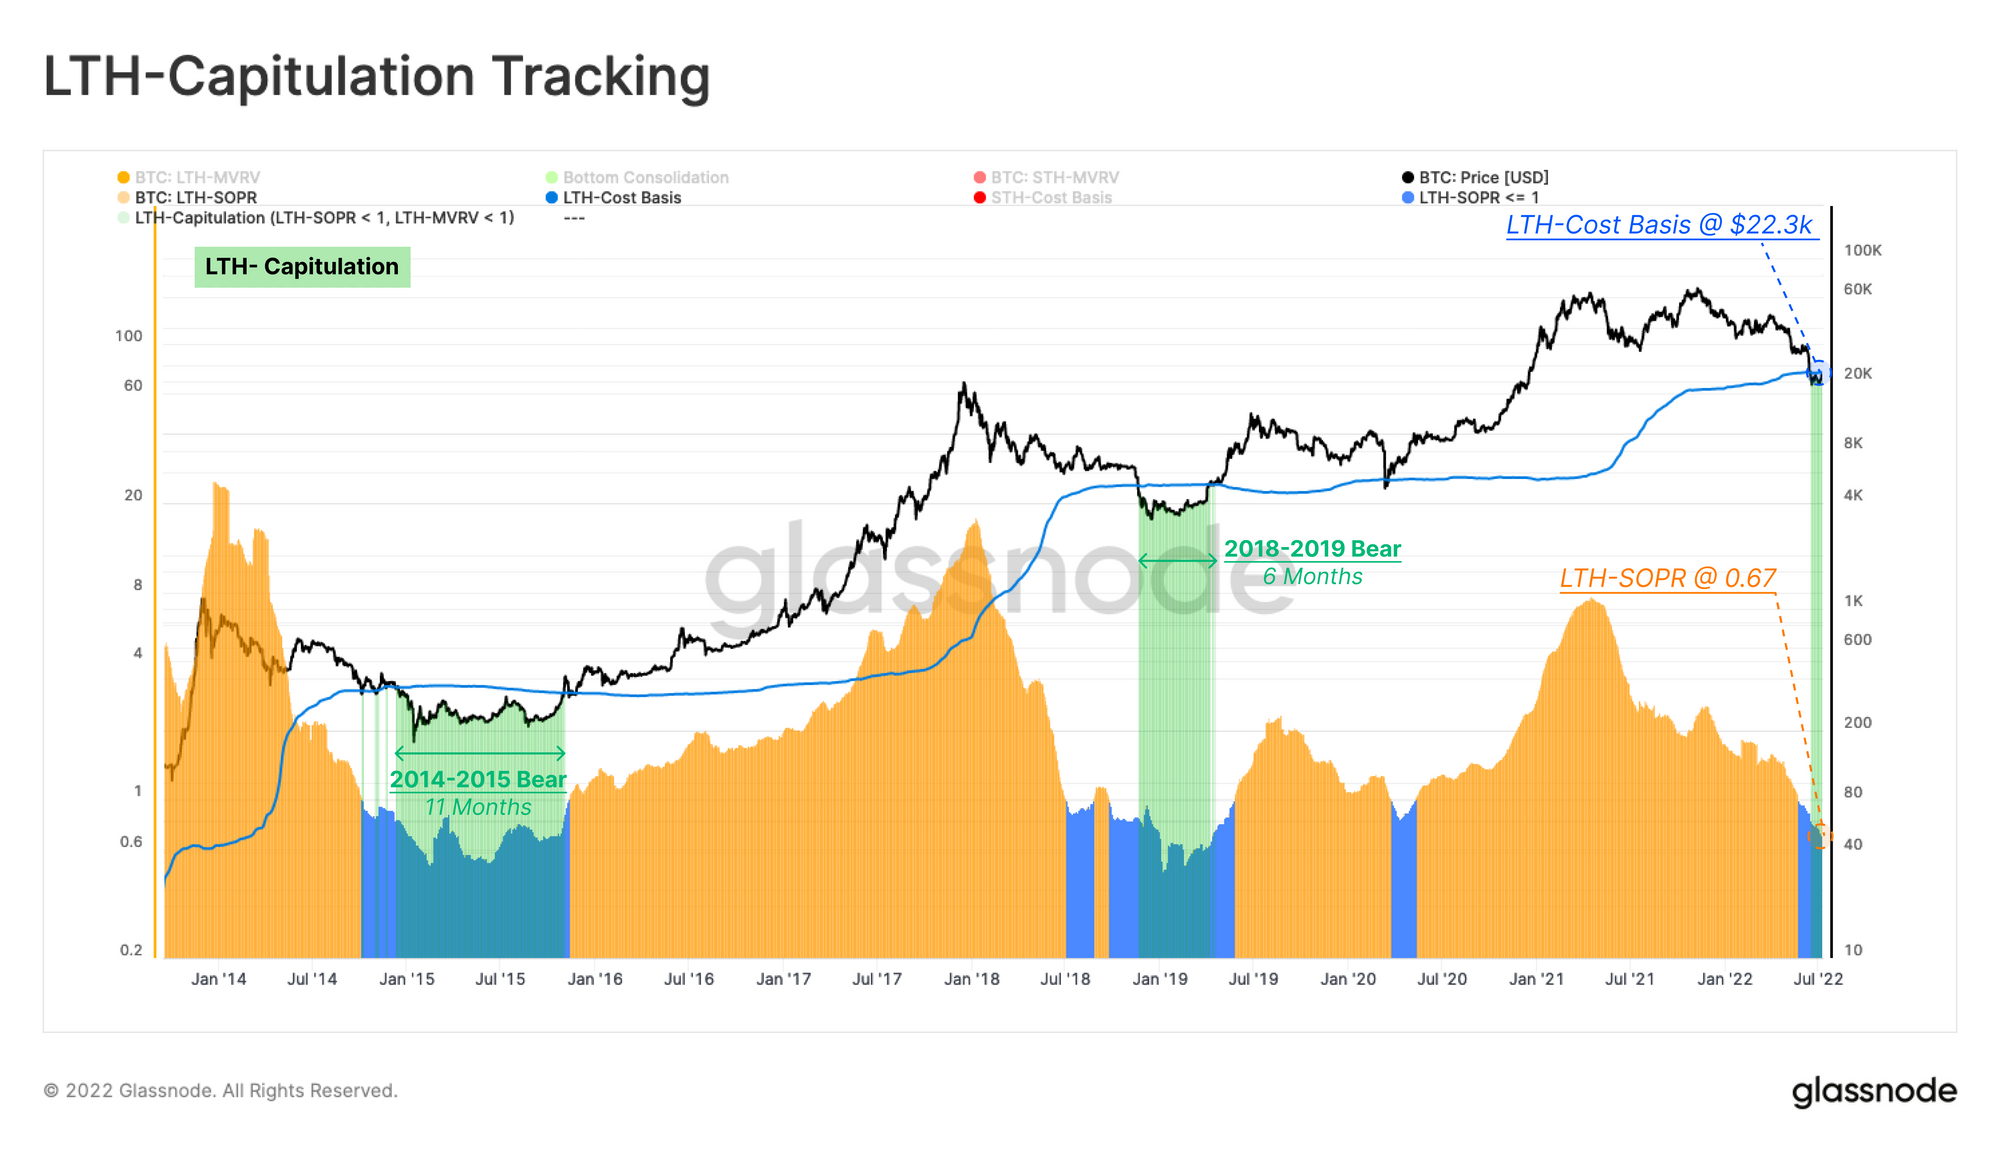
The BTC price seems to have sunk below the LTH cost basis recently | Source: Glassnode's The Week Onchain - Week 28, 2022
The LTHs selling at an average of 33% loss despite the cost basis putting them only 10% underwater means the recent selling has majorly come from hodlers who bought during the recent highs.
Related Reading | Former BitMEX CEO Arthur Hayes Says “Prepare” For A Massive Bitcoin Rally
This would suggest that LTHs who accumulated during the 2017-2020 cycle or earlier (and hence are either in profit, or in little loss) are still holding strong onto their Bitcoin.
BTC Price
At the time of writing, Bitcoin’s price floats around $19.7k, up 1% in the last seven days. Over the past month, the crypto has lost 31% in value.
The below chart shows the trend in the price of the coin over the last five days.

The value of the crypto seems to have been going down during the last few days | Source: BTCUSD on TradingView
Featured image from Kanchanara on Unsplash.com, charts from TradingView.com, Glassnode.com
Data shows Bitcoin long-term holders have realized a significant amount of losses recently, a sign that the final capitulation before the bottom may be here.
Bitcoin Long-Term Holder SOPR Shows Average of 27% Losses Being Realized This Week
According to the latest weekly report from Glassnode, BTC long-term holders seem to have harvested some losses this week.
The “spent output profit ratio” (or the SOPR in short) is an indicator that tells us whether Bitcoin investors are selling at a profit or a loss right now.
The metric works by looking at the on-chain history of each coin being sold to see what price it last moved at. If this price was less than the current one, then the coin has been sold at a profit.
On the other hand, the last selling price being more than the latest would imply the sale of the coin has realized a loss.
When Bitcoin SOPR values are greater than one, it means coins moving right now are, on average, selling at a profit.
Related Reading | Bitcoin On-Chain Data Signals A Long Squeeze Brewing In Futures Market
While the value of the indicator being less than one suggests the overall market is selling at a loss at the moment. Naturally, the ratio being exactly equal to 1 signifies that investors are breaking even on average.
Now, here is a chart that shows the trend in the Bitcoin SOPR for long-term holders, a cohort that holds their coins for at least 155 days before selling.
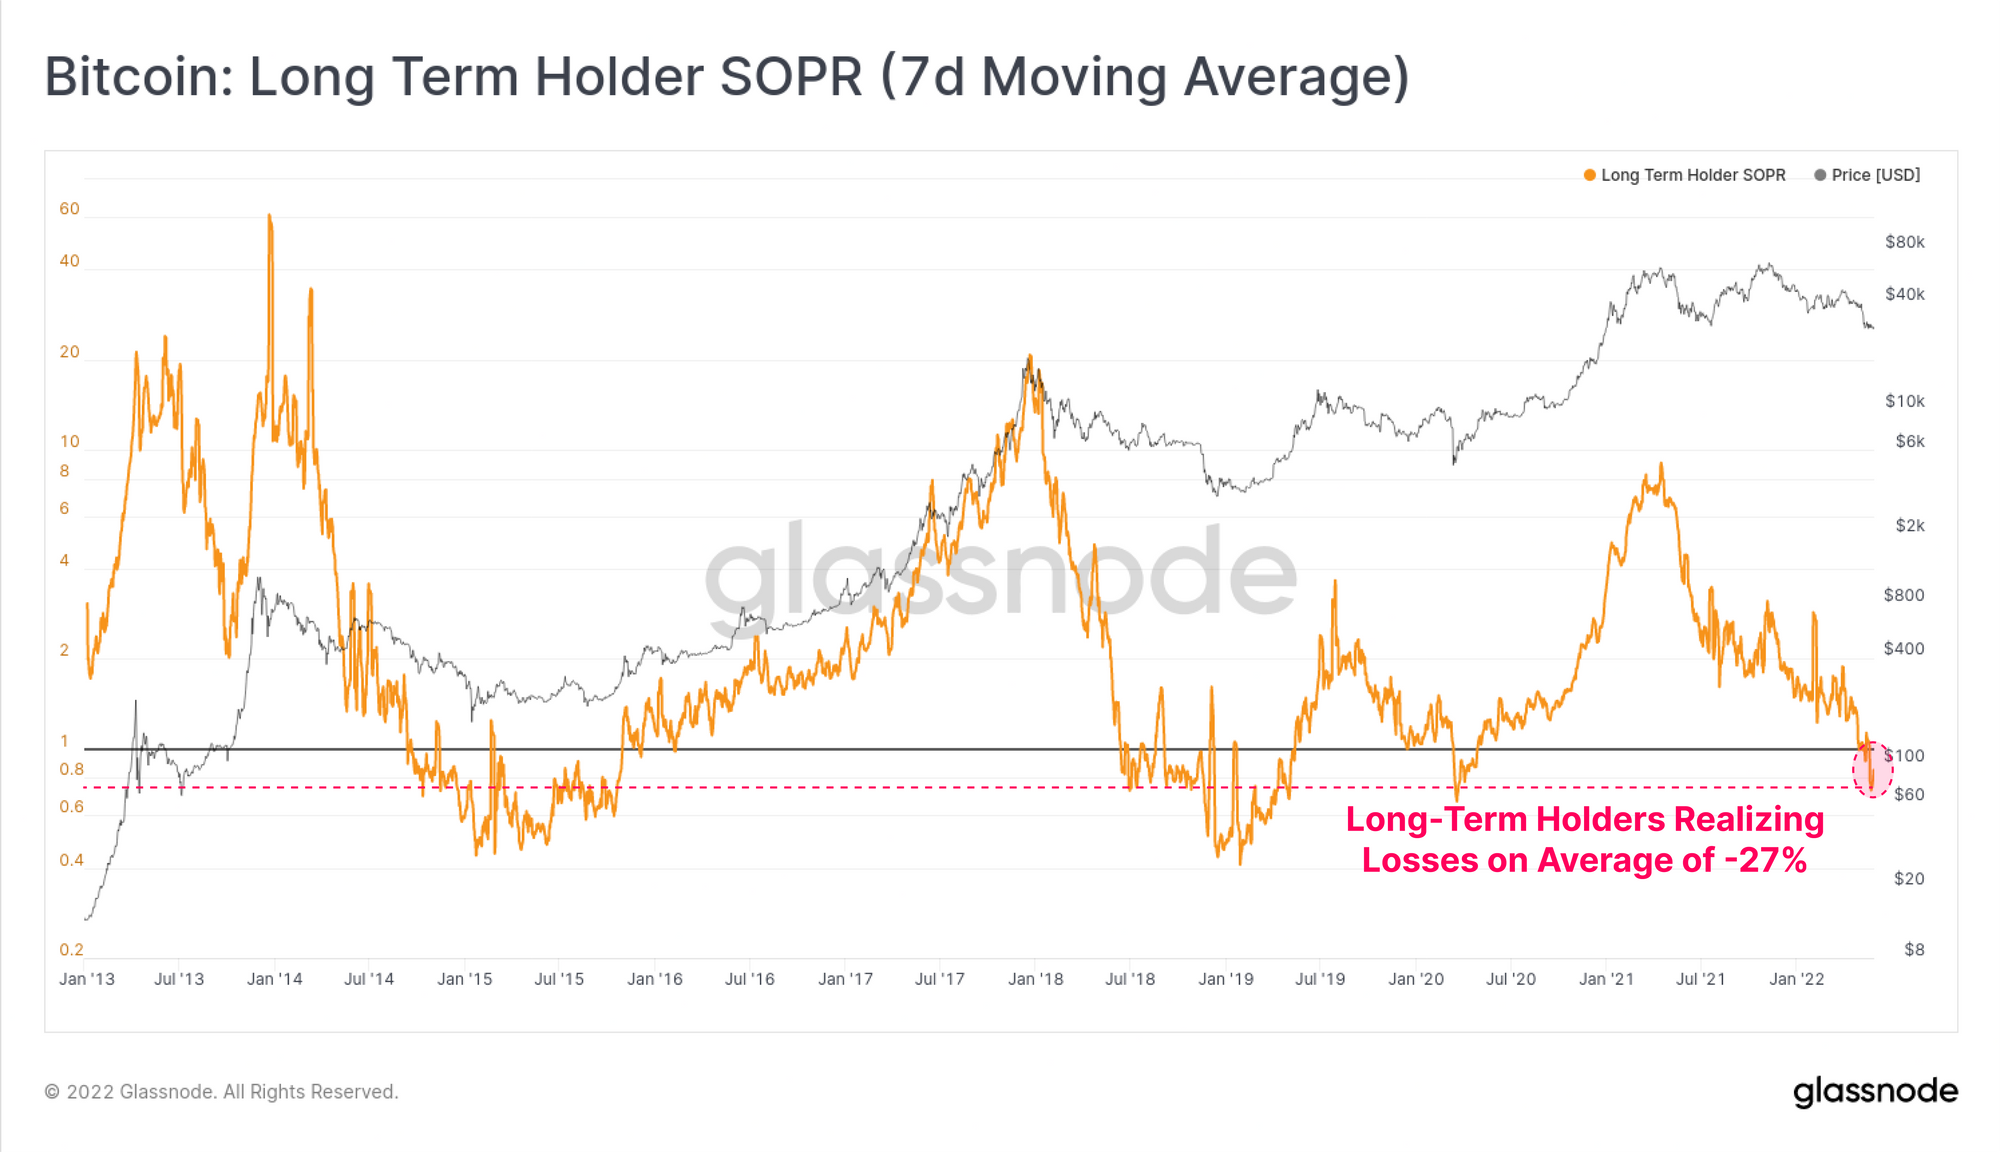
Looks like the 7-day average value of the metric has sunk recently | Source: Glassnode's The Weekly Update - Week 22, 2022
As you can see in the above graph, the Bitcoin long-term holder SOPR has been observing a negative value during this past week.
The current value of the indicator suggests that each LTH coin spent in the last seven days has realized an average of 27% loss.
Related Reading | Billionaire Tim Draper On What Will Trigger The Next Bitcoin Bull Market
The report notes that in the history of the coin, similar values of the metric have only been observed during the final capitulation lows of bear markets.
This may suggest that the current Bitcoin market could also be nearing a bottom. However, both during 2015 and 2018, the LTH SOPR dipped even deeper and the price corrected further before the low was reached.
BTC Price
At the time of writing, Bitcoin’s price floats around $31.7k, up 9% in the last seven days. Over the past month, the crypto has lost 18% in value.
The below chart shows the trend in the price of the coin over the last five days.

The value of Bitcoin seems to have shot up over the past couple of days | Source: BTCUSD on TradingView
Featured image from Unsplash.com, charts from TradingView.com, Glassnode.com
Data shows Bitcoin long-term holders hold significantly more supply in loss right now compared to May-July of 2021.
15% Of Bitcoin Long-Term Holder Supply Is In Loss Right Now
As per the latest weekly report from Glassnode, around 30% of the total BTC supply is being held at a loss at the moment.
The “long-term holder supply” is the part of the total Bitcoin supply that hasn’t shown any movement since more than at least 155 days ago.
The other part of the supply belongs to the “short-term holders.” This cohort doesn’t hold for too long and generally sells before 155 days are up. Active traders usually make up a significant portion of this supply.
Naturally, any coins in the Bitcoin STH supply that age beyond the 155-day mark are then counted under the LTH supply.
The relevant indicator here is the “supply in profit/loss,” which looks at each coin on the chain to see how many coins are in profit or loss right now.
Related Reading | Bitcoin Trading Volume Stabilizes At Lows Of July 2021 As Market Sleeps
The metric works by comparing the price a coin was last moved at, to the current value. If the last price was more than now, then the Bitcoin is being held in loss at the moment. Otherwise, it’s in profit.
Now, here is a chart that shows the loss distributions of both the LTHs and the STHs.
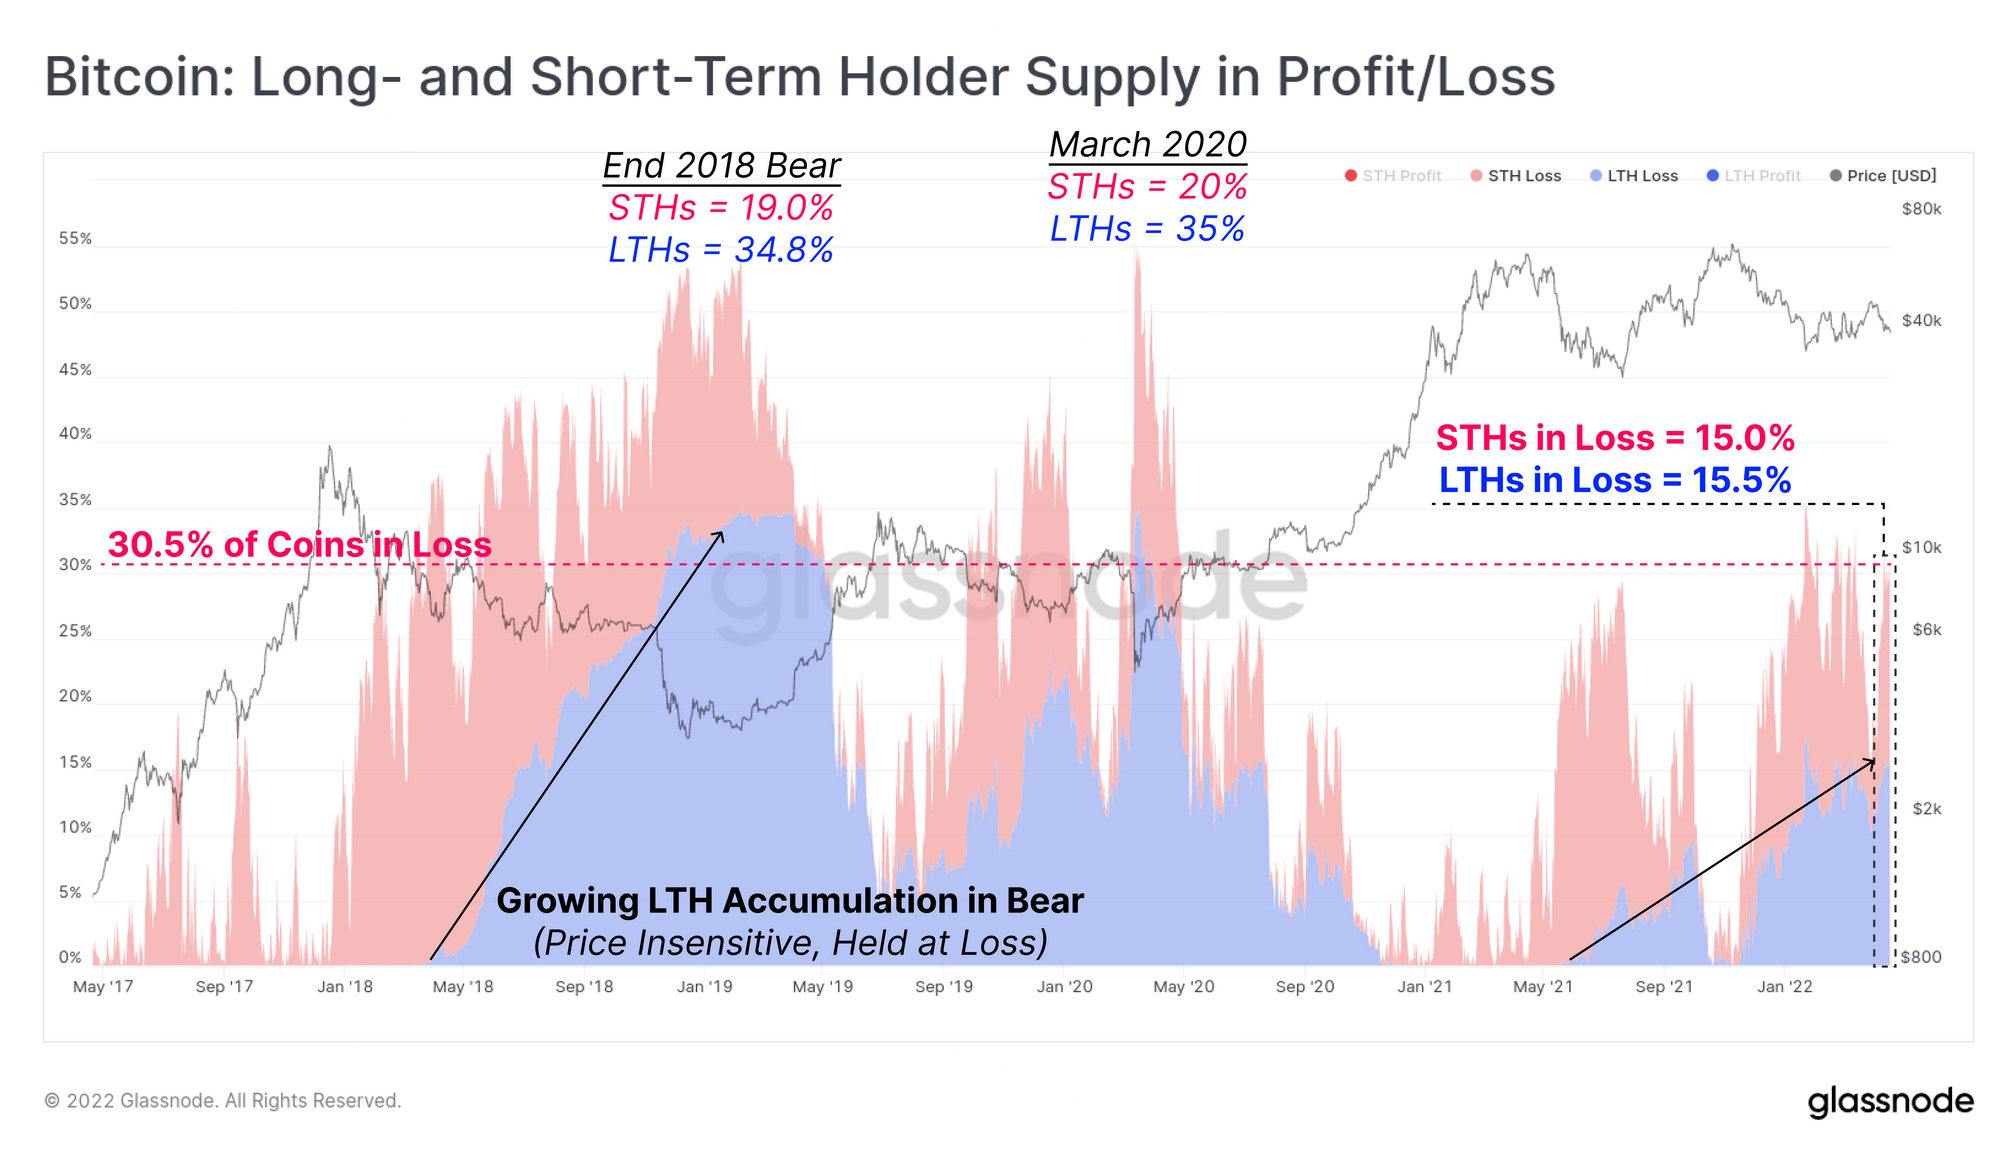
Looks like the loss split is quite even between the two categories right now | Source: Glassnode's The Week Onchain - Week 16, 2022
As you can see in the above graph, around 15.3% of the Bitcoin LTH supply is in loss currently, with STHs also having almost the same amount in the red at 15%.
During the 2018 and 2020 bear markets, about 35% of the LTHs were in loss at some points, much more than right now.
Related Reading | The CEO Of Ripple Says Bitcoin Tribalism Is Holding Back The Crypto Industry
However, the May-July mini-bear period of last year had only half as many long-term holders holding coins at a loss.
This means that the market profitability is in a much worse place at the moment. While LTHs are unlikely to sell with these losses as they are price insensitive usually, the STHs at 15% are more probable to capitulate if the Bitcoin price continues to struggle.
BTC Price
At the time of writing, Bitcoin’s price floats around $42.5k, up 3% in the last week. Over the past month, the crypto has gained 3% in value.
The below chart shows the trend in the price of the coin over the last five days.

The price of BTC seems to have been climbing up over the past few days | Source: BTCUSD on TradingView
Featured image from Unsplash.com, charts from TradingView.com, Glassnode.com