Dogecoin Price Prediction: If Key Factors are Maintained, Some Analysts Forecast a $1 DOGE in 2026 openPR.com
Source link ]]>
Bitcoin price is holding the key support at $60,000. BTC could start another increase and rise toward the range resistance at $63,500.
- Bitcoin is still trading in a range between $60,000 and $63,500.
- The price is trading above $61,500 and the 100 hourly Simple moving average.
- There was a break above a connecting bearish trend line with resistance at $61,550 on the hourly chart of the BTC/USD pair (data feed from Kraken).
- The pair could gain bullish momentum if it clears $62,200 and $62,500.
Bitcoin Price Remains Steady
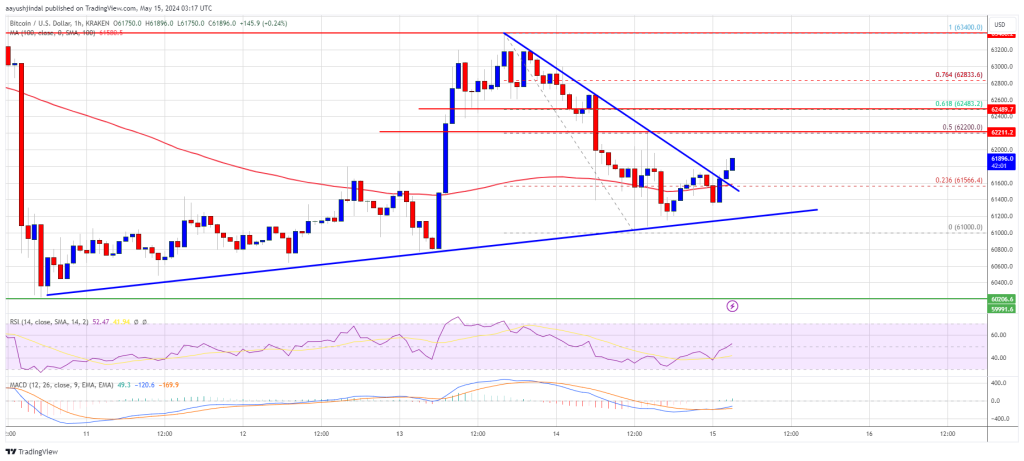
Bitcoin price started another decline from the $63,500 resistance zone. BTC traded below the $62,500 and $62,200 support levels. A low was formed at $61,000 and the price started a recovery wave.
There was a move above the $61,250 and $61,500 levels. Besides, there was a break above a connecting bearish trend line with resistance at $61,550 on the hourly chart of the BTC/USD pair. There was a move above the 23.6% Fib retracement level of the recent decline from the $63,400 swing high to the $61,000 low.
Bitcoin is still trading above $61,500 and the 100 hourly Simple moving average. Immediate resistance is near the $62,200 level or the 50% Fib retracement level of the recent decline from the $63,400 swing high to the $61,000 low.
The first major resistance could be $62,500. The next key resistance could be $63,000. A clear move above the $63,000 resistance might send the price higher. The main resistance now sits at $63,500. If there is a close above the $63,500 resistance zone, the price could continue to move up. In the stated case, the price could rise toward $65,000.
Another Drop In BTC?
If Bitcoin fails to climb above the $62,500 resistance zone, it could start another decline. Immediate support on the downside is near the $61,550 level and the 100 hourly Simple moving average.
The first major support is $61,000. If there is a close below $61,000, the price could start to drop toward $60,400. Any more losses might send the price toward the $60,000 support zone in the near term.
Technical indicators:
Hourly MACD – The MACD is now gaining pace in the bullish zone.
Hourly RSI (Relative Strength Index) – The RSI for BTC/USD is now above the 50 level.
Major Support Levels – $61,550, followed by $61,000.
Major Resistance Levels – $62,200, $62,500, and $63,500.