A worst-case scenario is now on the table. Some analysts say Bitcoin could fall as low as $41,000 if a bear flag pattern currently forming on price charts plays out — a warning sign drawing attention as the cryptocurrency trades near $66,000, roughly half of what it was worth at its recent high.
Related Reading
Geopolitical Shock Hits At A Bad Time
The closure of the Strait of Hormuz sent oil prices surging this week, rattling global markets and pulling risk assets lower. Bitcoin was caught in the selloff.
Prices slipped below $66,000 as traders weighed rising energy costs, stubborn US inflation, and fresh stress in the bond market. The timing of the geopolitical flare-up has made an already fragile price setup harder to defend.
A bear flag pattern — a technical chart signal where prices briefly consolidate after a decline before continuing lower — is now visible on Bitcoin’s chart.
Based on reports from market analysts, the pattern puts an initial downside target near $50,000, with the $41,000 level emerging as a deeper floor if selling pressure intensifies.
Bitcoin is down 47% from its peak. That kind of drawdown might sound alarming, but analysts who track long-term crypto cycles say it fits a pattern that has shown up before.
A Cycle That Has Played Out Before
Data shows that Bitcoin tends to lose momentum in midterm years. Reports going back to 2014, 2018, and 2022 show a recurring sequence: prices start the year relatively stable, fade through late Q1 into early Q2, and then grind lower through the summer months. The 2026 price action has tracked this historical average closely.
On average, around now is when #Bitcoin continues its decline in midterm years. pic.twitter.com/JZ7Rcx2wJY
— Benjamin Cowen (@intocryptoverse) March 27, 2026
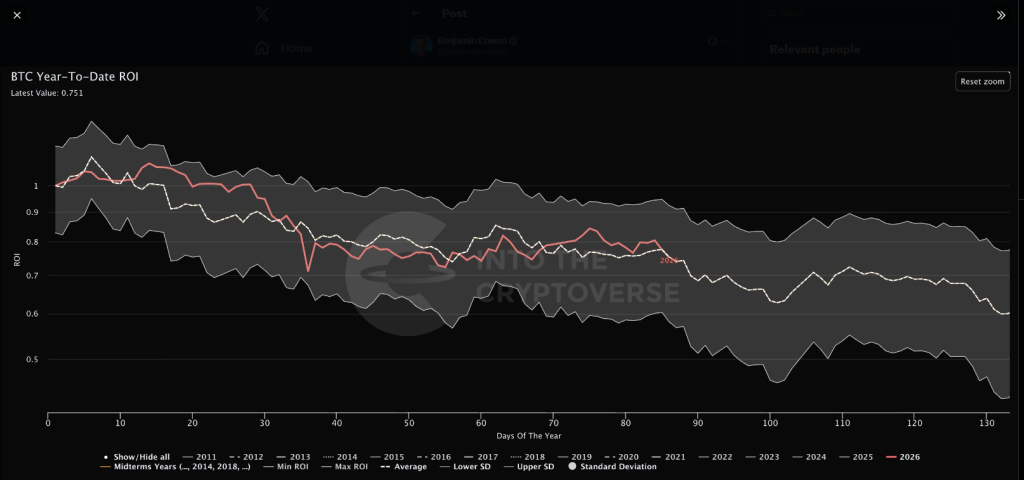
Analyst Benjamin Cowen, who has followed Bitcoin’s multi-year cycles, points to what he calls the mid-cycle dip zone — a phase that typically follows a major bull run and stretches across several quarters.
According to Cowen, midterm years are not crash events. They are cooldown periods. Rallies lose steam. Volatility picks up. Corrections run longer than most investors expect.
That description fits what is happening now. Following a strong run in 2025, Bitcoin’s year-to-date performance has tilted negative, matching the kind of softening seen in prior cycles.
Related Reading
Patience May Be The Only Strategy Left
For long-term Bitcoin holders, the message from analysts is straightforward: this has happened before, and it has always eventually ended.
But the short-term picture offers little comfort. Macro pressures are stacking up at the same moment that Bitcoin’s chart structure is weakening, and there is no clear catalyst in sight to reverse the trend.
Featured image from Unsplash, chart from TradingView
Dogecoin (DOGE) Weekly Ascending Triangle Signals $1.8 Target: Mid-Term Breakout Setup for Traders Blockchain News
Source link ]]>
Dogecoin Price Signals Mid-Term Uptrend Possibility Bitcoinsensus
Source link ]]>
Dogecoin Sits Below Mid-Term Trendline: Trading Analysis and Opportunities Blockchain News
Source link ]]>
Bitcoin, Ethereum, Dogecoin Slide As Stocks Rally: Analyst Spots ‘Good Sign’ For ETH’s Mid-Term And Long-Term Price Outlooks Benzinga India
Source link ]]>
Bitcoin, Ethereum, Dogecoin Surge As Traders Raise Risk Appetite Ahead Of Thanksgiving: Analyst Sets Mid-Term Price Target For ETH At $6K MSN
Source link ]]>
Ethereum (ETH) has been struggling with a significant downturn recently, leaving the asset deep in the red. Over the past week, Ethereum has recorded a 9.2% decline in value, reflecting broader market weakness.
However, the past 24 hours have brought a slight change in momentum, with ETH seeing a 3.2% increase in price. Though this uptick is not enough to erase the previous week’s losses, it may signal the beginning of a recovery phase.
Is Ethereum At The End Of Its Correction
According to the latest analysis from renowned crypto analyst Alex Clay on X, Ethereum might be gradually recovering because its recent bearish market might be concluding.
He emphasized that if ETH can maintain consolidation above key technical zones, specifically the 200-day moving average (MA) and 200-day exponential moving average (EMA), it would provide a strong foundation for an upward rally.
A significant price break above the $2,500 mark could confirm that the correction has ended and the asset is primed for recovery. Furthermore, while Clay had previously been optimistic about Ethereum reaching a much higher price target, he has revised his expectations based on recent market conditions.
#ETH/USD
Imo we are at the end of the $ETH correction
Looking for some consolidation above the Key Zone + 200 MA & 200 EMA confluence
Break above $2500 will serve a confirmation of the beginning of the rally
#Ethereum turned to be a heavy asset so $10k target is rather… pic.twitter.com/jjGPPUHWE3
— Alex Clay (@cryptclay) September 9, 2024

Clay noted: “Ethereum turned to be a heavy asset, so $10k target is rather a dream than reality so I changed my mind.” For now, the analyst has set more realistic targets, with a mid-term goal of $4,000 and long-term targets ranging from a conservative $6,255 to an optimistic $7,942.

Other Analysts Eye Falling Wedge Pattern As Key Indicator
Aside from Clay’s analysis, Ethereum’s technical chart has been the focus of several prominent analysts, including Anup Dhungana and Captain Faibik, who have recently identified the potential for a bullish breakout for ETH.
For instance, Dhungana’s ETH/BTC chart analysis suggests that a rebound from key support levels and a break from the falling wedge pattern could significantly increase Ethereum’s price.

For context, falling wedges are generally viewed as bullish reversal patterns in technical analysis, and confirming a breakout could signal an exponential upward trend.
Similarly, Captain Faibik echoed this sentiment, sharing an image of altcoin market chart that also displayed a falling wedge formation.
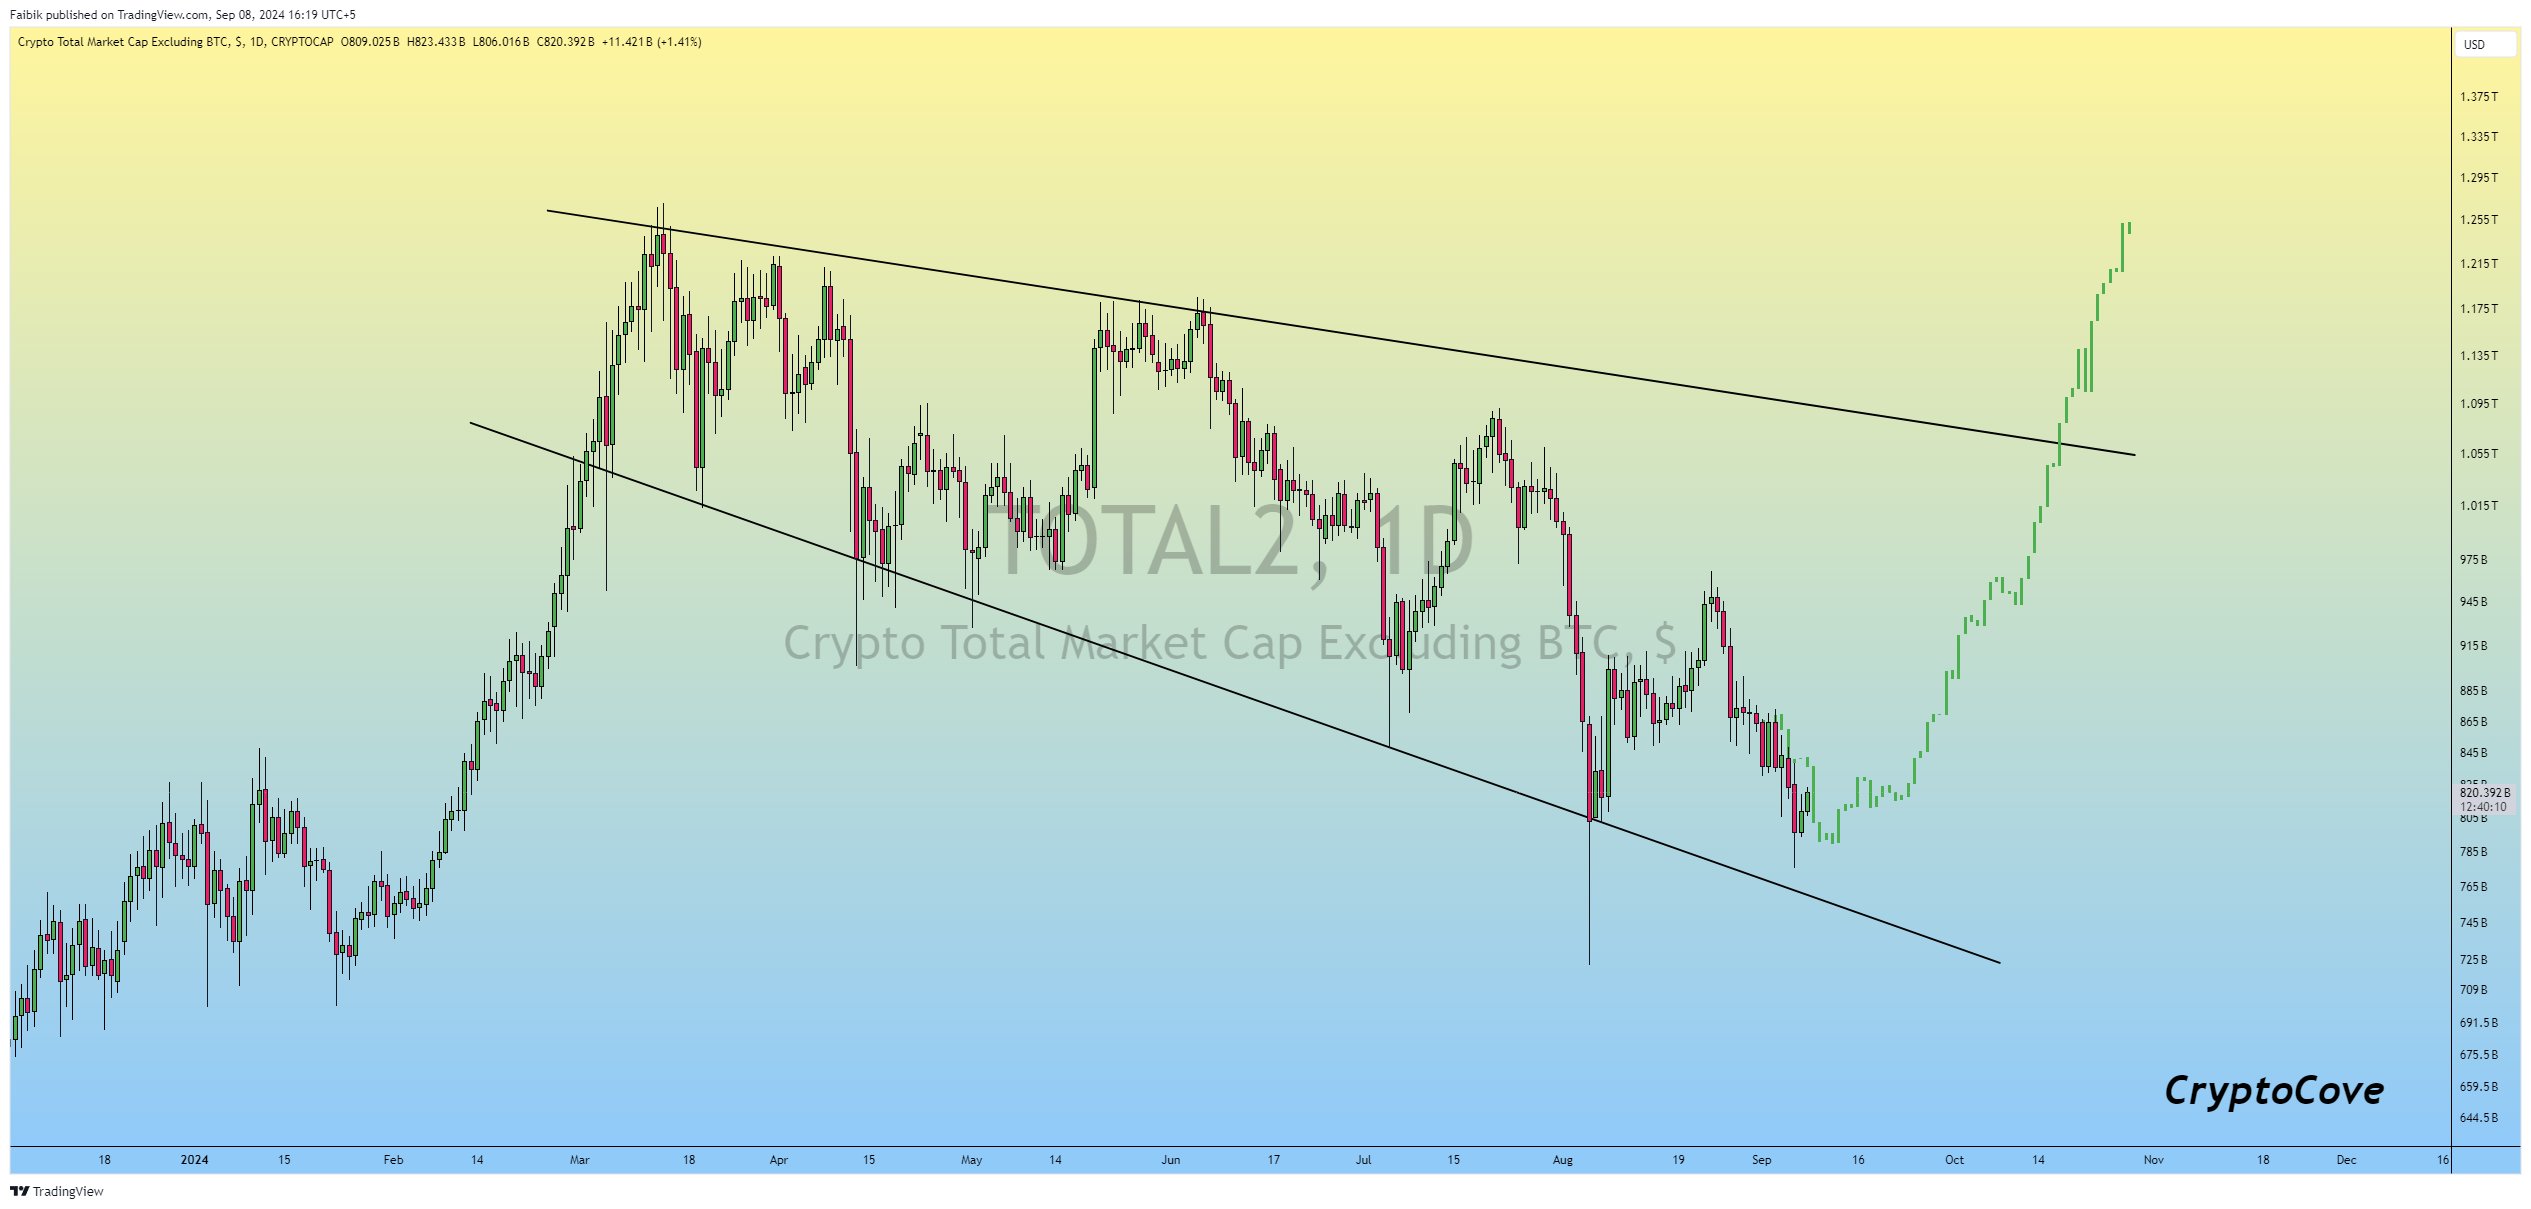
Faibik predicted that altcoins could break out of the wedge pattern shortly, potentially pushing major altcoins, including ETH, toward a recovery in the fourth quarter of 2024.
He advised investors to remain patient, accumulate altcoins, and prepare for a bounce back that could see prices return to their March 2024 highs.
Featured image from DALL-E, Chart from TradingView
]]>Egrag, a crypto analyst, today presented his medium-term predictions for the XRP price on X (formerly Twitter). He backed up his projections with the 3-day chart and pointed out several potential price points that investors should watch out for.
Analysis Of The 3-Day Chart XRP/USD
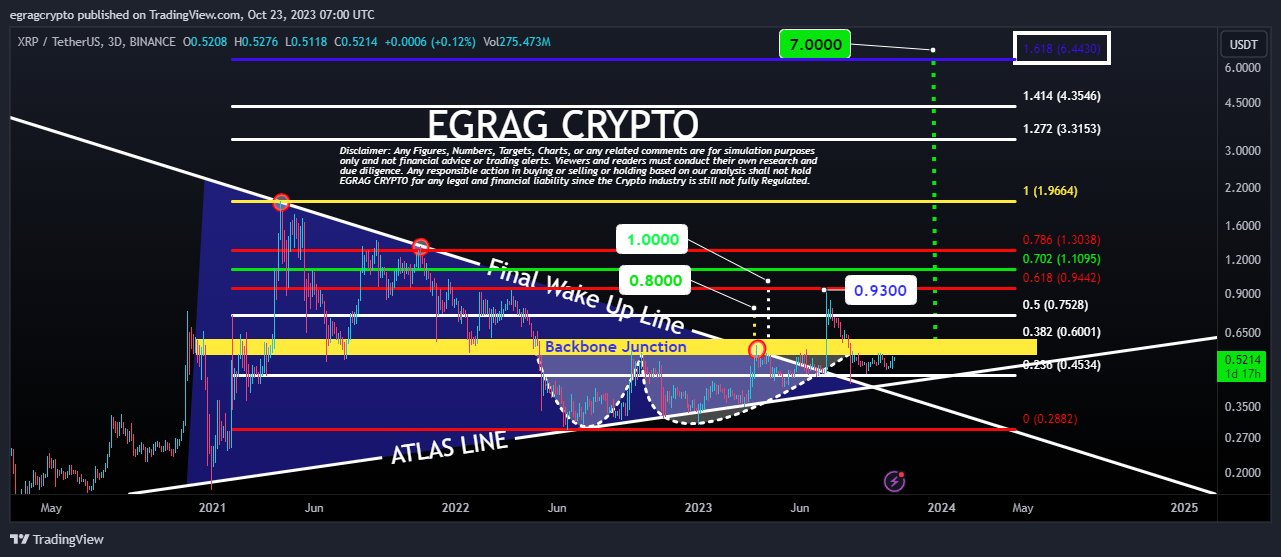
Egrag’s chart, based on Binance’s 3-day XRP/USDT pair, suggests that XRP is currently in the midst of a crucial breakout retest phase. He emphasized the current market dynamics by saying, “What’s happening right now is merely a retest of the breakout; the true pump is still on the horizon, and it’s bound to be epic!”
The analyst highlighted XRP’s triumphant rally from mid-July, which surpassed his original target of $0.85 and rose to a commendable $0.93, surpassing the original price target by 9.41%. Egrag’s 3-day chart shows a descending trend line, which the analyst calls the “Final Wake Up Line.”
According to him, the breakout above the trend line on July 13 after the summary judgment in the lawsuit between Ripple Labs and the US Securities and Exchange Commission (SEC) was the final wake-up call for investors who were still waiting on the sidelines.
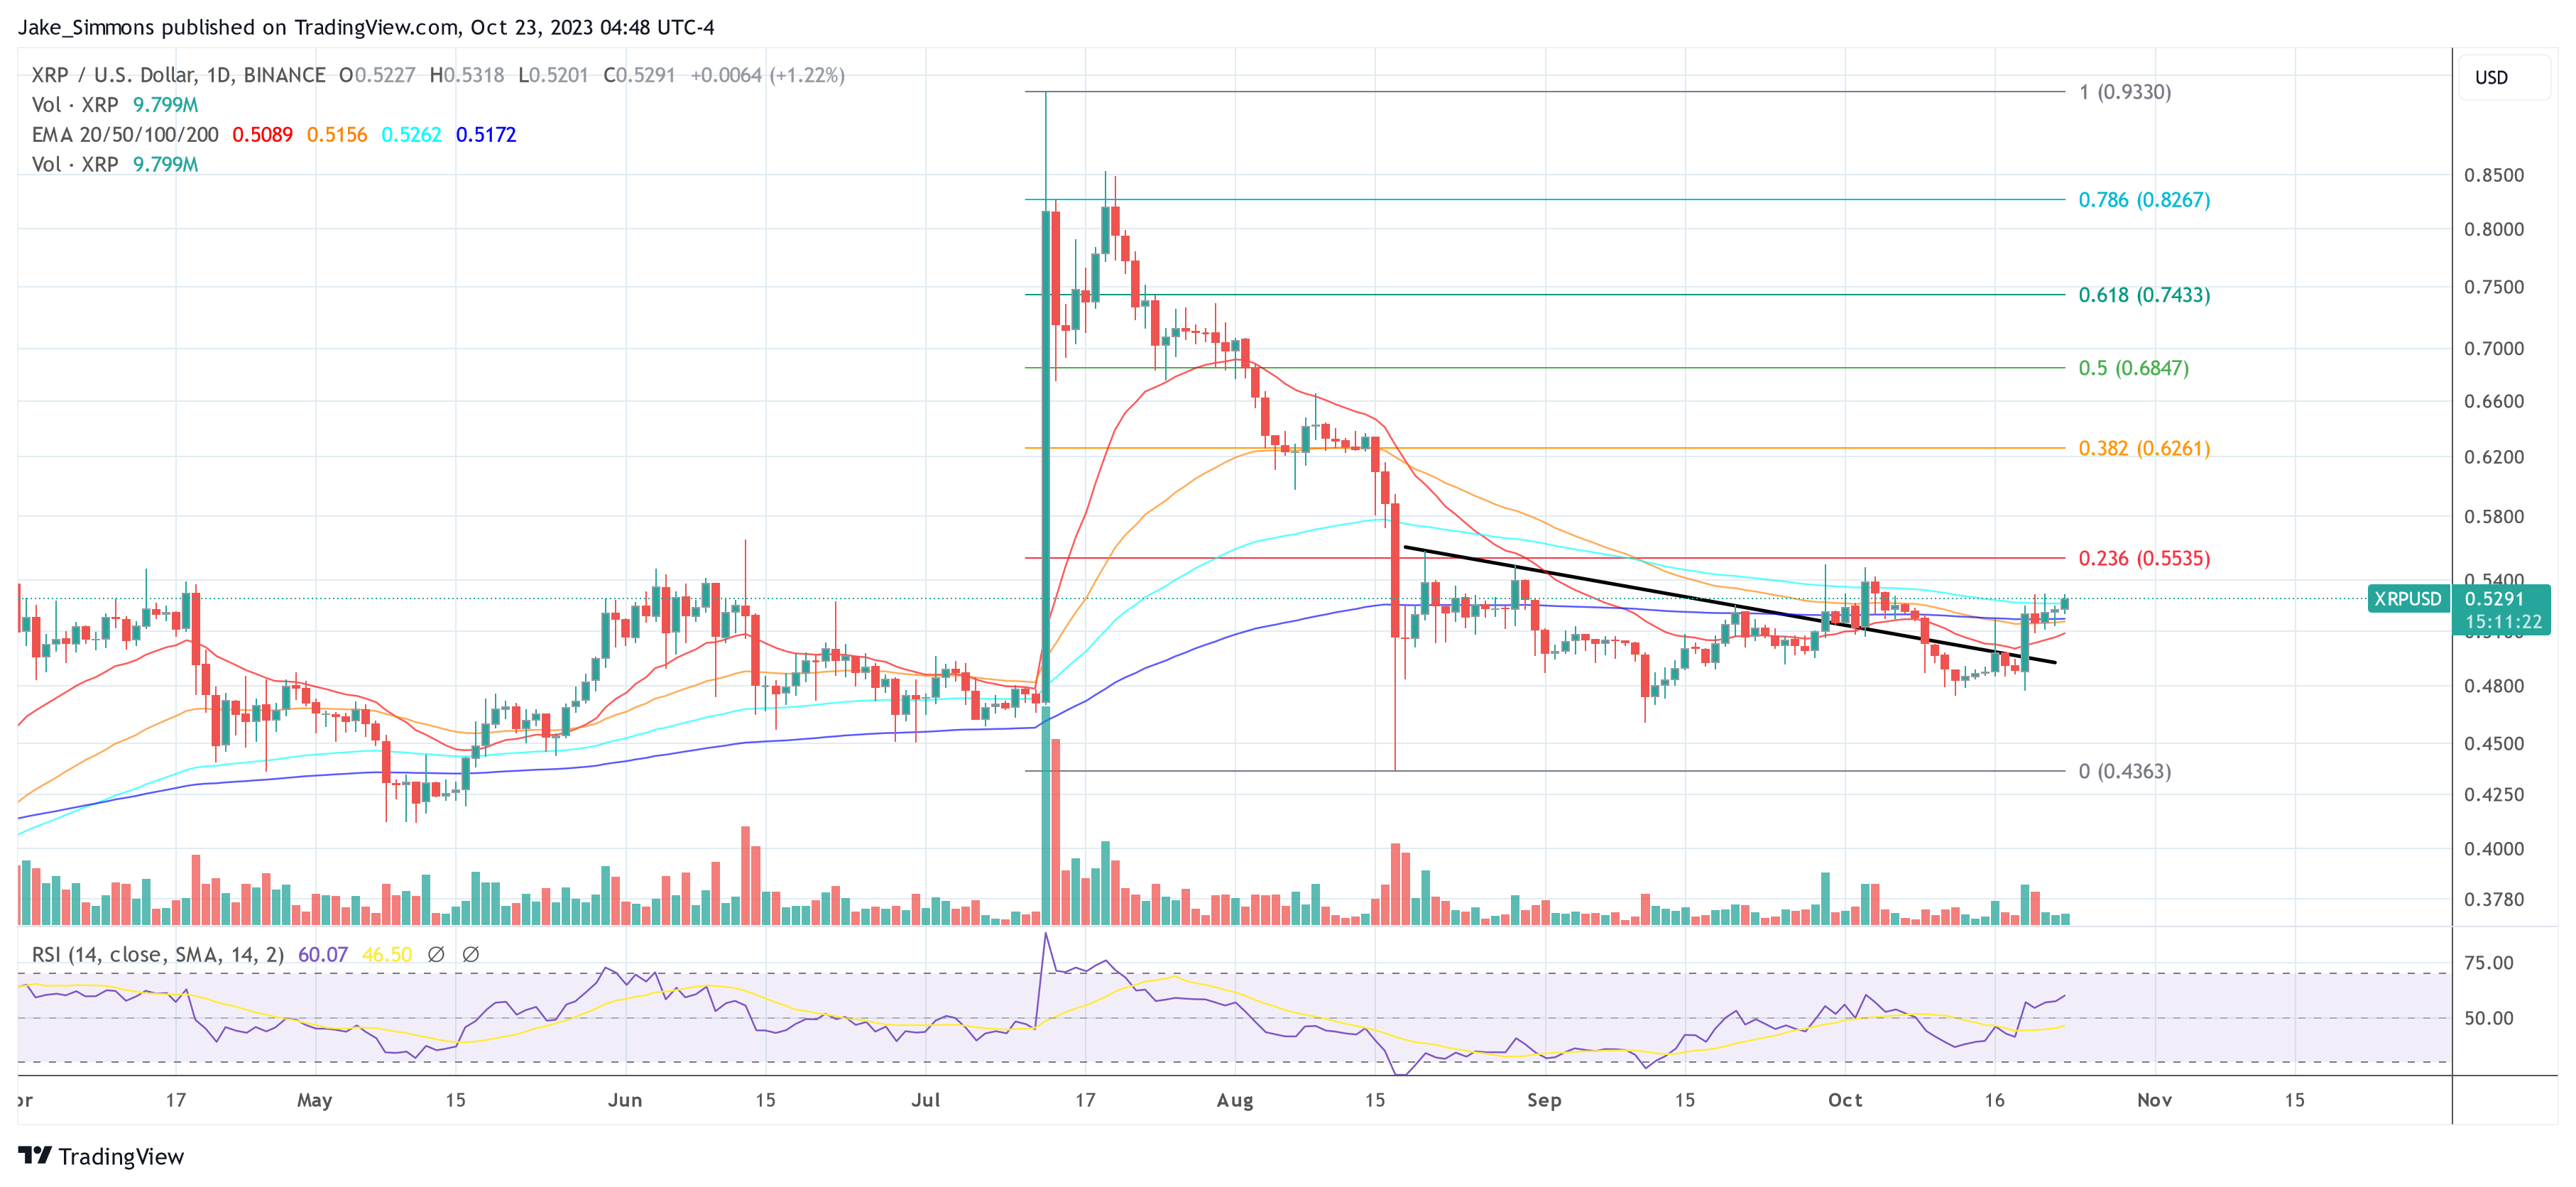
Currently, the XRP price sits at around $0.52. As the analyst shows in the chart, XRP has experienced a retest of the trend line and passed it with flying colors. In particular, Egrag also points out that XRP was able to stay above the 0.236 Fibonacci retracement level at $0.4534.
This laid the foundation for the XRP price to enter bullish territory at this point. However, the price still faces the resistance zone between $0.55 and $0.60, which Egrag calls the “backbone junction”. Noteworthy is that the upper end of the price range coincides with the 0.382 Fibonacci retracement level. Exceeding this resistance is crucial, especially because it has provided strong resistance several times in the past.
Once this is accomplished, Egrag’s medium-term XRP price targets will come into focus. As explained, he has made an adjustment to his price targets as a result of the July increase. Due to the 9.41%-higher July rise compared to his original price target, Egrag now expects XRP to rise to $1.10 (instead of $1) in an initial rally.
Egrag has also raised the $5.5 price target to around $6, and the previous $6.4 benchmark has been recalibrated to nearly $7. He stated:
So, if we apply this same percentage increase to our upcoming targets, here’s what we can look forward to:
A) $1 * 9.41% = Approximately $1.10
B) $5.5 * 9.41% = Roughly $6
C) $6.4 * 9.41% = About $7
Lower Price Targets
Egrag’s analysis is based on several Fibonacci levels and shows potential resistance points. These are the Fibonacci 0.5 ($0.7528), 0.618 ($0.9442), 0.702 ($1.1095), 0.786 ($1.3038), 1 ($1.9664), and the Fibonacci extension levels at 1.272 ($3.3153), 1.414 ($4.3546), and 1.618 ($6.4420).
Overall, the analysis suggests that XRP’s upward momentum is likely to continue and build on its recent successes. The recent rise in price above the analyst’s lower target suggests robust upside sentiment in the market. However, investors should remain keenly aware of the crypto market’s inherent unpredictable nature and exercise due diligence at all times.
Egrag ended his tweet on an encouraging note for the community, “XRP Army STAY STEADY, We’re advancing step by step towards our exciting targets.”
At press time, XRP traded at $0.5291.
Featured image from Shutterstock, chart from TradingView.com
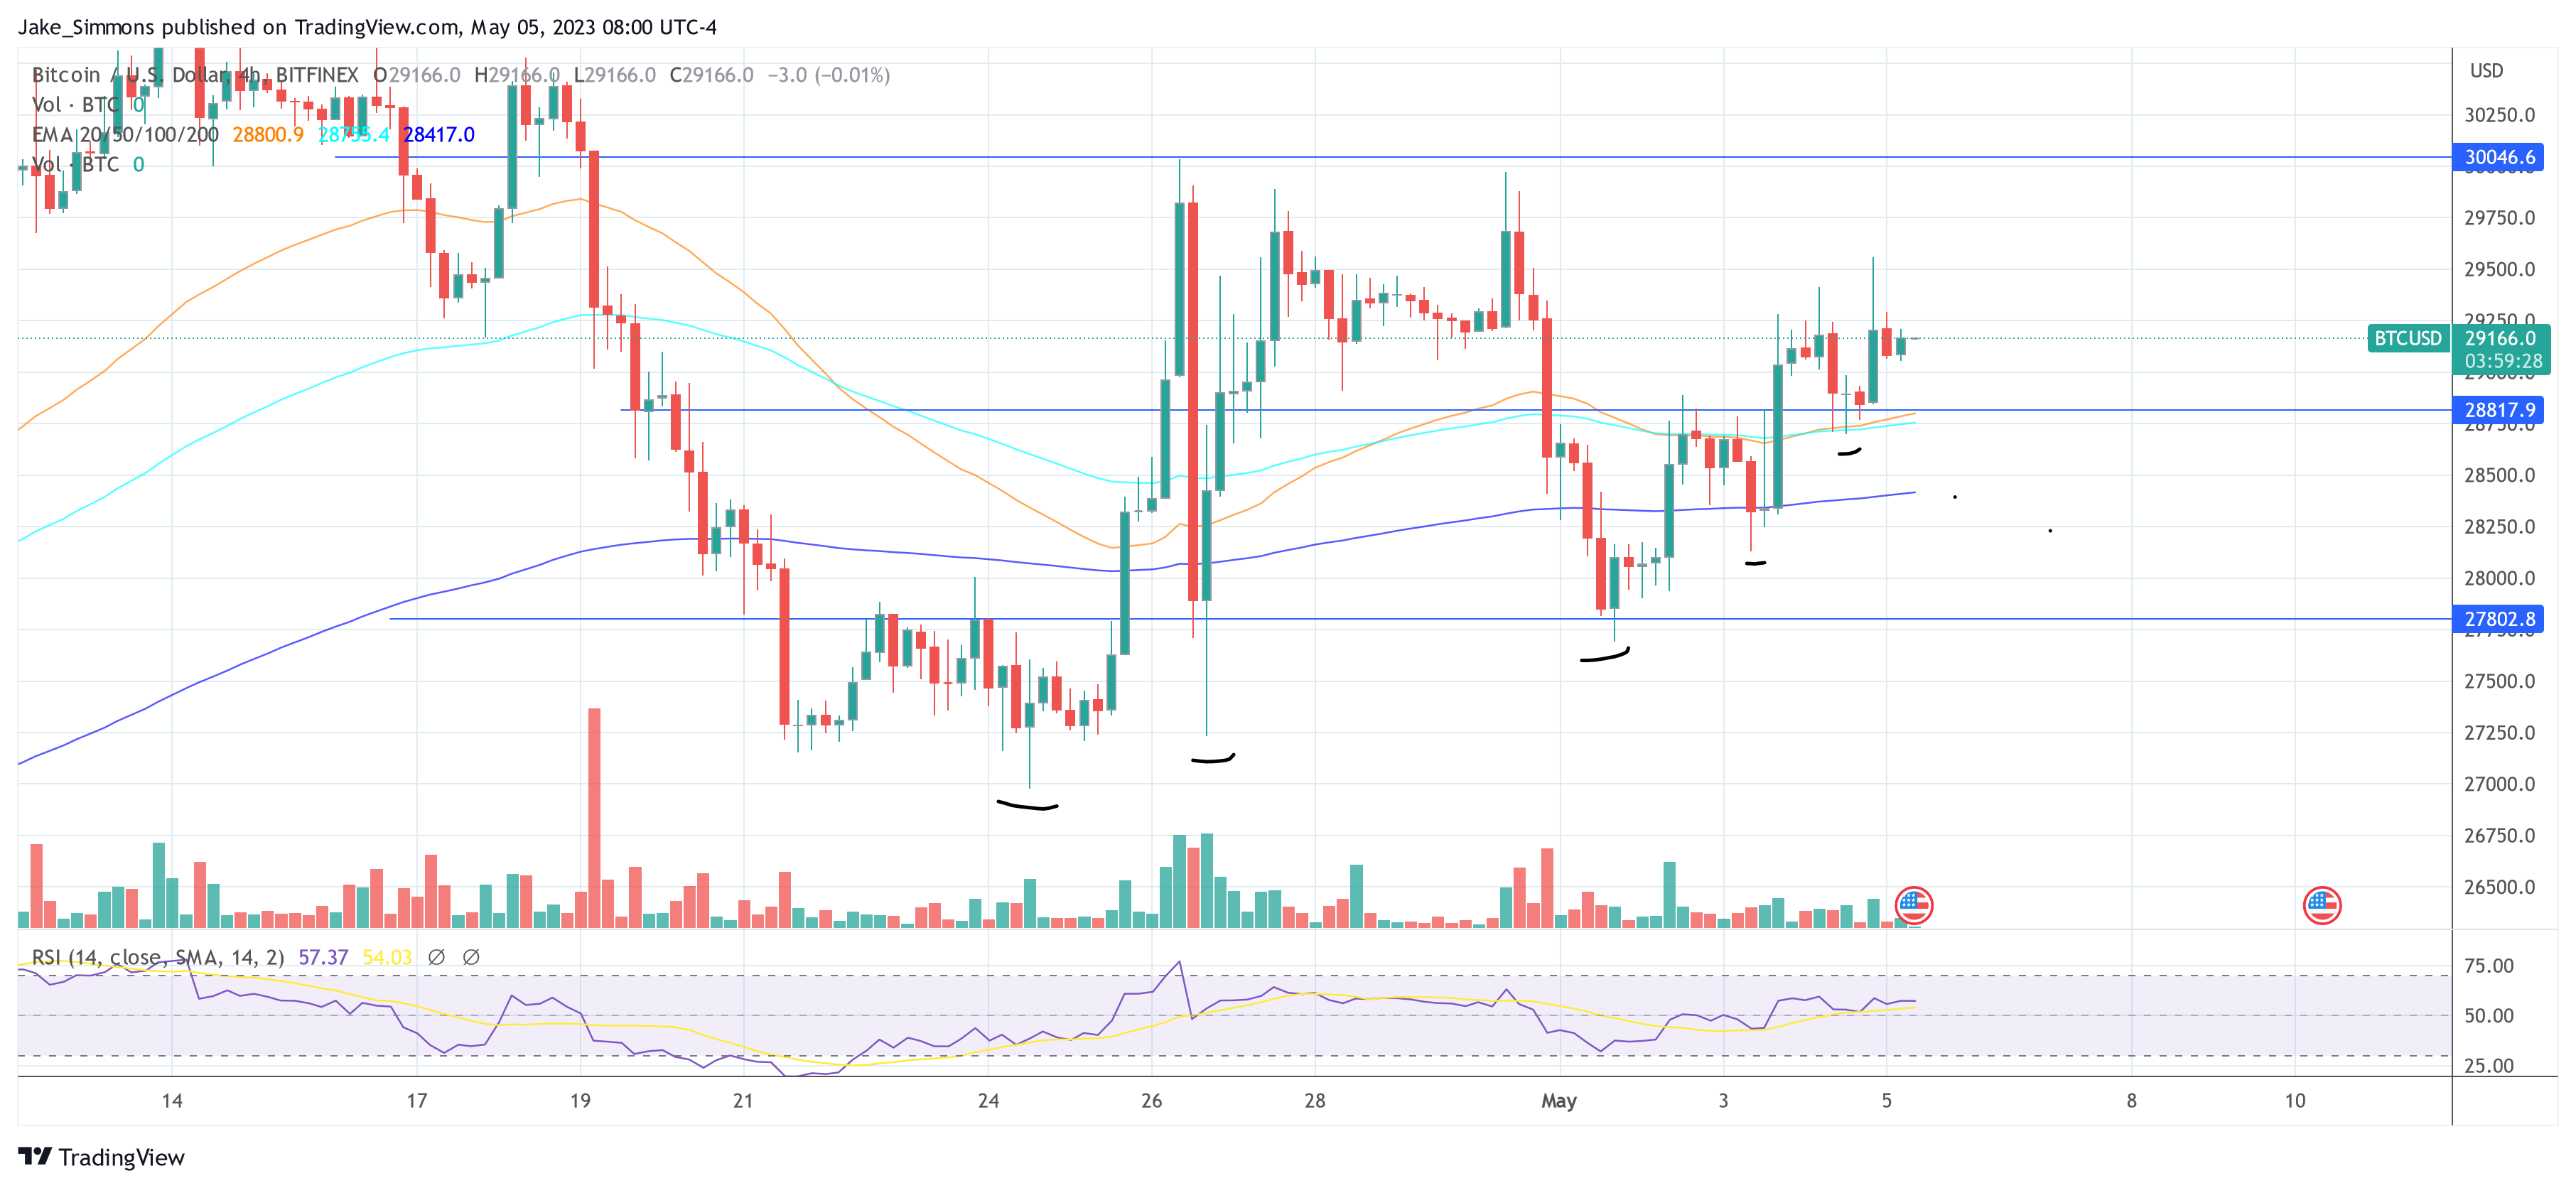
The Bitcoin price continues to consolidate within the trading range between $27,800 and $30,000. Even though the buy side currently seems to have lost momentum and the bears feel in control, there are numerous good arguments why the Bitcoin price will write new yearly highs in the short and medium term.
4-Hour Chart Of Bitcoin
A look at the 4-hour chart of Bitcoin shows that the price has been writing higher lows since the price reached a low of $27,000 on April 24. A higher low occurs when the price hits a new low that is higher than the previous low, without a lower low preceding it.
Thus, the current price movement of BTC indicates an uptrend. The $30,000 level should be the next target as long as BTC stays above $28,800.
US Banking Crisis
Another driver for the Bitcoin price in the short and medium term can be the ongoing US banking crisis. The last few weeks have shown that BTC has reacted strongly to the news, and for the most part has seen a rise. Ultimately, Bitcoin was created for this very purpose: an escape from the fractional reserve banking system.
Because of this, it is also not surprising that Bitcoin has seen its highest correlation with gold in two years. Physical gold has written new all-time highs in recent days, Bitcoin could be spurred by this.
The lead economist at $646 billion asset manager AllianceBernstein, Jared Bernstein, recently acknowledged that Bitcoin will establish itself as an alternative financial system in times of bank failure, and urged people to buy Bitcoin.
Bernstein predicted that the U.S. banking crisis is “far from over,” adding, “We believe Bitcoin will emerge again as a faster horse than gold.”
FED’s Interest Rate Pause In June?
Even though the financial markets initially gave a bearish reaction to the FOMC press conference on Wednesday, the market does not believe that the U.S. Federal Reserve (Fed) will raise interest rates again in June. Effectively, the market is expecting a pivot, meaning an initial pause in rate hikes on June 14.
The CME’s FedWatch tool shows that an overwhelming majority of 99.1% currently expect a pause in interest rates in June. More than 85% expect the first rate cut as early as September and at least three rate cuts by the end of the year.
And even JP Morgan’s Davis believes that “this is definitely the end of the rate hike cycle for the Fed” and a Fed pivot could come “as early as September.” Due to the credit crunch and banking woes, the Fed will be forced to pump liquidity into the market prematurely, BTC will benefit greatly.
Bitcoin Will Rise If History Repeats Itself
As the analysts at Rekt Capital write, the Bitcoin price is currently in a similar consolidation phase as it was in 2019. If history repeats itself, BTC is yet to see its biggest gains in the coming months.
#BTC 2019 vs 2023
Different or similar?$BTC #Crypto #Bitcoin pic.twitter.com/8CCmz224av
— Rekt Capital (@rektcapital) May 5, 2023
Featured image from iStock, chart from TradingView.com
On-chain data shows that Bitcoin “mid-term” holders have been on the move during the past day, suggesting that they may be dumping currently.
Bitcoin 3-6 Months Age Band Shows Large Spike In Spent Outputs
As pointed out by an analyst in a CryptoQuant post, an increase in the spent outputs for the 3-6 months group has resulted in big moves for BTC before. The relevant indicator here is the “Spent Output Age Bands,” which tells us which age bands in the Bitcoin market are moving how many coins right now.
These “age bands” are groups that define ranges between which the coins (or holders) falling into said band last showed any movement or selling. For instance, the “1m-3m” age band includes all tokens that have been sitting dormant since at least 1 month and at most 3 months ago. If holders belonging to this group shift their coins, then the move will show up as a spike on the spent outputs chart for the band.
In the context of the current topic, the relevant age band is the “3m-6m” group. Here is a chart that shows the trend in the spent output metric for it during the last few years:
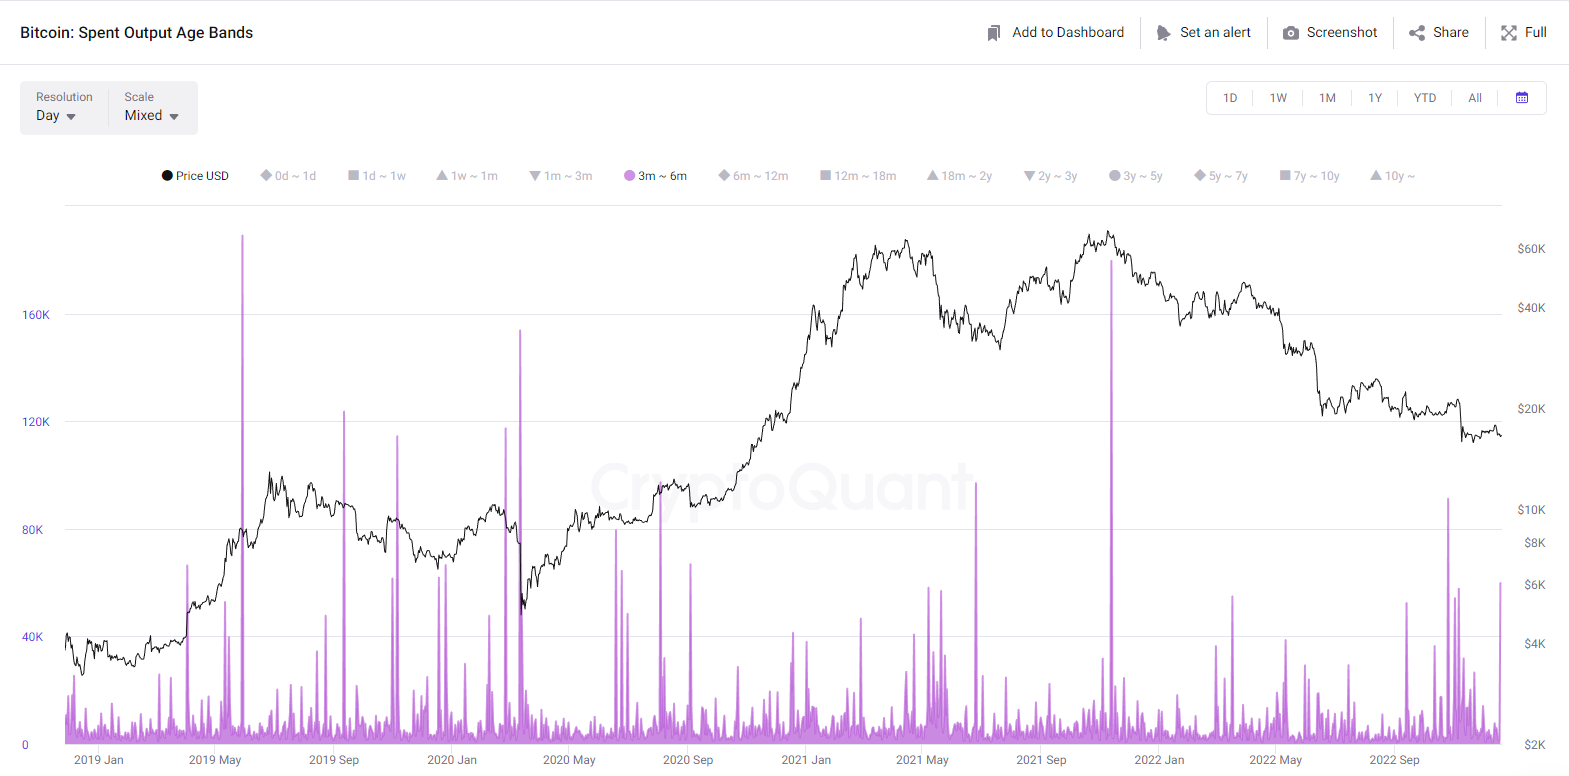
The value of the metric seems to have shot up during the last day | Source: CryptoQuant
As the above graph displays, the spent output metric has recorded a large value for the 3m-6m Bitcoin age band recently. The holders belonging to this group are sometimes referred to as the “mid-term holders,” because of the fact that their range covers the boundary between the short-term holder and the long-term holder cohorts.
From the chart, it’s apparent that generally whenever this holder group has shown signs of heavy dumping, the price of BTC has observed a steep decline shortly after. The latest crash following the collapse of FTX, too, was preceded by a large movement from these investors.
After the current spike, Bitcoin has actually already seen a short-term drop, as the below chart shows. However, it’s unclear at the moment whether this decline was all there is going to be. If past examples are anything to go by, Bitcoin usually observes a large move whenever this trend forms, which implies the real decline from the latest spike may be yet to come.
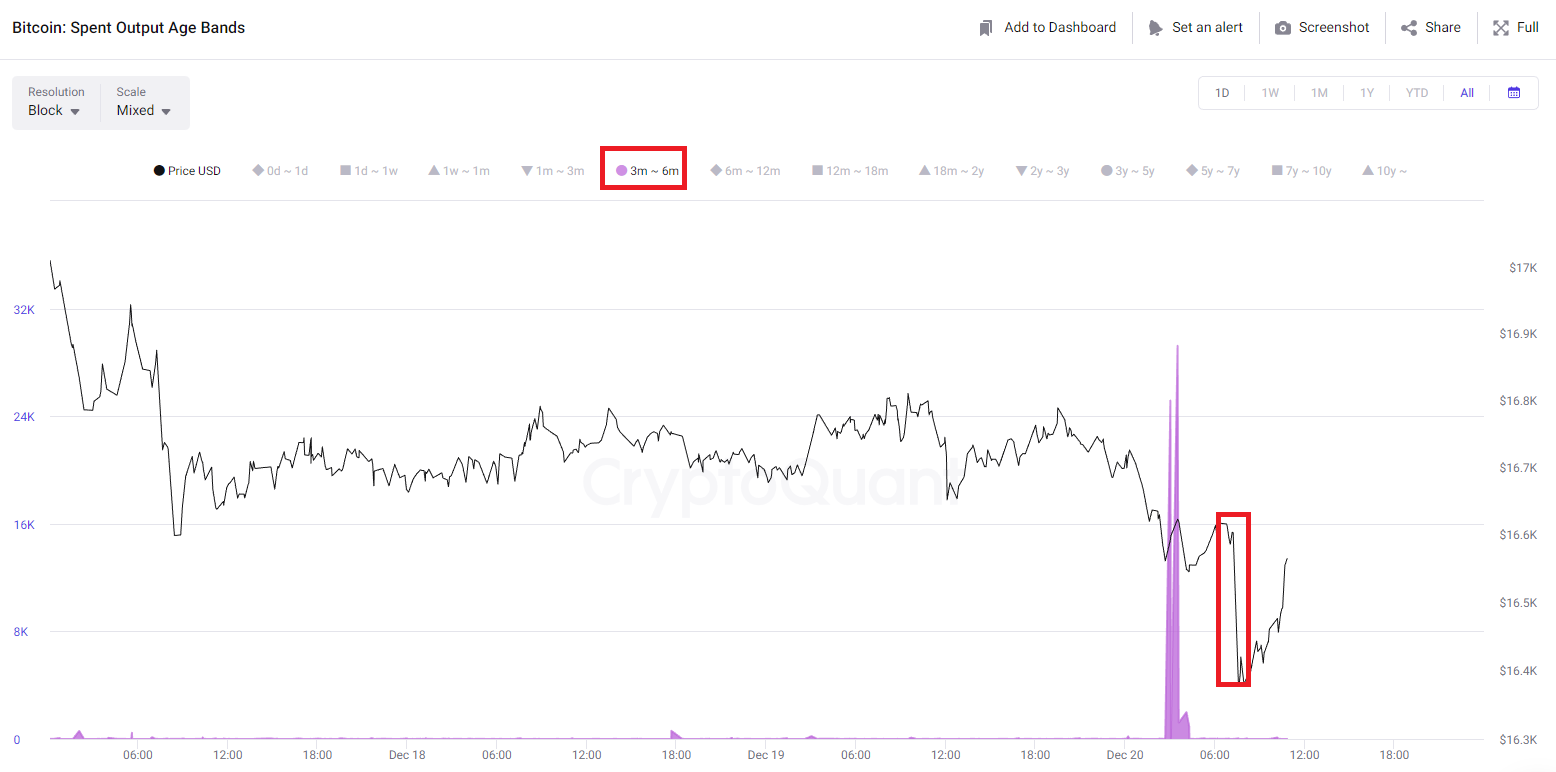
A closer look at the price trend following the spike in the indicator | Source: CryptoQuant
BTC Price
At the time of writing, Bitcoin’s price floats around $16.8k, down 3% in the last week.

Looks like the value of the crypto has been moving sideways since the plunge a few days back | Source: BTCUSD on TradingView
Featured image from mana5280 on Unsplash.com, charts from TradingView.com, CryptoQuant.com