
On-chain data shows non-empty addresses on the Ethereum network have set a new record of 175.5 million, the highest among all digital assets.
Ethereum Has Seen A New Record In Total Amount Of Holders
According to data from on-chain analytics firm Santiment, the Total Amount of Holders has hit a new milestone for Ethereum recently. This indicator tracks the total number of wallets on the network carrying a non-zero balance. When the value of this metric rises, it means new users are joining the network, and/or old users who had sold earlier are investing back into the asset.
The trend can also arise due to existing users distributing their holdings across multiple wallets. In general, all three of these can be assumed to simultaneously be at play to some degree, meaning that whenever the Total Amount of Holders goes up, some net adoption of the network is taking place.
On the other hand, the indicator witnessing a decline suggests some investors are clearing out their wallets, potentially because they have decided to exit from the cryptocurrency.
Now, here is the chart shared by Santiment that shows the trend in the Ethereum Total Amount of Holders over the last few months:

The growth in the metric seems to have accelerated in recent weeks | Source: Santiment on X
As displayed in the above graph, the Ethereum Total Amount of Holders was rising during the second half of 2025, but since mid-December, growth in the indicator has gone up a gear. In January alone, 5.16 million more addresses have joined the network, representing a jump of 3.03%. The metric’s value is now at 175.5 million, a new all-time high for ETH and a record among all digital assets.
Growth in the Total Amount of Holders isn’t the only on-chain development that Ethereum has observed recently. In the same chart, the analytics firm has also attached the data for another indicator: the Supply on Exchanges. This metric measures the total amount of ETH that’s currently sitting in wallets associated with centralized exchanges.
From the graph, it’s visible that the Ethereum Supply on Exchanges has continued to go down, a sign that investors have been taking their Ethereum off these platforms. The push toward exchange withdrawals has come as staking interest has been rising on the network.
“As staking continues to be of strong interest, especially while markets move sideways, exchange supply will continue to shrink as well,” explained Santiment.
ETH Price
Ethereum has been making its way back up since its Sunday low under $2,800, as the asset’s price is now back above $3,000.
The trend in the price of the coin over the last five days | Source: ETHUSDT on TradingView
Featured image from Dall-E, chart from TradingView.com
Editorial Process for bitcoinist is centered on delivering thoroughly researched, accurate, and unbiased content. We uphold strict sourcing standards, and each page undergoes diligent review by our team of top technology experts and seasoned editors. This process ensures the integrity, relevance, and value of our content for our readers.
Dogecoin Adoption: Holders Cross 8.1 Mil, Ahead Of XRP & ADA Bitcoinist.com
Source link ]]>
Ethereum has witnessed a drop towards the $2,350 level as on-chain data reveals the whales have been making large exchange inflows recently.
Ethereum Exchange Netflows Have Been Positive Recently
According to data from the market intelligence platform IntoTheBlock, the ETH Exchange Netflow has been positive recently. The “Exchange Netflow” here refers to an on-chain indicator that keeps track of the net amount of Ethereum that’s flowing into or out of the wallets connected to centralized exchanges.
When the value of this metric is positive, it means the investors are depositing a net number of tokens into these platforms. As one of the main reasons holders may transfer their coins to the exchanges is for selling-related purposes, this trend can be bearish for the asset’s price.
On the other hand, the negative indicator implies that a net amount of BTC is being transferred from exchange-related addresses. Such a trend implies the investors may be planning to hold into the long-term, which can naturally be bullish for the cryptocurrency.
Now, here is a chart that shows the trend in the Ethereum Exchange Netflow over the past month:
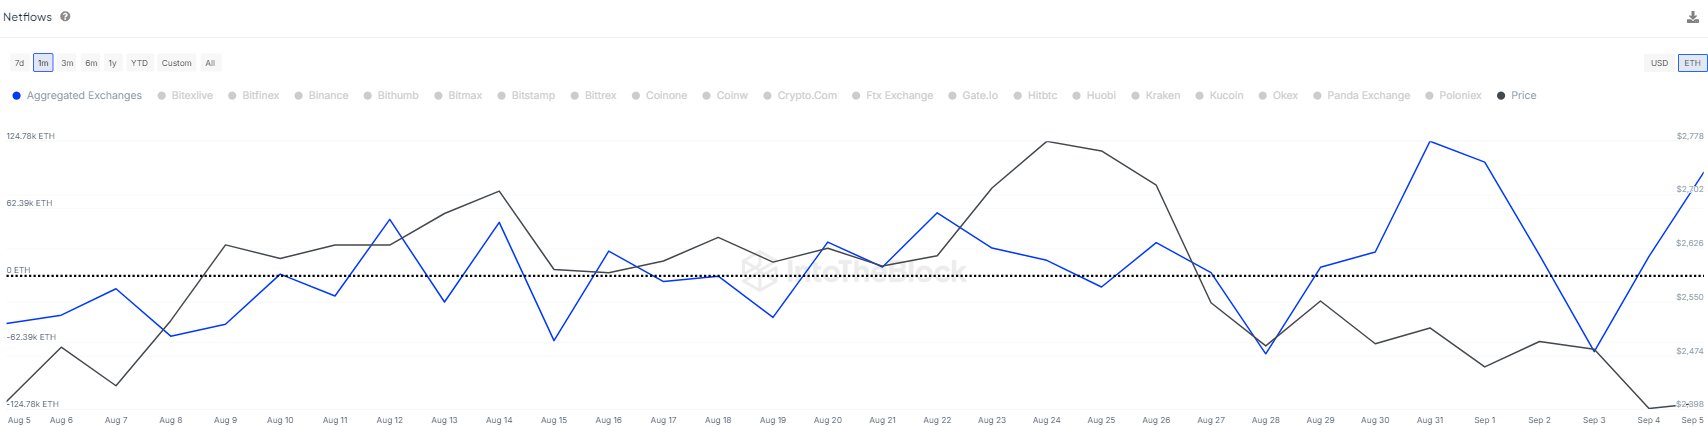
Looks like the metric has seen positive spikes recently | Source: IntoTheBlock on X
As displayed in the above graph, the Ethereum Exchange Netflow has observed a couple of spikes into the positive territory recently, suggesting some large net deposits into the exchanges have occurred.
The investors have transferred 312,183 ETH to these platforms during the past week, worth around $745 million at the current exchange rate. Given the massive scale involved here, it’s likely that whale entities were behind these inflows.
These humongous investors may have sold as the motive behind these large transactions. Something that could add credibility to this is that the Ethereum price has gone downhill in this period, now slipping under the $2,400 level.
Even before these latest deposits, the exchanges had received net inflows throughout the past month, although their scale was not quite as big. Thus, the Ethereum market has been under pressure for a while now.
The Exchange Netflow could be to keep an eye on in the coming days, as any further inflow spikes could suggest more bearish price action for Ethereum, considering the trend that has followed recently.
ETH Price
Much like Bitcoin and other assets, Ethereum has been going through a bad time recently, with its price gradually heading in a bearish trajectory. After registering another decline of more than 6% over the past week, ETH has dropped to around $2,350.
The chart below shows what cryptocurrency’s performance has looked like over the last few months.
The price of the coin appears to have been sliding over the last few months | Source: ETHUSD on TradingView
Featured image from Dall-E, IntoTheBlock.com, chart from TradingView.com
O preço do Dogecoin (DOGE) tem um bom desempenho enquanto o Ethereum se aproxima de US$ 2 mil SpaceMoney
Source link ]]>
Up And Up This Uptober: Bitcoin Jumps To $20,000, Dogecoin Increases By 14%, And Big Eyes Coin Nearly Raises $9 Mil Analytics Insight
Source link ]]>