A crypto analyst has made a bold projection, suggesting the Ethereum price could reach a staggering $10,000. According to him, this is the minimum level that ETH could read, underscoring his confidence in the cryptocurrency’s bullish outlook. The analyst has cited strong fundamental and technical indicators that support his optimistic prediction.
Current sentiment surrounding Ethereum is unclear, with its Fear and Greed Index in the neutral range, even while volatility remains in the fear zone. This mixed market reaction comes as the cryptocurrency has been facing bearish headwinds, even as it remains resilient and holds above the $2,000 level.
Why The Ethereum Price Could Hit $10,000
Notably, crypto analyst Sykodelic on X has emphasized how strong Ethereum’s fundamentals and structure are, even amid market volatility and shifting sentiment. He has disclosed his strong bullish stance on ETH’s price outlook, forecasting that the cryptocurrency could hit $10,000 at a minimum.
Related Reading: Ethereum Price Crash Update: Analyst Forecasts Fall To $600 If This Happens
Supporting his bold projection, Sykodelic explained that for the past five years, the Ethereum price has been moving sideways in a High Time Frame (HTF) range. He noted this long-term horizontal range has built a very strong base, and now ETH is showing clear signs of a breakout that could fuel a powerful upward move to new all-time highs.

The analyst cited reasons for his optimistic outlook, noting that the stronger and longer the base, the bigger the breakout potential. He stated that, at present, Ethereum has one of the largest bases of any digital asset in the world.
He also highlighted technical indicators that support his bullish forecast. Looking at his accompanying chart, Sykodelic noted that Ethereum’s one-month Relative Strength Index (RSI) has reached historically low levels that have marked major price reversals in the past. He said Ethereum is currently at the bottom of its multi-year channel, suggesting it is consolidating around support and could be poised for a significant price rally.
The analyst has stated that these factors suggest that the potential for gains far outweighs the downside risks for traders positioning for the next breakout. He believes that Ethereum’s next attempt to break out of its current base could be the one that propels its price to $10,000, representing a more than 400% surge from current levels.
Analyst Dismisses $950 Breakdown Target
Following the post, one crypto member forecasted that Ethereum will likely experience another price crash to $950 before it begins its rally to $10,000. Quickly responding, Sykodelic dismissed the bearish forecast, highlighting that there is no basis for expecting such a steep drop in ETH.
Related Reading
He noted that if Ethereum falls to this level, it would mark its lowest-ever monthly RSI reading after its weakest expansion. Given his confidence in Ethereum’s bullish potential, the analyst likely views such a scenario as unrealistic under current market conditions.
Featured image from Freepik, chart from Tradingview.com
Dogecoin Outlook for the Upcoming Altcoin Season: Minimum and Ambitious Price Targets Revealed The Crypto Basic
Source link ]]>
Shiba Inu: price surge with exchange reserves at a minimum? The Cryptonomist
Source link ]]>
New Shiba Inu (SHIB) Price Minimum? Meme Coin Enters 2025 on Bullish Note U.Today
Source link ]]>
$5 is The Minimum Target for the Cardano Price, Dogecoin Price, and the RCOF Rally for this Cycle TronWeekly
Source link ]]>
Henrik Zeberg, a macroeconomist known for his expertise in business cycles, has pinpointed an upcoming rally of at least 60% for the Bitcoin price in his latest technical analysis. The seasoned analyst has identified a pattern across three critical technical indicators that have historically signaled major upward price movements when all aligned.
Bitcoin Price Set For Next Bull Run
Zeberg highlights the Relative Strength Index (RSI), which is traditionally used to assess whether an asset is overbought or oversold. Currently, the RSI is positioned above the 50 mark, which often indicates growing bullish momentum. More importantly, the RSI has broken above a descending trendline that previously capped momentum, a shift that typically precedes robust price increases.
Related Reading
Alongside the RSI, the Moving Average Convergence Divergence (MACD) is showing a bullish crossover. This event occurs when the faster moving MACD line, depicted in blue, crosses above the slower signal line, shown in red. This crossover is a traditional signal used by traders to confirm a potential reversal from bearish to bullish market conditions. Zeberg’s emphasis on this crossover is consistent with its recognized predictive value in signaling the start of a bullish phase.
The third indicator, the Relative Vigor Index (RVGI), is lesser-known but no less critical. This indicator is also experiencing a bullish crossover, marked by the green line overtaking the red line. The RVGI measures the vigor of price movements and its crossover is indicative of a strong bullish undertone.

The chart provided by Zeberg is annotated with several instances where these conditions were met in the past, each followed by significant price rallies. These include surges of +318% in 2019, +824% in 2020, +70% in late 2021, +64% in January 2023, and +176% in the second half of 2023, indicating not just minor increases but substantial bull runs. The historical context adds weight to the current setup, suggesting that a similar outcome may be on the horizon.
Related Reading
Zeberg has pointed out that each time Bitcoin has shown this configuration of technical indicators, it has led to rallies of no less than 60%.” Every time we have seen a confirmation of the three following indicators, BTC has rallied and by minimum 60%,” Zeberg writes.
His confidence in this pattern is evident as he describes the potential for what he calls a “Blow-Off Top,” a term that suggests an intense and rapid increase in price. As reported by NewsBTC, Zeberg forecasts that a US recession is unavoidable, yet it will be preceded by a significant surge in financial markets, which includes a major rally in Bitcoin, potentially reaching between $115,000 and $120,000 in a “Blow-Off Top” scenario.
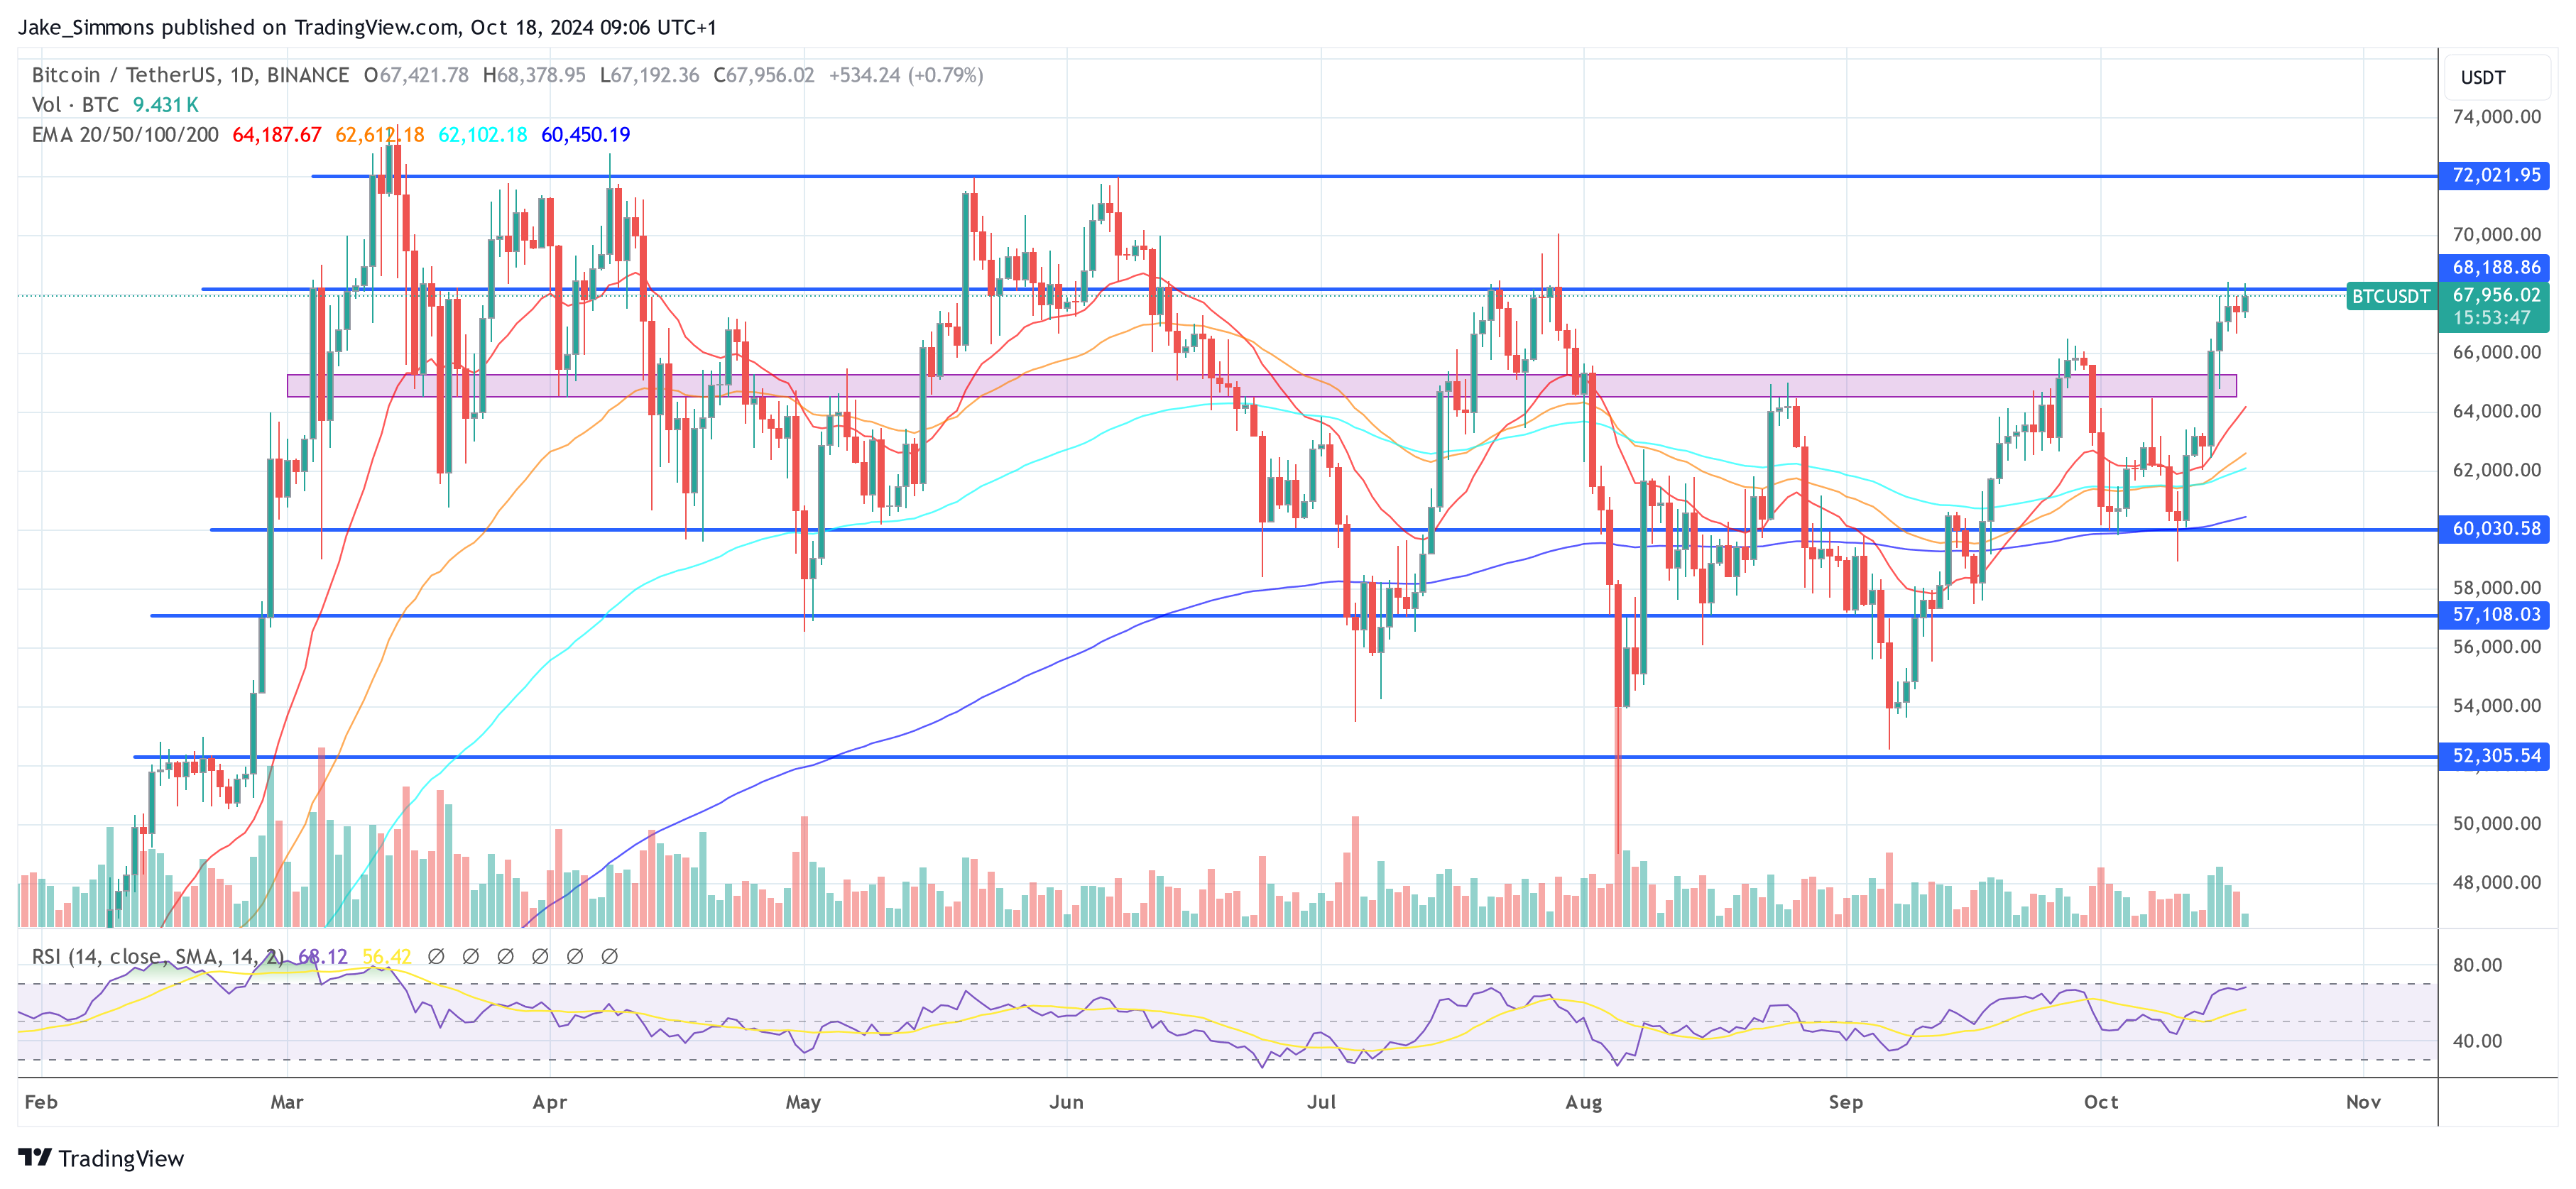
At press time, BTC traded at $67,956.
Featured image created with DALL.E, chart from TradingView.com
Best Memecoins With a Minimum of 10X Returns in 2024: Pepe (PEPE), Dogecoin (DOGE), and NuggetRush (NUGX) Finbold – Finance in Bold
Source link ]]>
ChatGPT Forecasts Shiba Inu Minimum and Maximum Price Targets For Early 2024 The Crypto Basic
Source link ]]>
Dogecoin w tarapatach? Aktywność spada do minimum BeInCrypto Polska
Source link ]]>
Will Dogecoin hit $1 in 2023? Experts believe this DOGE rival will give you a minimum of 20x better returns Analytics Insight
Source link ]]>