Ripple’s token price is consolidating above $0.620 against the US Dollar. XRP price might start a decent increase if there is a clear move above $0.650.
- Ripple’s token price is moving lower from the $0.6650 resistance against the US dollar.
- The price is now trading below $0.65 and the 100 simple moving average (4 hours).
- There is a key bearish trend line forming with resistance near $0.628 on the 4-hour chart of the XRP/USD pair (data source from Kraken).
- The pair might continue to decline if there is no move above $0.63 and $0.65.
Ripple’s Token Price Dips Again
After a recovery wave, Ripple’s XRP struggled to clear the $0.6650 resistance against the US Dollar. A high was formed near $0.6654 before the price started a fresh decline, similar to Bitcoin and Ethereum.
There was a move below the $0.650 pivot level. The price declined below the 50% Fib retracement level of the upward move from the $0.5926 swing low to the $0.6654 high. The price even declined below the $0.635 support zone.
XRP is now trading below $0.65 and the 100 simple moving average (4 hours). There is also a key bearish trend line forming with resistance near $0.628 on the 4-hour chart of the XRP/USD pair.
Initial resistance on the upside is near the $0.628 zone and the trend line. The next major resistance is near the $0.650 level and the 100 simple moving average (4 hours). The main resistance is now forming near the $0.6650 zone.
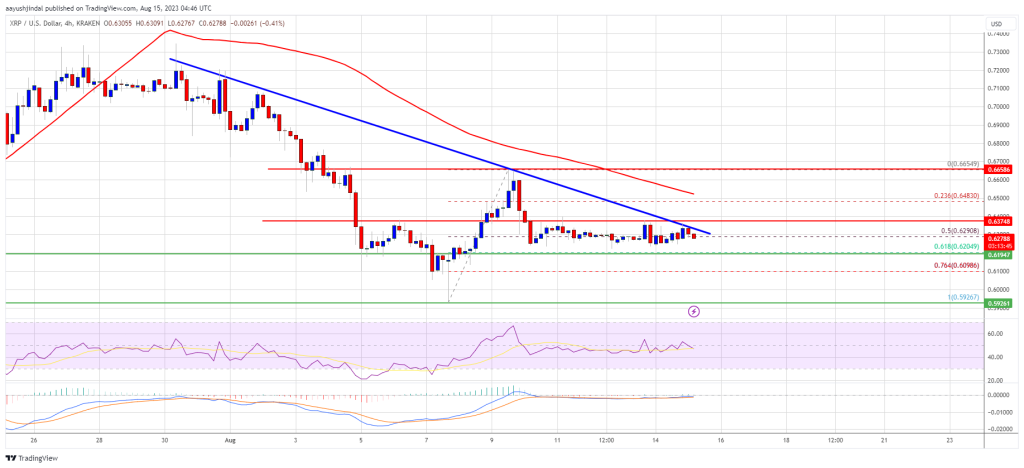
Source: XRPUSD on TradingView.com
A successful break above the $0.6650 resistance level might send the price toward the $0.70 resistance. Any more gains might call for a test of the $0.720 resistance.
More Losses in XRP?
If ripple fails to clear the $0.650 resistance zone, it could start another decline. Initial support on the downside is near the $0.620 zone and the 61.8% Fib retracement level of the upward move from the $0.5926 swing low to the $0.6654 high.
The next major support is near $0.60. If there is a downside break and a close below the $0.60 level, XRP’s price could extend losses. In the stated case, the price could retest the $0.585 support zone.
Technical Indicators
4-Hours MACD – The MACD for XRP/USD is now losing pace in the bearish zone.
4-Hours RSI (Relative Strength Index) – The RSI for XRP/USD is now below the 50 level.
Major Support Levels – $0.62, $0.60, and $0.585.
Major Resistance Levels – $0.628, $0.650, and $0.665.
Bitcoin trimmed gains and declined below $21,000 against the US Dollar. BTC must stay above $20,500 to avoid a major decline in the near term.
- Bitcoin failed to stay above the $21,000 support and extended drop.
- The price is now trading below the $21,500 level and the 100 hourly simple moving average.
- There is a major bullish trend line forming with support near $20,520 on the hourly chart of the BTC/USD pair (data feed from Kraken).
- The pair could start another major decline if there is a clear move below $20,500.
Bitcoin Price Reaches Support
Bitcoin price attempted a close above the $22,000 level, but the bears remained active. As a result, there was a slow and steady decline below the $21,500 level.
The price declined below the 50% Fib retracement level of the upward move from the $19,300 swing low to $22,498 high. The price is now trading below the $21,500 level and the 100 hourly simple moving average.
It is testing the key $20,500 support zone. There is also a major bullish trend line forming with support near $20,520 on the hourly chart of the BTC/USD pair. The trend line is near the 61.8% Fib retracement level of the upward move from the $19,300 swing low to $22,498 high.
If bitcoin price stays above the trend line, it could correct above $20,800. On the upside, the price is facing resistance near the $20,800 and $20,850 levels.
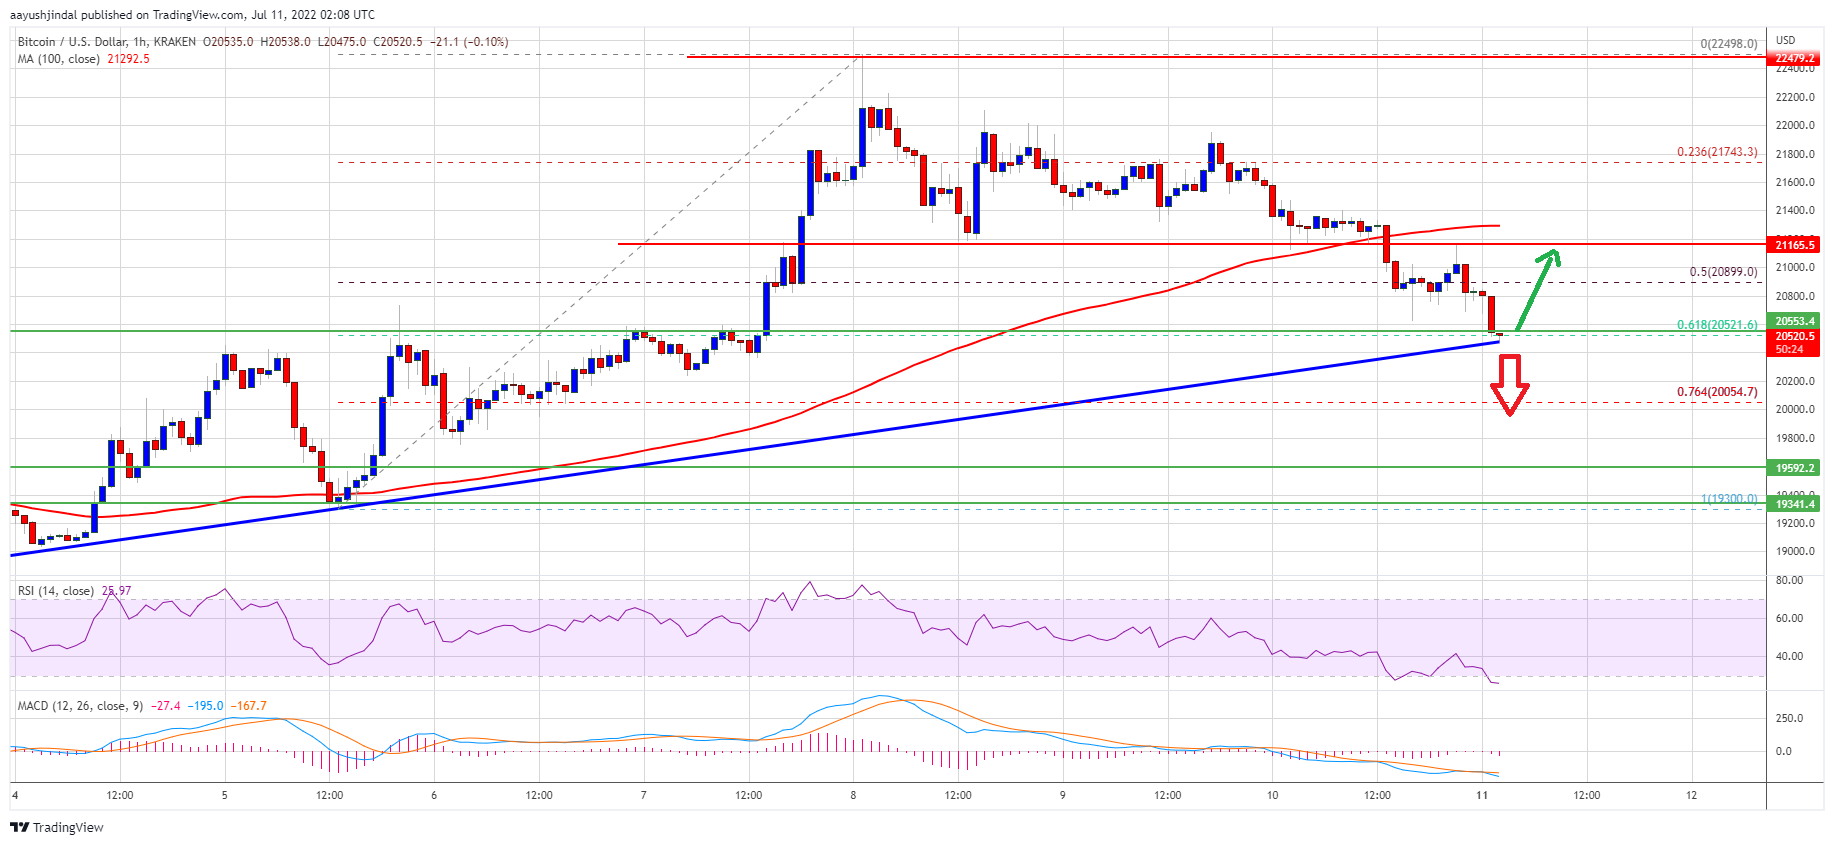
Source: BTCUSD on TradingView.com
The next key resistance is near the $21,250 zone and the 100 hourly simple moving average. A close above the $21,250 resistance zone could set the pace for a test of the $22,000 level. Any more gains might open the doors for an increase towards the $22,500 level. The next major resistance sits near the $23,200 level.
Downside Break in BTC?
If bitcoin fails to stay above the trend line support, it could continue to move down below $20,500. An immediate support on the downside is near the $20,050 level.
The next major support now sits near the $19,600 level or the last swing low. A close below the $19,600 support zone could push the price to $19,000. In the stated case, there is a risk of a move towards the $18,500 level.
Technical indicators:
Hourly MACD – The MACD is now gaining pace in the bearish zone.
Hourly RSI (Relative Strength Index) – The RSI for BTC/USD is now in the oversold zone.
Major Support Levels – $20,500, followed by $20,000.
Major Resistance Levels – $20,800, $21,250 and $22,000.
It has already been 240 days of a continuous downtrend for ADA, and it’s not over yet. Despite that ADA formed a promising market structure in March, April’s monthly candle so far is showing a 35% drop.
Technical Analysis
Technical Analysis By Grizzly
The Daily Chart
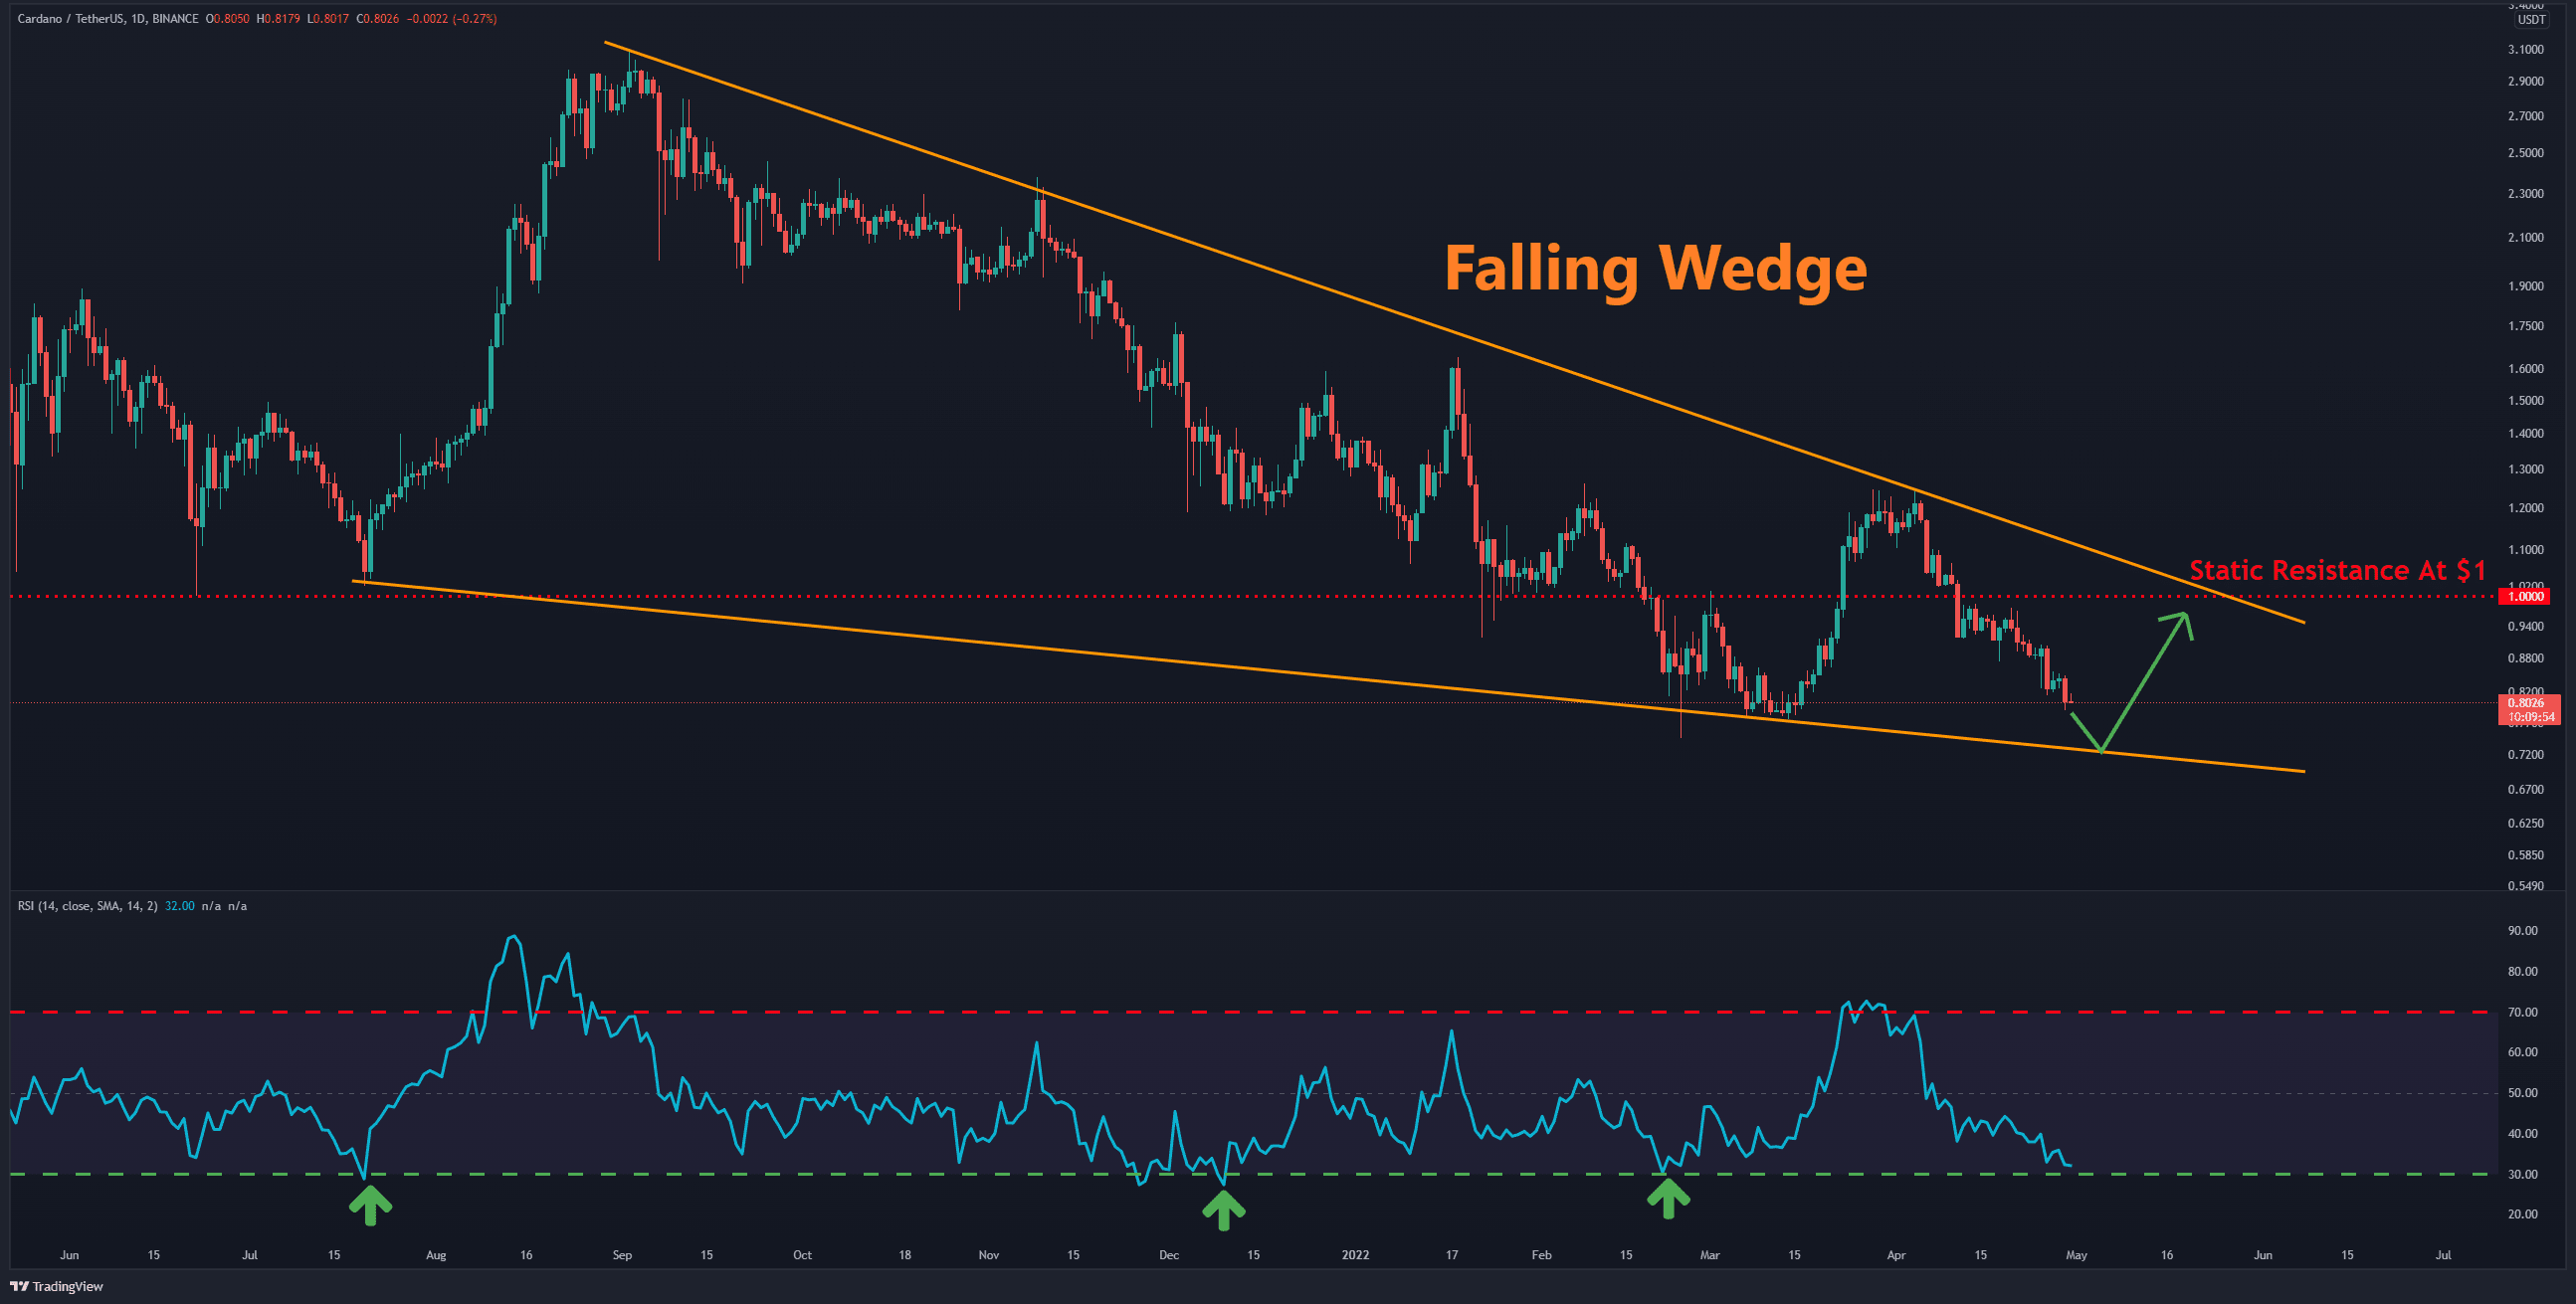
Cardano (ADA) is trading inside a falling wedge (marked orange) on the daily timeframe, which is technically a reversal pattern. Also, the RSI indicator has also reached a level at which the price has started to rise in the previous times after touching that.
By hitting the wedge’s bottom, the RSI indicator will also enter the oversold area, and a possible correction leg towards resistance at $1 could take place.
A bullish scenario is valid if support at $0.7 can prevent a further price drop. Otherwise, the newly formed trend must be re-tested by forming a lower low. Furthermore, breaking the challenging resistance in the $1-$1.25 can be considered the end of the months-long downtrend.
Moving Averages:
MA20: $0.90
MA50: $0.97
MA100: $0.98
MA200: $1.31
The 4-Hour Chart
On the 4-hour timeframe, the price is moving down inside a falling wedge just like seen on the daily chart. Horizontal support at $0.8 is a key level, and if the price finds support – a double bottom can be formed. Since both of these patterns are technically bullish, it remains whether the bulls can hold this level again.

Short-term Support Levels: $0.8 & $0.75
Short-term Resistance Levels: $0.85 & $0.88
Binance Free $100 (Exclusive): Use this link to register and receive $100 free and 10% off fees on Binance Futures first month (terms).
PrimeXBT Special Offer: Use this link to register & enter POTATO50 code to receive up to $7,000 on your deposits.
Disclaimer: Information found on CryptoPotato is those of writers quoted. It does not represent the opinions of CryptoPotato on whether to buy, sell, or hold any investments. You are advised to conduct your own research before making any investment decisions. Use provided information at your own risk. See Disclaimer for more information.
Cryptocurrency charts by TradingView.