Following a period of intense volatility and a significant price movement, Bitcoin’s market is now experiencing a predictable consolidation phase, characterized by what traders call intraday chop. This is not a sign of weakness but rather a natural and often necessary stage in any market cycle.
A Necessary Foundation For The Next Move
In an X post, a dedicated crypto enthusiast, Uniswap Gems, provided a clear-eyed view of Bitcoin’s current price action, stating that the market is in a predictable phase of intraday chop after a period of extreme volatility.
Uniswap Gems noted that the recent huge, volatile move caught many traders off guard. As a result, the market is now in a period of consolidation. This chop is a sideways price movement within a tight range, which is often needed to establish a solid bottom after a sharp price swing. He cautions that this phase could last for the next 2 to 3 days, making it a difficult environment for those looking for quick directional trades.
For a bullish trend to resume, BTC needs to flip $113,000 into a support level. If this happens, it could set the stage for a retest of the $115,000 range. However, if BTC fails to hold its current levels and makes new local lows, Uniswap Gems expects a more significant drop all the way down to sub $105,000, which would be a decisive move to the downside.
Analyst Philakone, a crypto investor and day trader, has issued a stark reminder about the inherent volatility of BTC and historical price action in bear markets. His analysis focuses on the severe drawdowns that have consistently followed previous all-time highs.
According to Philakone, BTC price has a historical tendency to drop between 75% to 85% from its peak during a bear market. This is a crucial point that he believes many people struggle to grasp, especially after a prolonged bull run. However, if BTC’s all-time high for the current cycle reaches $125,000, a 75% drop would bring the price down to a mere $30,000.
Market Still Fragile Despite Heavy Liquidations
Crypto trader known as KillaXBT has adopted a highly cautious stance on the BTC market. For the first time in a while, the expert is fading this BTC dip despite a massive liquidation event of 1.5 billion. His decision is based on a technical analysis of a key market indicator of the USDT dominance chart.
KillaXBT explains that the USDT.D (Tether Dominance) chart is showing concerning signals. If it breaks above its Equal Highs (EQHs), it could lead to a bigger drop in price. Due to this analysis, he has decided not to open any position in the market and is not looking for either long or short trades.
]]>XRP: Mini Death Cross Surprise, Shiba Inu (SHIB): It’s Not Normal, Bitcoin (BTC): Fundamental Breakout Secured TradingView
Source link ]]>
XRP: Mini Death Cross Surprise, Shiba Inu (SHIB): It’s Not Normal, Bitcoin (BTC): Fundamental Breakout Secured U.Today
Source link ]]>
Reason to trust
![]()
Strict editorial policy that focuses on accuracy, relevance, and impartiality
Created by industry experts and meticulously reviewed
The highest standards in reporting and publishing
Strict editorial policy that focuses on accuracy, relevance, and impartiality
Morbi pretium leo et nisl aliquam mollis. Quisque arcu lorem, ultricies quis pellentesque nec, ullamcorper eu odio.
Bitcoin (BTC) is showing signs of repeating a historic Golden Cross pattern that led to a long-term parabolic run. While the cryptocurrency’s recent pullback near the $100,000 region may have alarmed the crypto market, analysts suggest that this move is part of a broader trend that could push BTC to its next price high.
Golden Cross Formation Pits Bitcoin At $150,000
Bitcoin has once again flashed a classic bullish signal, the Golden Cross, prompting renewed optimism for a major price rally in the coming months. According to a technical analysis by ‘Chain Mind,’ a crypto analyst on X (formerly Twitter), Bitcoin may be on the verge of an explosive surge to $150,000 if this historical pattern plays out as expected.
Related Reading
The last time BTC formed this pattern was in November 2024. Immediately after the cross’s completion, Bitcoin’s price experienced a 10% correction, followed by a sharp 62% rally over the next several weeks. This behavior established a clear trend of a short-term shake-out preceding a strong bullish continuation.
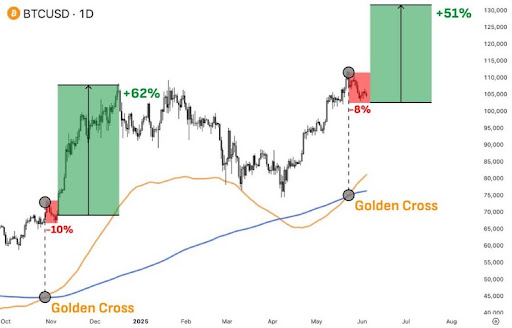
Now, in early June 2025, Bitcoin has printed another Golden Cross on its chart, and so far, price action appears to be closely mirroring the one from the previous year. Notably, Bitcoin has dropped 8%, suggesting a smaller but comparable corrective phase to the one observed in 2024. Technical projections from Chain Minds now show a possible 51% rally on the horizon from the post-correction bottom. This would potentially place Bitcoin in the $150,000 range by the end of 2025.
Notably, Chain Mind’s analysis identifies Bitcoin’s recent crash toward the $100,000 region as a potential local bottom, with the Golden Cross acting as the catalyst for the next leg of the bull run. If the current historical pattern holds, Bitcoin may be entering a sustained period of upward movement to new all-time highs. With the cryptocurrency already recovering from the brief downturn and now trading at $105,050, a 51% increase would potentially place its price at approximately $158,625 once the historical Golden Cross pattern is fully completed.
Bitcoin Uptrend At Risk If $100,000 Level Is Lost
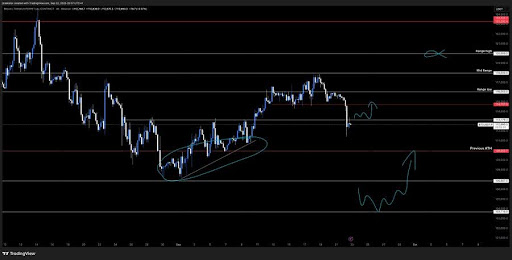
Despite the broader bullish sentiment surrounding Bitcoin, its price is currently navigating a critical trading range between $100,000 and $112,049, which analysts suggest is crucial for maintaining its current optimistic outlook. Crypto Fella, the market expert responsible for this analysis, has shown via a chart that BTC is consolidating within a rectangular band, reflecting a pause in momentum after a sharp upward move earlier in the quarter.
Related Reading
The crypto analyst has boldly asserted that as long as Bitcoin continues to trade within the range above, there should be little cause for concern for another major crash. However, if the $100,000 mark fails to hold, the next likely target for downside movement is between $97,000 and $95,000, representing a 9.56% and 7.66% decline from current levels, respectively.
Featured image from Getty Images, chart from Tradingview.com
Bitcoin has had an interesting run so far in 2025, embarking on exciting upside rallies and enduring deep corrections in the space of a few months. The latest upward movement suggests the return of interest and confidence in the world’s largest cryptocurrency.
After surpassing its previous all-time high price this week, the Bitcoin price has printed a new high of $111,814 — reached on Thursday, May 22. A fresh all-time-high price is often followed by a major correction, as investors are typically inclined to take profits.
However, recent on-chain revelation suggests this Bitcoin bull run might be here to stay — and maybe for a longer period than expected.
Analyst Says Realized Profits Yet To Signal Market Top
In a May 23 post on social media platform X, on-chain crypto analyst Darkfost revealed that the net realized profits by Bitcoin investors remain normal for a bull phase. The relevant indicator backing this assertion is the Net Realized Profit/Loss metric, which measures the net profit or loss (in USD) of all coins spent on the network over a specific timeframe.
This on-chain metric is calculated by finding the difference between the realized profit and realized loss of crypto investors. Positive values from the metric indicate that coins are being spent at a higher price than they were acquired, resulting in a net profit.
On the other hand, negative values indicate that coins are being spent at prices lower than they were bought, resulting in a net loss. Neutral values simply suggest that coins are being spent close to their acquisition price.
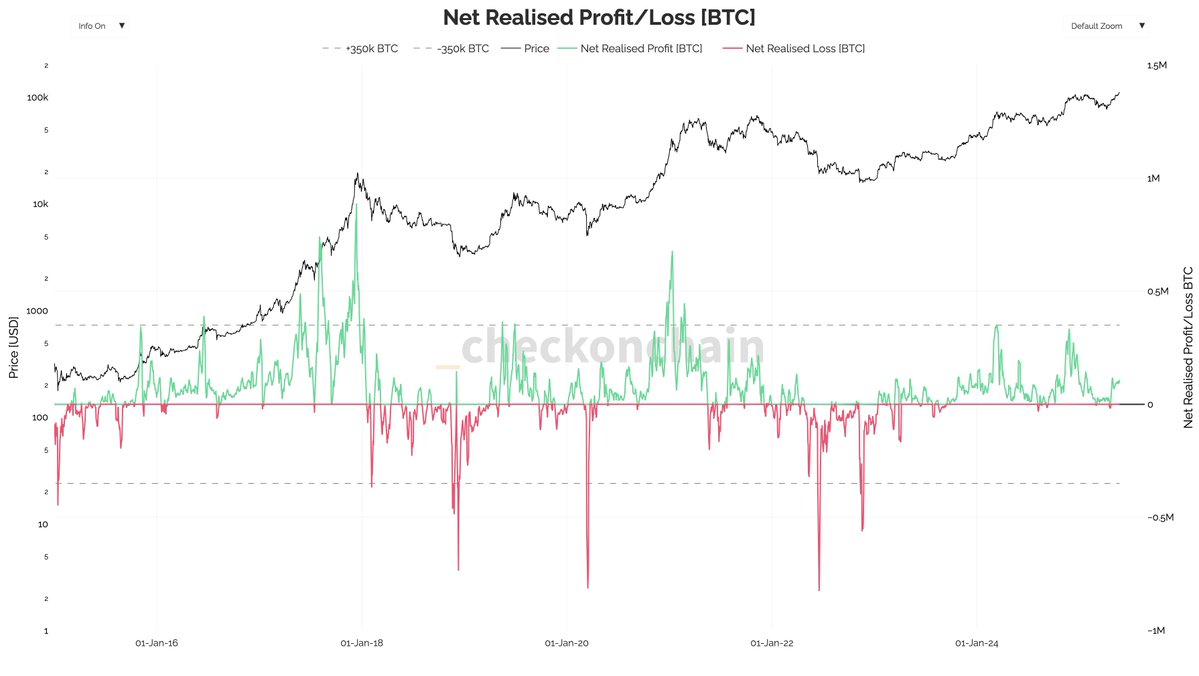
According to on-chain data shared by Darkfost, realized profits are currently at a high level of about 104,000 BTC (a rough equivalent of $11 billion). The analyst, however, pointed out that while this figure is substantial, it still falls short of the 350,000 BTC threshold level (a level which has historically signaled potential tops and preceded major correctional movements of Bitcoin).
Darkfost inferred from the highlighted data that the net realized profit for a Bitcoin bull phase is currently at a normal level. The analyst noted the necessity of profit-taking in a bull market, implicitly preaching against fear amongst investors.
Darkfost said about profit-taking:
It’s what keeps investors engaged in the market and helps sustain the bullish momentum.
Bitcoin Price At A Glance
As of this writing, Bitcoin is valued at around $108,360, reflecting a more than 2% decline in the past 24 hours.
]]>Shiba Inu Network Activity ‘Much Higher Than Normal Rate’—Here’s Why It Signals a Bullish Future The Shib Daily
Source link ]]>
Crypto Market Crash: The recent decline in the digital asset sector today reflects the waning optimism in the financial market. The recent cooling of U.S. CPI inflation data has fueled market sentiment, but the crypto market turns red after a short-lived rally. Despite the gloomy sentiment hovering on the crypto market, VanEck CEO remains bullish on Bitcoin and the broader crypto market.
VanEck CEO Remains ‘Super Bullish’ Despite Crypto Market Crash
VanEck CEO appears to have remained ‘super bullish’ on digital assets despite the recent crypto market crash. Notably, in a recent CNBC interview, VanEck CEO Jan Van Eck discussed Bitcoin’s recent price movements.
He noted that volatility is one of the common characteristics of the cryptocurrency sector, with spikes and drops in its value being typical. Besides, Van Eck stated that Bitcoin’s sudden rise followed by a decline was unusual but expected given its nature as a high-risk asset.
However, despite these fluctuations, he maintains a positive outlook on Bitcoin. For context, Van Eck highlighted long-term fundamentals such as the Bitcoin halving event and the Federal Reserve’s potential easing policies as bullish factors.
In addition, he also mentioned that a 20% correction in Bitcoin’s price is “normal” and does not deter his confidence in its potential. This perspective emphasizes his belief in Bitcoin’s resilience and future growth of the crypto market.
Also Read: Trump Vs Biden Election Outcome Unlikely To Deter Bipartisan Support For Crypto
Short-Term Challenges Persists
The recent crypto market crash could be attributed to several factors, including selling pressure from the German government and the concerns over Mt. Gox repayments. However, despite these short-term challenges, Van Eck remains bullish on Bitcoin’s long-term prospects.
He believes that these challenges are temporary and do not undermine the underlying value of Bitcoin and altcoins. Notably, Van Eck’s stance contrasts with the current market sentiment, which has been affected by recent volatility.
However, he views the current downturn as a typical correction rather than a significant setback. This perspective aligns with his overall optimistic outlook on the future of the crypto market.
Meanwhile, the broader financial market’s positive sentiment, driven by cooling US CPI inflation, has not translated into stability for the crypto market. However, Van Eck’s bullish outlook suggests confidence in the market’s recovery and growth potential. His belief in the resilience of digital assets underscores the importance of long-term investment strategies in navigating market volatility.
As of writing, the global crypto market cap was down 1.3% to $2.11 trillion, while Bitcoin price noted a decline of about 2%. The altcoins sector also followed suit, with Ethereum declining 1.6% to $3,074.
Also Read: SHIB Burn Skyrockets 4000% Amid Shiba Inu ETF Buzz
The presented content may include the personal opinion of the author and is subject to market condition. Do your market research before investing in cryptocurrencies. The author or the publication does not hold any responsibility for your personal financial loss.

- Ethereum layer 2 solution Arbitrum had a brief downtime on Friday.
- An update showed a surge in inscriptions had contributed to the spike in network traffic and gas fees.
- Arbitrum has since “resolved this issue,” with operations back to normal and gas prices steadily recovering.
Arbitrum, a rollup chain on Ethereum, is running normally after a brief downtime on Friday.
The layer 2 Ethereum scaling solution faced a little more than one hour network outage on December 15. An update posted on the official Arbitrum Foundation account on X noted that the outage happened after a surge in inscriptions triggered a stall in the Arbitrum One Sequencer.
Arbitrum operations back to normal
According to details shared with the community, the Arbitrum One Sequencer and Feed stalled approximately at 10:29 AM ET. The technical hitch led to a significant surge in network traffic and inevitably a spike in transaction fees.
While the platform has yet to provide a full post-mortem of the temporary outage, initial investigations show that rising inscriptions triggered the Sequencer’s failure. Here’s the team’s initial report.
“The Arbitrum One Sequencer is up and running after a temporary outage starting at 10:29 AM EST and resuming at 11:57 AM EST. The team is actively investigating, but we can confirm that a sustained surge of inscriptions triggered the sequencer to stop relaying transactions properly.”
Crypto analyst cygaar noted in a comment on X that its possible people had spammed the layer 2 chain with inscriptions. These overwhelmed the network’s sequencer, creating a huge backlog of transactions and skyrocketing the gas fees.
Summary of the Arbitrum outage and high Ethereum gas prices:
– People are spamming inscription transactions on Arbitrum. These are transactions that submit some hex data on-chain (images and metadata mostly).
– My guess is this overwhelmed the sequencer itself, preventing L2… pic.twitter.com/deJn4yVsT1
— cygaar (@0xCygaar) December 15, 2023
In a later update, the Arbitrum team said:
“Gas prices on Arbitrum One have stabilized and operations are back to normal. We’re continuing to gather more information and will provide a full post-mortem in the coming days.”

Key Takeaways
- Bitcoin had deviated slightly from stocks over the last couple of weeks
- Correlation has bounced back since
- Tech-heavy Nasdaq continues to trade in lockstep with Bitcoin as investors in both asset classes look to shifting expectations around interest rates
It’s been an odd few weeks in the market. The banking wobbles over the last few weeks, triggered by the bank run on the crypto-friendly Silicon Valley Bank (SVB), caused everything to go a little wonky.
One of the most curious aspects of this was a deviation from the normal Bitcoin/stocks relationship. Or, sort of. Bitcoin raced upwards while markets digested the banking news, with the correlation – at least on a short-term rolling 30-day metric – dipping as per the below chart.
The chart also shows, however, that the correlation has since come back up.
As I wrote in a deep dive at the time, we have seen these cases of temporarily dipping correlation a few times over the last year, most notably with the FTX crash in November, as well as the Celsius and LUNA crashes before it.
But in each case, the correlation roared back. The above chart shows that it is beginning to do the same again this time. And the chart below shows that no matter what you swing it, the relationship here is pretty close (and forgive the axis crime on this one, please).
What happens next?
The interesting question is what will happen going forward. The key development recently has been with regard to expectations around the future path of interest rates.
The forecasts have been transformed. With hiking interest rates exposing the mismanagement of the aforementioned collapsed banks, the trouble has led to the market forecasting a pullback in plans to hike further.
Instead of future hikes, there are now cuts in the pipeline, or at least according to the probabilities implied by fed futures.
And it was the transition into this new interest rate paradigm, occurring last year as inflation began to roar and it became clear that central banks needed to act, which kicked the correlation up between stocks and Bitcoin.
It is not that one is controlling the other, it is that Jerome Powell is controlling both. Tech stocks are particularly sensitive to interest rates, given the sector is valued so much by discounting future cash flows – and a lack of current profit – which is why the correlation, and bloodbath in 2022, was so strong between Bitcoin and the Nasdaq.
Whether a potential pivot back off this uber-tight monetary policy sparks a deviation in correlation going forward is yet to be seen. Perhaps it will to a certain extent, but at the same time, it remains difficult to come up with a strong argument that Bitcoin is ready to truly deviate.
A decoupling remains the ultimate bull vision for the asset, and perhaps it will get there one day in the future. But there is not much evidence, beyond blind hoping by those in the sector, that this is imminent.
Over a multi-year time horizon into the future? That is anyone’s guess. But if the past couple of years has taught us anything, it is that stocks and Bitcoin are paired at the hip, especially tech stocks. The past couple of weeks, and the resumption of this trend, is actually more of a reminder of this than a proof against the theory.
- Cardano price sees bulls hitting a ceiling that will be hard to break.
- ADA traders have been ignoring several elements that were the cause of the 2022 turmoil and are now getting caught up with reality.
- Until May of this year, expect to see a sideways to lower path as trading volume is still down one-third of what it used to be.
Cardano (ADA) price has been advancing and looks ready to close January in the green. The only big question or caveat for that is if that will be against the two massive bearish caps that are lying above the price action at the moment on a broader time frame. With the underlying trade volume very thin, it can be debatable if that rally is as strong and supported as many traders would think.
Cardano price wants to be a giant with feet of clay
Cardano price is set to snap the losing streak that has been ongoing since August of last year. Elements triggering a constant sell-off were staggering high inflation worldwide and harsh rhetoric from central bankers that this inflation would not go away without pain for the underlying economy. As inflation has been coming down, markets have been rallying a bit too preemptively higher with the idea that inflation will go down in a straight line toward 2%, which would be unusual historically as hiccups along the way are the norm.
ADA price has not seen its volume restored to its normal trading level since 2018. A rally of this magnitude under such slim volume tells us that the rally has been made on loose screws and could break with the littlest shock: for example, a sudden inflation jump instead of a decline. Traders must be aware that with the massive caps at $0.384 and $0.40 and Cardano price up by the pivotal horizontal level and the red descending trend line, any further upside will need ample help from central banks, inflation going further down and geopolitical risks decreasing substantially.
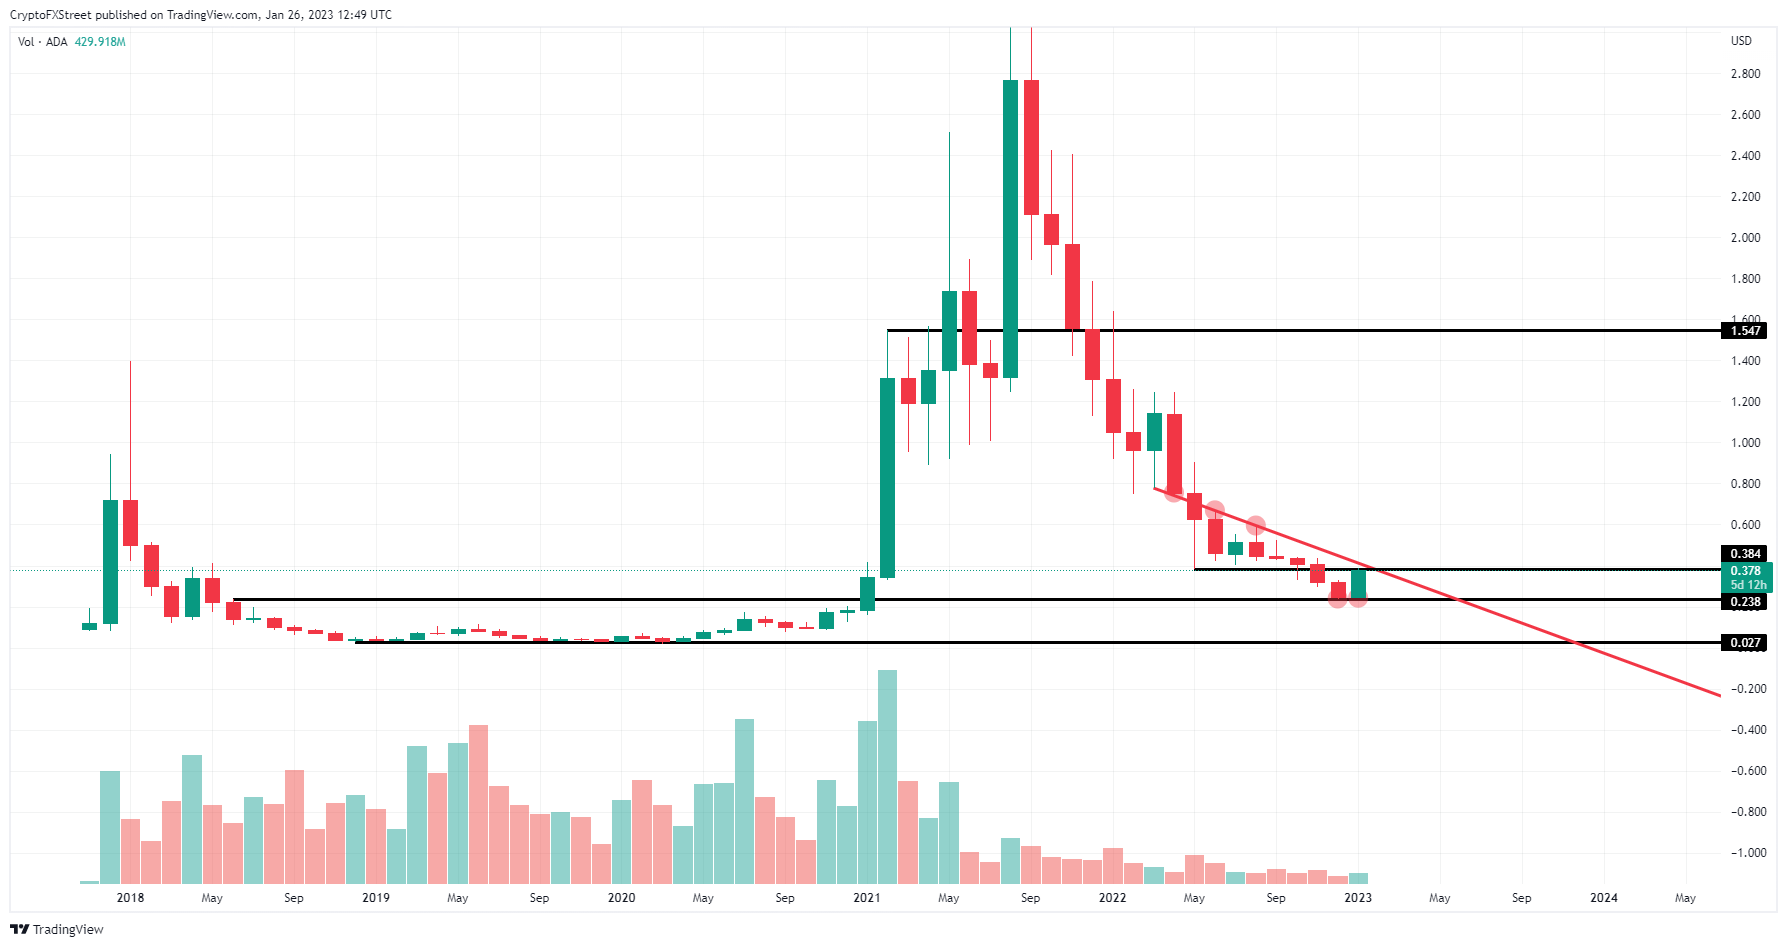
ADA/USD monthly chart
Should volume start to pick up further, grow into February and March, and then break above the levels back to May of 2022, the case can be made that something substantial has changed. The rally is more broadly bought, and with a bigger volume behind it, it will be able to withstand better any market turmoil. The volume buffer would absorb any market shocks better, and it could more easily push price action above $0.84 with the next $1.54 level as the price target to reach for 2023.
✓ Share: