Ethereum is demonstrating notable relative strength after reclaiming the $3,150 level and attempting to push higher, offering a refreshing shift in sentiment following weeks of intense selling pressure, fear, and market-wide uncertainty. As the broader crypto landscape begins to stabilize, ETH stands out as one of the assets showing early signs of recovery, drawing renewed attention from traders and long-term investors alike.
Related Reading
A key factor supporting this shift is the Net Unrealized Profit/Loss (NUPL) reading for Ethereum on Binance, which is currently sitting around 0.22 while price trades near $3,100.
This level reflects a delicate equilibrium between fear and optimism, indicating that a significant portion of ETH holders remain in moderate profit. Importantly, NUPL has not yet moved into the “greed” zone typically seen in the late stages of a bullish cycle, suggesting that the market is far from overheated.
Instead, Ethereum appears to be transitioning into a more neutral, constructive phase where investors are cautiously optimistic but not excessively euphoric. This balance often forms the foundation for a healthier recovery, especially after a deep correction. If momentum continues building and NUPL remains stable or trends higher, ETH could be positioning itself for a stronger upside move in the coming weeks.
NUPL Signals a Transitional Market Phase
Arab Chain notes that Ethereum’s NUPL index experienced a significant rise between June and August, reaching levels far higher than today and reflecting strong profitability across the network during mid-2025. At that time, investor sentiment leaned toward optimism, supported by rising prices and improving macro conditions.

However, as Ethereum’s price began to decline steadily from October onward, unrealized profits started to shrink. This pushed NUPL down toward more neutral territory, signaling a shift in sentiment from elevated optimism to a more grounded, cautious outlook.
Crucially, NUPL has not fallen into negative territory, meaning the average ETH holder has not transitioned into unrealized losses. This is an important sign of underlying market strength. When investors remain in profit, they tend to be less motivated to sell aggressively at lower prices, reducing the risk of panic-driven capitulation and helping stabilize price action during corrections.
Taken together, these signals indicate that Ethereum is currently in a transitional phase. The market is neither euphoric nor fearful—rather, it is waiting for a decisive catalyst to define the next trend. As long as NUPL stays above 0.20, Ethereum retains a meaningful level of investor confidence, increasing the likelihood of a rebound if liquidity strengthens or positive fundamental developments emerge.
Related Reading
ETH Rebounds Strongly on the Weekly Chart
Ethereum’s weekly chart shows a powerful rebound as price surges back above the $3,150–$3,200 region, reclaiming a critical support band that had turned into resistance during the November sell-off. The long lower wick from last week’s candle confirms strong buy-side interest around the $2,700–$2,800 zone, an area that has historically acted as a major demand region during multi-month corrections.

ETH has now reclaimed the 100-week SMA, a key trend indicator currently positioned near $2,900, signaling renewed structural stability. The 200-week SMA, sitting comfortably lower, continues to reinforce the long-term uptrend. However, the 50-week SMA, which has flattened and now looms around the $3,350–$3,400 level, represents the next significant resistance level. ETH will need a decisive weekly close above this moving average to confirm a true shift back into bullish momentum.
Related Reading
Volume on the rebound is notably stronger than in previous consolidation phases, suggesting increased participation and growing confidence among market participants. However, ETH is not yet in the clear. The series of lower highs since the September peak forms a descending structure that must be broken for a sustained uptrend to resume.
Featured image from ChatGPT, chart from TradingView.com
Crypto analyst Onchained recently provided valuable insights into an important metric that can be used to gauge the future trajectory of Bitcoin. The analyst suggested there was no cause to worry at the moment but highlighted what to watch out for to know the right time to exit the market.
Bitcoin Short-Term Holders NUPL Turns Negative
In a blog post, the analyst noted that the NUPL (Net Unrealized Profit/Loss) for Bitcoin’s short-term holders recently turned negative. The analyst added that this signals fear among this category of investors, which is very much likely given Bitcoin’s current price action. The last time this trend occurred was shortly after the Spot Bitcoin ETFs were approved, with Bitcoin dropping from $49,000 to $38,000 following that occurrence.
Related Reading: What Triggered The 6,350% Spike In XRP Long Liquidations Compared To Shorts?

Source: CryptoQuant
While the short-term holders’ NUPL turning red again suggests that a significant price decline may be on the horizon, the analyst remarked that this price level may simply represent a significant support line. The real cause for concern might be when the NUPL for mid-term holders also turns negative. “It could indicate widespread market fear and serve as a crucial risk management indicator for exiting the market,” the analyst claimed.
It is worth noting that the short-term holder’s NUPL being negative means they are currently seeing an unrealized loss in their investments. This could trigger a wave of sell-offs among these investors, mainly because of fear that Bitcoin’s price could further dip. However, based on the analyst’s analysis, this might not significantly lower Bitcoin’s price.
Instead, market speculators should be more worried about the PUNL of mid-term holders (those who have been holding Bitcoin for 3 to 6 months). The PUNL also turning negative will “suggest widespread pessimism or negative sentiment.” This could lead to massive selling pressure on Bitcoin’s price as this category of investors might also offload their holdings out of fear.
The Worst May Already Be Over
Crypto analyst Ali Martinez had previously shared a similar analysis to Onchained’s, noting that Bitcoin short-term holder’s (STH) realized price was at $59,800. The analyst warned back then that Bitcoin dropping below this level could trigger “notable Bitcoin price corrections.” Following his prediction, Bitcoin fell below $59,800, dropping to as low as $57,000.
Related Reading: Crypto Analyst Says Ethereum Price Will Drop To $2,500, Here’s Why
However, the flagship crypto has since then recovered nicely above $60,000. Although Bitcoin is still showing signs of a bearish outlook, its quick recovery above $60,000 suggests that the worst might be over, and all the crypto token needs right now is a catalyst to spark a continuation of its bull run.
Arthur Hayes, BitMEX’s co-founder and former CEO, also confirmed this belief, noting that Bitcoin has already found its local bottom. However, he predicted that Bitcoin will likely have a “range-bound price action between $60,000 and $70,000 until August.”
BTC bulls push price above $63,000 | Source: BTCUSD on Tradingview.com
Featured image from Kiplinger, chart from Tradingview.com
On-chain data shows the Bitcoin Net Unrealized Profit and Loss (NUPL) has found rejection at the long-term resistance zone recently.
Bitcoin NUPL Has Observed Some Decline In Recent Days
As explained by an analyst in a CryptoQuant post, the BTC NUPL metric has failed to clear a major resistance. The “NUPL” is an indicator that tells us about the degree of unrealized profit or loss that’s currently being held by the investors.
By “unrealized,” what’s meant here is that the holders have accumulated profits/losses (due to the price being more/less than what they purchased the coins at), but they are yet to actually sell their BTC to set them in stone.
When such investors who are holding unrealized profits/losses do end up selling eventually, the profits/losses they were previously holding are said to be “realized.”
When the value of the NUPL is greater than zero, it means the average investor is carrying a profit on their coins right now. On the other hand, the indicator being below this threshold suggests the market as a whole is sitting on some loss currently.
The zero value of the metric itself naturally represents the break-even level, as the total amount of unrealized profits in the market equals the unrealized losses at this mark.
Now, here is a chart that shows the trend in the Bitcoin NUPL, as well as its 365-day moving average (MA), over the last few years:

The value of the metric seems to have been going down in recent days | Source: CryptoQuant
In the above graph, the quant has marked the “long-term resistance” zone that the Bitcoin NUPL has seemed to have historically followed. This area, which lies in between the values of 0.31 and 0.38, has been an important retest for the cryptocurrency, as failure here has often meant the start of a drawdown.
When coming from above, however, there have also been bullish retests of this zone, as the points marked by the green checkmarks in the chart display. A prominent example of such a successful retest was back in July 2021, when BTC hit a local bottom and proceeded with the second half of the 2021 bull run following it.
The example of a bearish resistance appears to have formed just recently, as the indicator entered the zone recently but has been rejected downwards. And with it, so has the asset’s price. It’s uncertain yet, but this rejection may have started an extended drawdown for the coin.
“Given that the NUPL index has also formed a bearish Head & Shoulders (H&S) pattern, this could mean that Bitcoin could fall into the $24,000-$20,000 range,” notes the quant. “With the successful implementation of the H&S, the local uptrend of the NUPL index will also be broken.”
The Bitcoin NUPL has also shown interesting interactions with its yearly MA in the past; the indicator has sometimes found resistance or support at this level as well.
“The last frontier for maintaining Bitcoin bullishness is the 365-day MA, which acts as reliable long-term support,” says the quant. “For the above scenario to be declared invalid, it is necessary to overcome long-term resistance sustainably!”
BTC Price
At the time of writing, Bitcoin is trading around $26,300, down 2% in the last week.
BTC has plunged recently | Source: BTCUSD on TradingView
Featured image from iStock.com, charts from TradingView.com, CryptoQuant.com
Bitcoin NUPL data suggests that the crypto’s cycles are getting less sharper with time as profit tops and loss bottoms aren’t following a horizontal line.
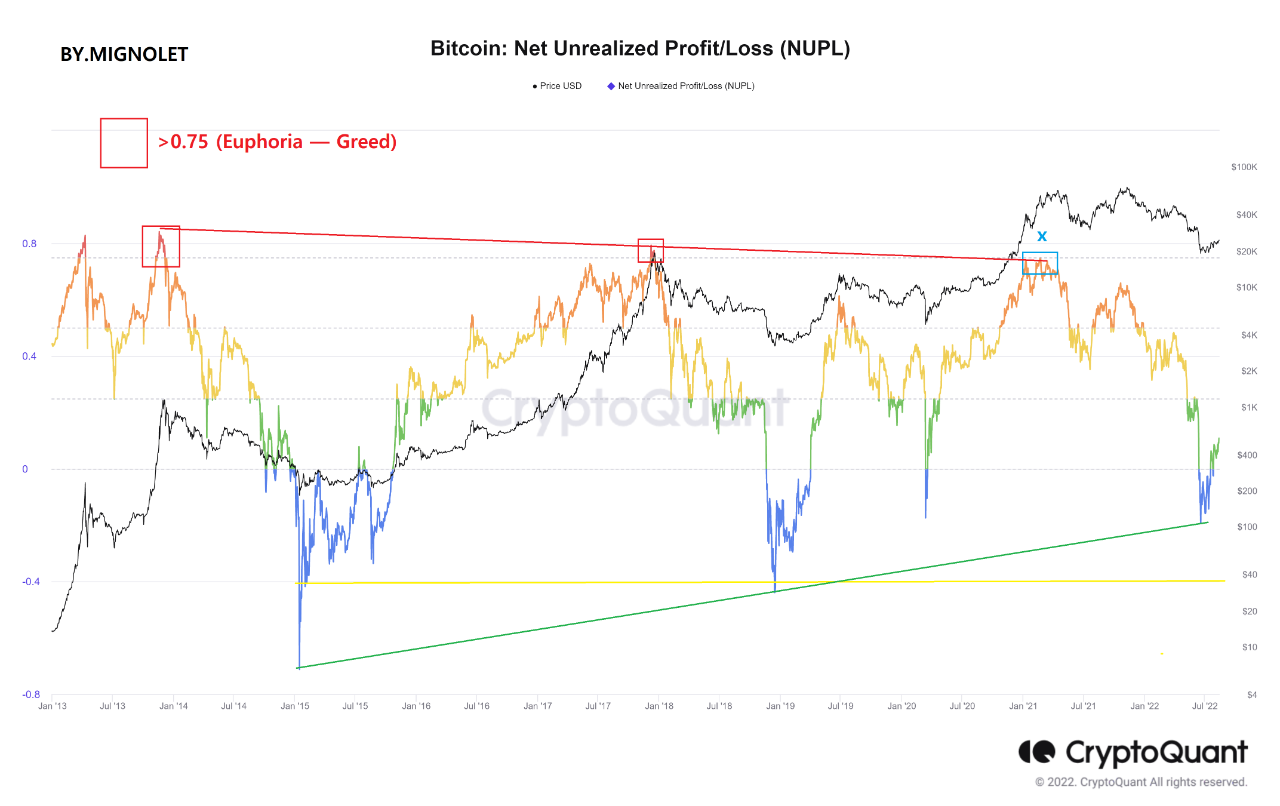
Bitcoin NUPL Didn’t Exceed The 0.75 “Greed” Mark During This Cycle
As explained by an analyst in a CryptoQuant post, the BTC profit and loss cycles shouldn’t be treated with horizontal lines.
The “Net Unrealized Profit and Loss” (or the NUPL in brief) is an indicator that tells us whether the market as a whole is holding a net profit or a net loss right now.
The metric’s value is calculated by taking the difference between the market cap and the realized cap, and dividing it by the market cap.
NUPL = (Market Cap – Realized Cap) ÷ Market Cap
When the value of this indicator is greater than zero, it means the average investor is currently holding some profits.
On the other hand, negative NUPL values imply the overall market is holding a net amount of unrealized loss at the moment.
Now, here is a chart that shows the trend in the Bitcoin NUPL over the course of the history of the crypto:
Looks like the value of the metric has surged up and turned positive again recently | Source: CryptoQuant
As you can see in the above graph, the quant has marked the relevant zones of trend for the Bitcoin NUPL indicator.
In the past, many traders used to believe that cycle tops form whenever the metric’s value surges above 0.75, entering into the “greed” zone.
Similarly, bottoms were thought to take place when the indicator went below the -0.4 mark, reaching into the “fear” region.
However, the analyst from the post argues that horizontal lines like these shouldn’t be used to mark these cycle tops and bottoms.
During the previous two cycles, the top that came after was lower than the one before. In the current cycle, the metric never crossed into the greed zone and topped out just around the 0.75 level. This could mean that tops are getting lower and lower with each cycle.
Similarly, the last two bottoms also had descending loss amounts. Just a while ago, the NUPL’s value sharply dropped off into negative and subsequently rebounded back up into positive values after forming a potential bottom. However, this low was far from the conventional 0.4 mark.
If this low was truly the bottom for this cycle, then it would add further credence to the idea that profit and loss fluctuations in the market are getting less drastic with time.
BTC Price
At the time of writing, Bitcoin’s price floats around $24.4k, up 5% in the past week.

The value of the crypto seems to have been moving sideways recently | Source: BTCUSD on TradingView
Featured image from Kanchanara on Unsplash.com, charts from TradingView.com, CryptoQuant.com
On-chain data shows the Bitcoin NUPL metric is back to a positive value, suggesting the market as a whole is back in profit.
Bitcoin NUPL Latest Trend Could Signal The Bottom Is Already In
As pointed out by an analyst in a CryptoQuant post, the BTC NUPL breaking above the neutral market may be a sign that the bottom has set in.
The “Net Unrealized Profit/Loss” (or “NUPL” in short) is an indicator that’s defined as the difference between the market and realized caps, divided by the market cap.
In simpler terms, what this metric tells us is the profit/loss ratio among investors in the current Bitcoin market.
The indicator works by looking at the on-chain history of each coin to see what price it was last moved at. If this selling price of any coin was less than the current BTC value, then that particular coin is holding some profit right now. Otherwise, it is in loss at the moment.
Related Reading | Capitulation: Public Bitcoin Miners Dump 25% of BTC Holdings Last Month
When the value of the NUPL is greater than zero, it means investors in the Bitcoin market as a whole are in profit. On the other hand, the indicator’s value being negative implies the overall market is currently in a state of loss.
Now, here is a chart that shows the trend in the BTC NUPL over the last several years:
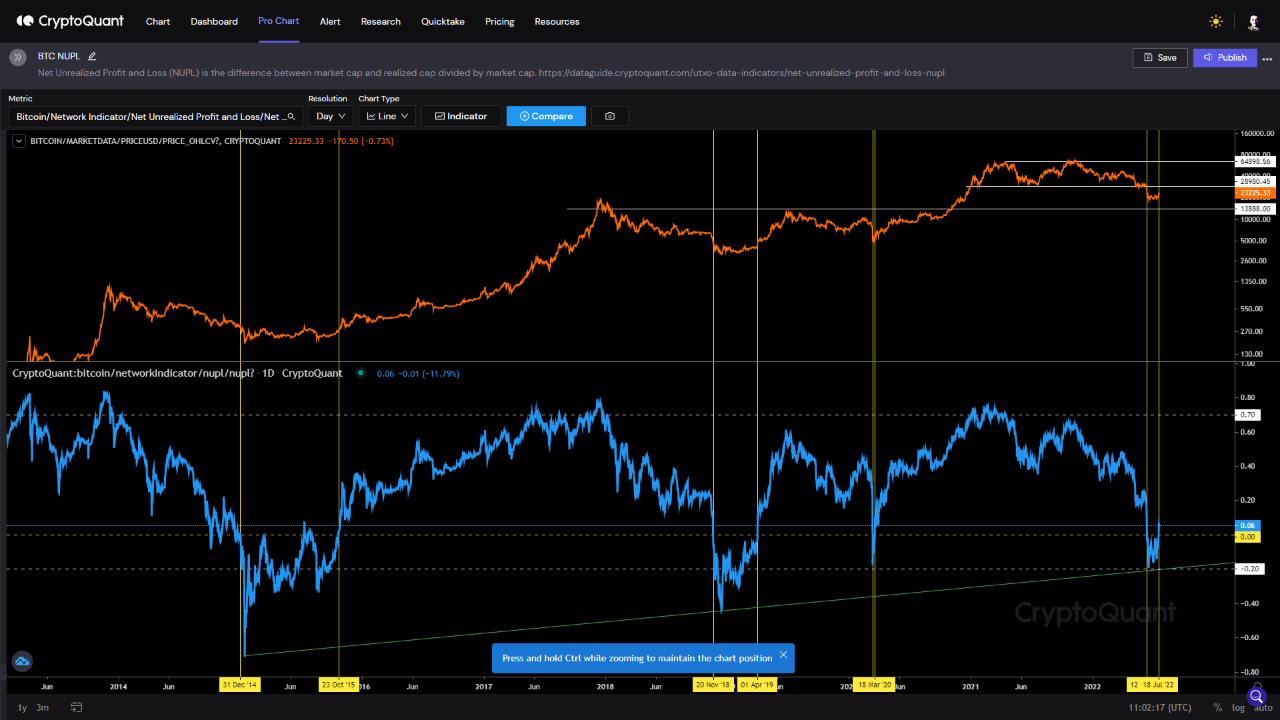
The value of the metric seems to have surged up in recent days | Source: CryptoQuant
As you can see in the above graph, the quant has marked the relevant zones of bear market trend for the Bitcoin NUPL.
It looks like some time after plunging deep below zero, a bounce back to positive values has been a sign of bottom formation during the previous bear markets.
Currently, the indicator is back to a positive value after observing a surge recently. This means that the investors as a whole are slightly in profit right now.
If the past cycles are anything to go by, this trend could imply the bottom has already been in for this Bitcoin bear market.
However, as is apparent in the chart, a break to green NUPL values doesn’t necessarily mean the end of the bear. It has only indicated that the crypto has already faced the worst.
Related Reading | Tesla Ruins Bitcoin Rally? Musk’s Company Sold 75% Of Its BTC
Past bear markets have lasted for much longer than the current one so it’s possible that if a similar pattern follows, the market may drop back into loss and move sideways for a while, before a proper bullish momentum builds up.
BTC Price
At the time of writing, Bitcoin’s price floats around $22.6k, up 10% in the past week.

BTC has slumped down during the last 24 hours | Source: BTCUSD on TradingView
Featured image from Kanchanara on Unsplash.com, charts from TradingView.com, CryptoQuant.com
On-chain data shows the Bitcoin NUPL metric has now declined to lows not seen since the COVID-19 crash back in 2020.
Bitcoin Net Unrealized Profit And Loss Plunged Down Recently
As explained by an analyst in a CryptoQuant post, the NUPL past trend may suggest that current values could be favorable for a rebound in the crypto’s price.
The “net unrealized profit and loss,” or NUPL in brief, is an indicator that’s defined as the difference between the current Bitcoin market cap and its realized cap, divided by the market cap.
The “realized cap” checks what price each coin on the chain was last moved at, and using these prices it calculates the crypto’s capitalization (while the normal market cap takes the sum of all coins’ value at the current price).
What this metric tells us is whether the BTC market participants as a whole are holding a profit or a loss at the moment.
When the value of the ratio is above zero, it means the overall market is in profit currently. On the other hand, values less than zero imply holders are carrying a loss right now.
Related Reading | Bitcoin Selling Pressure Continues As Long-Term Holder SOPR Spikes Up
Naturally, the metric being exactly equal to zero suggests the investors as a whole are just breaking even currently.
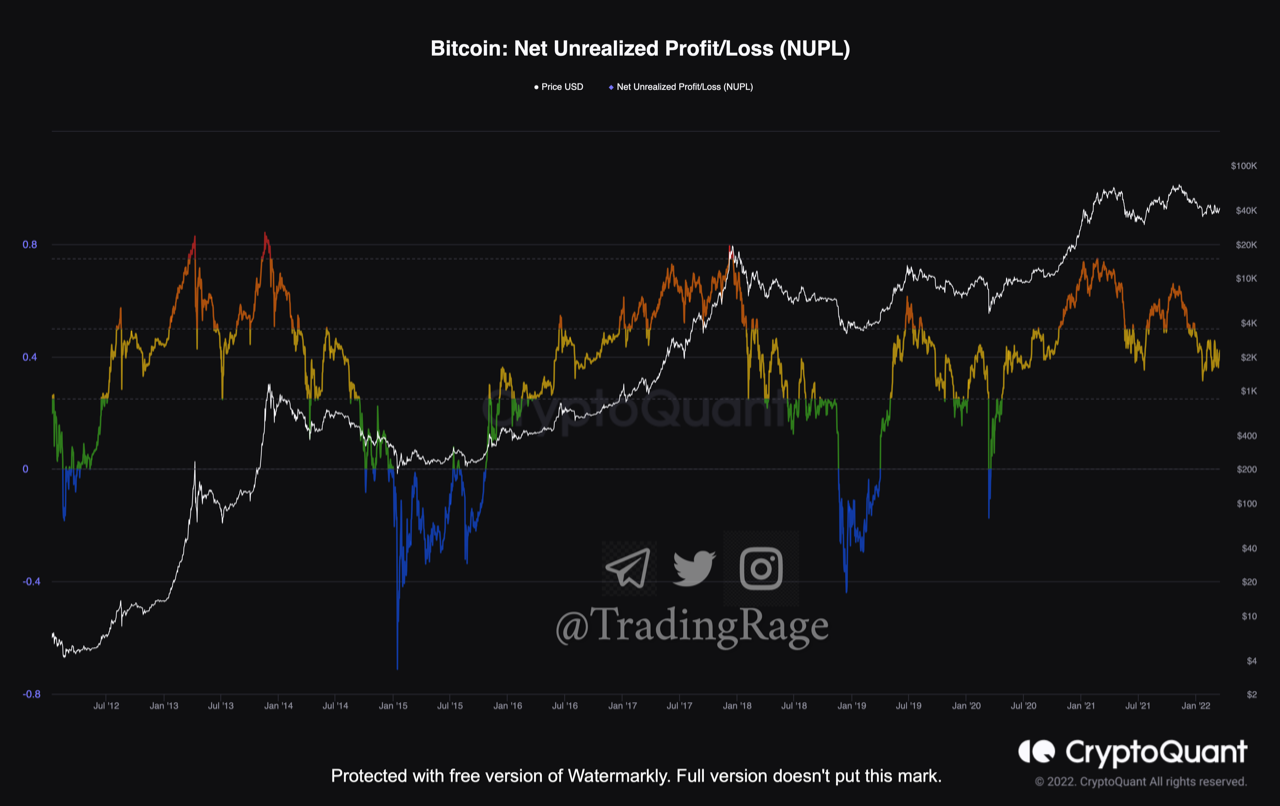
Now, here is a chart that shows the trend in the Bitcoin NUPL metric over the last few years:

It seems like the value of the metric has touched into the green zone recently | Source: CryptoQuant
As you can see in the above graph, the quant has marked the different zones of the Bitcoin NUPL indicator with different colors.
It looks like the ratio has observed some decline recently, and its value has now plunged down into the “green” zone for the first time since the COVID-19 crash.
Related Reading | More Stress For El Salvador As Bitcoin Dips To $29,000
In the history of the crypto, there have been multiple instances where shortly after the indicator has touched into this zone, the price has seen an upwards turn.
However, there is also the example of 2018, where the Bitcoin NUPL kept moving sideways in the green zone for a long while, until finally the value of the coin observed a sharp plummet, taking the market into loss.
It now remains to be seen whether this time the crypto will follow the pattern of a rebound, or if it will show a trend similar to that in 2018.
BTC Price
At the time of writing, Bitcoin’s price floats around $30.2k, down 1% in the past week.

Looks like the price of the crypto has been moving sideways around $30k recently | Source: BTCUSD on TradingView
Featured image from Unsplash.com, charts from TradingView.com, CryptoQuant.com
On-chain data shows the Bitcoin NUPL metric currently has values that would suggest the bear market is yet to hit in full swing, if the coin is in one.
Bitcoin NUPL Value Still Not As Low As Previous Bear Markets
As pointed out by an analyst in a CryptoQuant post, the BTC NUPL metric suggests market hasn’t neared a bear market bottom yet.
The “net unrealized profile/loss” (or NUPL in short) is an indicator that tells us about the ratio of profit and loss in the Bitcoin market.
The metric’s value is calculated by taking the difference between the market cap and the realized cap, and dividing it by the market cap.
When the NUPL has a value greater than zero, it means there are more coins in profit than ones in loss at the moment.
On the other hand, negative values of the indicator imply that investors are, on average, in a state of loss right now.
Related Reading | Bitcoin Bullish Signal: Exchange Reserve Loses Another 50k BTC Over Past Week
Now, here is a chart that shows the trend in the Bitcoin NUPL over the history of the crypto:
Looks like the value of the indicator is still above zero | Source: CryptoQuant
As you can see in the above graph, the Bitcoin NUPL metric has often been able to predict top and bottom formations through its various colored zones.
In the previous bear markets, the indicator’s value has usually fallen off below zero (blue) as a bottom approached.
In the lead up to these bearish periods have been the yellow and green phases, but currently the NUPL still looks to be in the yellow zone.
This may mean that if Bitcoin has already entered into a bear market, it has still some ways to go before total capitulation and bottom formation.
Related Reading | What’s Bitcoin Role After End of Petrodollar System? Arthur Hayes Says
However, it’s worth noting that there have been instances before where the indicator dropped into the yellow zone after a bull rally, but then jumped back up soon after as the bullish trend continued, indicating a mid-cycle bottom formation instead.
The latest example of this was during the mini-bear period of May-July 2021, where the coin bottomed at around $28k and rallied on to a new ATH.
BTC Price
At the time of writing, Bitcoin’s price floats around $41.4k, up 6% in the past week. Over the last month, the crypto has gained 8% in value.
The below chart shows the trend in the price of the coin over the past five days.

The price of the crypto seems to have held above $40k over the past couple of days | Source: BTCUSD on TradingView
Featured image from Unsplash.com, charts from TradingView.com, CryptoQuant.com
A quant breaks down how the Bitcoin NUPL indicator may be able to predict the beginning of a new bull run based on past pattern.
How The Bitcoin NUPL Metric May Predict The Start Of Bull Run
As explained by an analyst in a CryptoQuant post, the various phases of the NUPL indicator may shed some light relating to the bull run status for BTC.
The net unrealized profit and loss (or NUPL in short) is a metric that’s defined as the difference between the market cap and the realized cap, divided by the market cap.
NUPL = (Market Cap – Realized Cap) ÷ Market Cap
In simpler terms, what this indicator tells us about is the degree of profit or loss Bitcoin investors as a whole currently observe.
When NUPL values are above zero, it means holders are, on average, in profit. On the other hand, the market as a whole is in a state of profit if the indicator’s value is more than zero.
Related Reading | Comparing Apple’s Growth With Bitcoin, Why This Expert Sets $700K As Long-Term Goal
Now, here is a chart that shows the trend in the BTC NUPL over the past ten years:
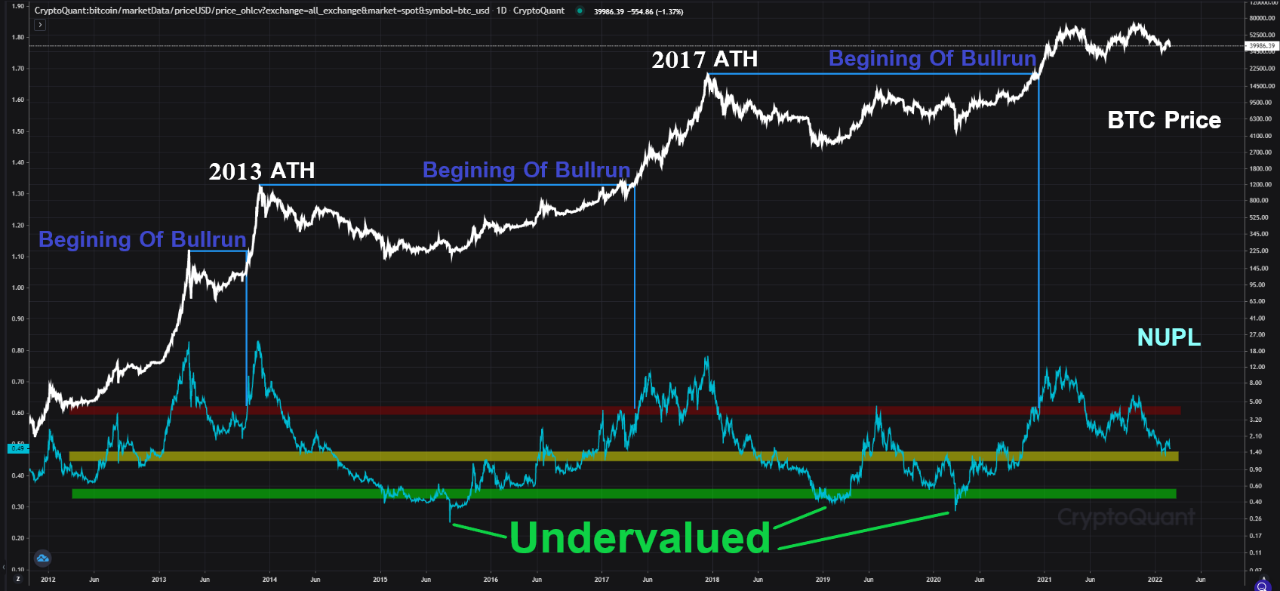
The correlation between the BTC price and the indicator's values | Source: CryptoQuant
As you can see in the above graph, the quant has marked three different regions of importance for the Bitcoin NUPL metric.
It looks like whenever the metric has crossed above the red line, a BTC bull run has also begun in tandem. The green region, on the other hand, seems to be when the crypto is undervalued, and bottom formations take place.
Related Reading | Pantera Predicts Correlation Between Bitcoin And Traditional Markets Might Break This Spring
According to the analyst, the yellow region is a divider between bull and bear trends. Crossing below this bar has historically marked the beginning of a new bear market.
Currently, the Bitcoin NUPL is right above this region, and if the metric goes down and crosses below it, a new bear period may start. However, the quant has noted that this region can serve as support during the middle of a cycle as well, as it already did once recently.
BTC Price
Today, Bitcoin’s price has plunged down below the $38k mark continuing its recent downfall. At the time of writing, the price of the coin floats around $37.6k, down 10% in the last seven days. Over the past month, the crypto has lost 8% in value.
The below chart shows the trend in the price of BTC over the last five days.

BTC's price seems to have sunk down over the past few days | Source: BTCUSD on TradingView
Featured image from Unsplash.com, charts from TradingView.com, CryptoQuant.com
Bitcoin NUPL indicator has sharply dropped in value recently, a trend that may signal the start of the early bear market period.
After The Crash, Bitcoin NUPL Value Has Declined To 32.5%
According to the latest weekly report from Glassnode, the BTC NUPL’s recent trend may suggest that the early bear market is now beginning.
The “Net Unrealized Profit and Loss” (or NUPL in short) is an on-chain indicator that measures the difference between the relative unrealized profit and the relative unrealized loss.
NUPL = (Market Cap – Realized Cap) / Market Cap
In simpler terms, what this metric tells us is whether the Bitcoin market as a whole is currently in a state of profit or of loss.
The indicator works by looking at each coin on the chain and checking whether its current price is lower or higher than the price it was bought at.
When the NUPL value is above zero, it means the overall Bitcoin network is currently in profit. On the other hand, negative values imply investors are, on average, in loss at the moment.
Historically, the more the indicator has deviated from zero, the closer the price has been to a top or a bottom (depending on which way of zero the metric currently points).
Related Reading | Following Crash, Bitcoin Open Interest Declines To Sept 2021 Levels
Now, here is a chart that highlights the trend in the Bitcoin NUPL over the history of the coin:
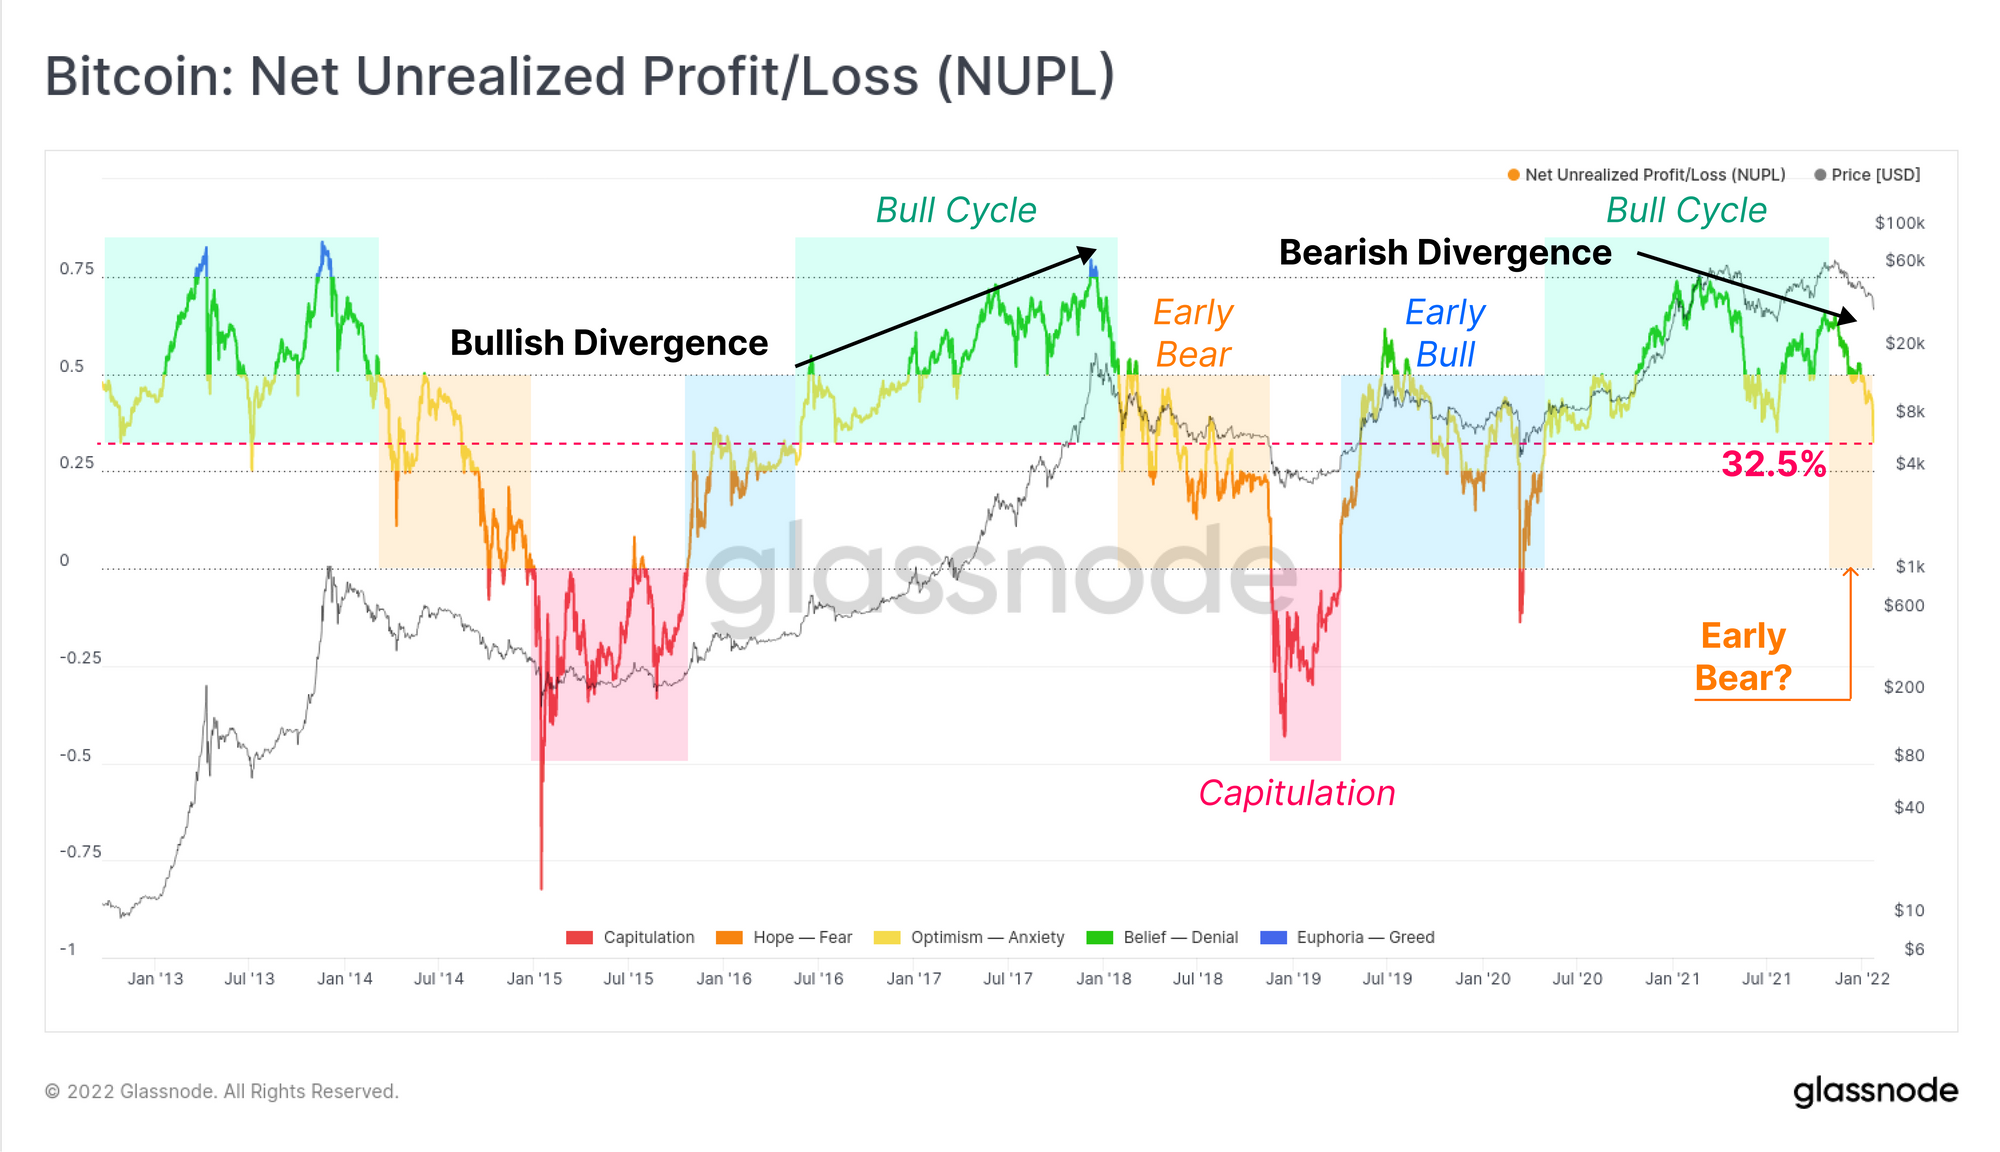
Looks like the metric's value has sharply declined recently | Source: The Glassnode Week Onchain - Week 4, 2022
As the above graph shows, the Bitcoin NUPL has sharply declined recently, and its value is now 0.325. This means that currently 32.5% of the crypto’s market cap is being held as unrealized profit.
Related Reading | Has Bitcoin Reached Its Bottom? Analyst Says It Still Has A Long Way To Go
The indicator’s current value seems to be in a region that has historically signaled an early bear market trend, as the colors in the chart highlight.
The trend over the past year has also been that of a bearish divergence. Therefore all NUPL signs are that this may now be the beginning of a new bear market.
An interesting fact is that similar values were also there following the May 2021 crash. Thus in a sense, a bear market also started then, but it only lasted for a few months.
BTC Price
At the time of writing, Bitcoin’s price floats around $36.4k, down 12% in the last seven days. Over the past month, the crypto has lost 28% in value.
The below chart shows the trend in the price of BTC over the last five days.

BTC's price plunged to $33k yesterday, but has since recovered back above $36k | Source: BTCUSD on TradingView
Featured image from Unsplash.com, charts from TradingView.com, Glassnode.com