The historical Spot Ethereum Exchange-Traded Funds (ETFs) are currently seeing a negative sentiment, which is believed to be mimicking the negative trend seen with that of the Spot Bitcoin ETFs on BTC’s price following its inception in January of this year. Their respective ETFs have seen decreased inflows and deteriorating performance, closely mirroring each other as the two most popular cryptocurrencies face downward pressure.
Spot Ethereum ETFs Face Notable Challenge
According to analysts at the Woo X research platform, spot Ethereum ETFs are in a similar downward trend to Bitcoin, indicating the general bearishness of the market. After the inception of the ETH spot ETFs on July 23, Woo X highlighted that the crypto asset saw an 11% reduction in price, falling from $3,500 to a low of about $3,100 simultaneously in just three days.
In addition to the present unfavorable market conditions, the analysts at the firm state that the ETH spot ETFs are confronting an obstacle akin to the one that BTC had previously faced, citing the selling pressure from the largest asset management company, Grayscale.
The platform noted that post the launch of the Bitcoin spot ETFs, BTC also experienced a 20% price drop, falling from about $48,000 to $38,000 in over two weeks due to the selling pressure from Grayscale’s BTC ETF, GBTC.
However, the price later surged from the $38,000 price level to a historic high of $73,000 as Grayscale’s GBTC selling pressure reduced, and the net capital flowing into the funds continued to rise.
In the event that Ethereum witnesses a similar circumstance, Woo X believes the price of ETH could hit the $2,850 mark. Meanwhile, the precise effect will be determined by the selling pressure exerted by Grayscale and the net inflows of the spot ETH ETFs generally.
ETH Spot ETFs Attract Negative Inflows
Investors’ interest around the spot Ethereum ETFs seems to have dived down as the funds after Tuesday’s trading recorded a negative outflow, with millions of dollars seen flowing out from the products.
According to data from the London-based investment management company Farside Investors, the products saw an overall outflow of $47 million. Fidelity ETH ETF (FETH) was the only fund that closed the market on a positive note, attracting about $4.9 million daily inflows.
Other asset management firms funds like Blackrock‘s Ethereum ETF (ETHA), Bitwise ETH ETF (ETHW), 21Shares ETH ETF (CETH), VanEck ETH ETF (ETHV), and Franklin ETH ETF (EZET) closed the market on a negative note with zero inflows. Meanwhile, Grayscale ETH ETF (ETHE) saw another day of outflows reaching about $52.3 million.
This outflow suggests that investors are withdrawing from the products due to the recent price movement of ETH and the general market fluctuations, reflecting a cautious approach as they reassess their exposure to the altcoin.
Featured image from Unsplash, chart from Tradingview.com
The Surge in Shiba Inu (SHIB) Mega Transactions Crosses 1.6 Trillion SHIB as TMS Network (TMSN) Observes User … Analytics Insight
Source link ]]>
Data shows a large amount of leverage has been piling up in the Ethereum futures market as the price of the crypto breaks above $2k.
Ethereum Open Interest Surges To Highest Value In Last 4 Months
As pointed out by an analyst in a CryptoQuant post, the ETH futures market has seen the leverage sharply going up recently.
The “open interest” is an indicator that measures the total number of Ethereum futures contracts currently open in all derivatives exchanges.
When the value of this metric rises up, it means investors are opening up more positions on the market right now. Since more futures positions imply that leverage is also going up in the market, such a trend can lead to higher volatility in the price of the coin.
On the other hand, lowering values of the indicator suggest holders are closing up their positions at the moment. This kind of trend can result in a less volatile value of ETH.
Now, here is a chart that shows the trend in the Ethereum open interest over the course of 2022 so far:
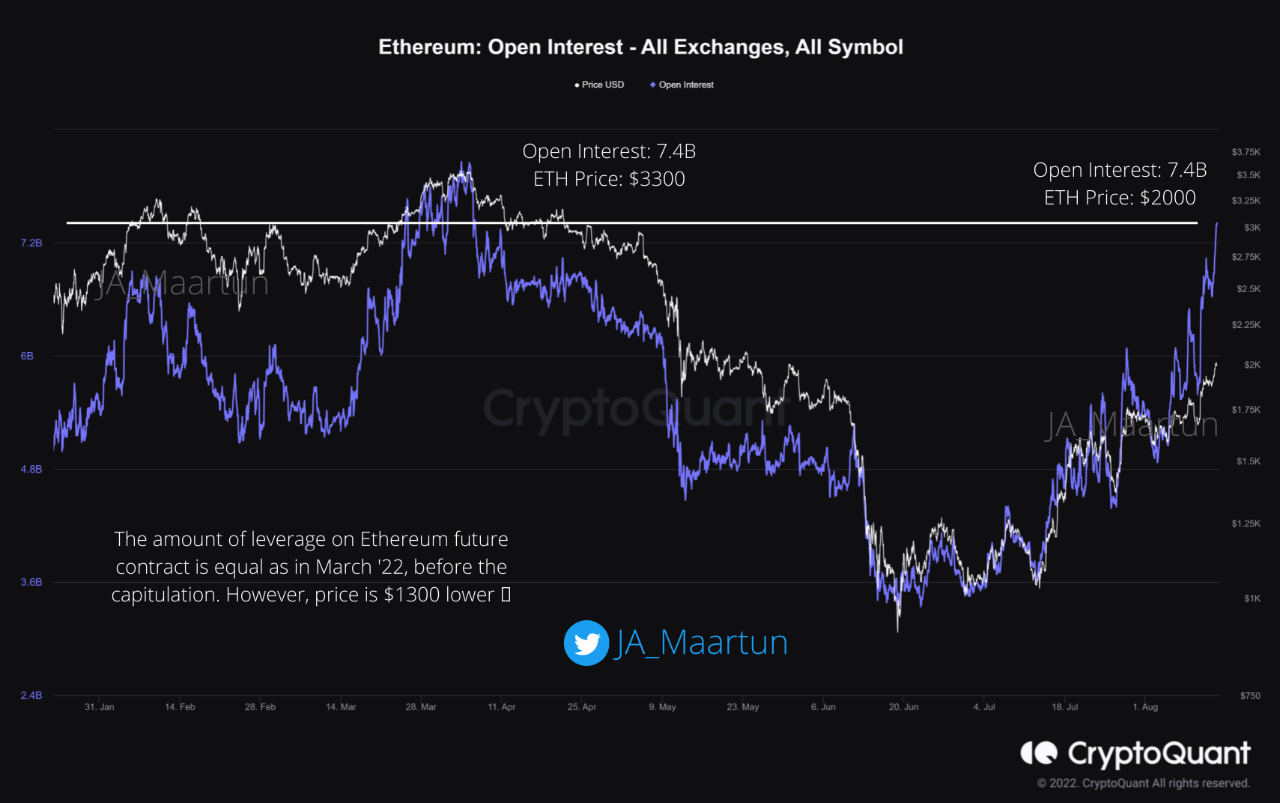
Looks like the value of the metric has shot up in recent days | Source: CryptoQuant
As you can see in the above graph, the Ethereum open interest has observed some sharp uptrend during the past couple of weeks.
The indicator has now reached a value of 7.4 billion, the highest it has seen during the last four months. However, there is an interesting comparison here.
Around 4 months ago, when such values were previously observed, the price of ETH was about $3.3k. But today the price is just $2k, around $1.3k less than it was back then.
And yet, the open interest is at the same level, meaning the Ethereum market might be having the same degree of leverage this time as well, while the price is much lower.
When especially high leverage accumulates in the futures market, any sharp swing in the price can liquidate a large number of positions at once. These liquidations then further amplify this price move, which liquidates more positions.
In this way, liquidations can cascade together, and the event is called a “liquidation squeeze.” This is the reason behind the volatility of an overleveraged market.
If a long squeeze does end up taking place this time, then the latest rally in the value of ETH may hit the breaks.
ETH Price
At the time of writing, Ethereum’s price floats around $1.9k, up 5% in the past week.

The value of ETH seems to have gone up during the last few days | Source: ETHUSD on TradingView
Featured image from Kanchanara on Unsplash.com, charts from TradingView.com, CryptoQuant.com
Data shows extreme fear sentiment in the Bitcoin market has continued for almost a month now, the longest stretch since April 2020.
Bitcoin Market Sentiment Remains In Extreme Fear Territory
As per the latest weekly report from Arcane Research, the crypto fear and greed index has continued to point at extreme fear this week.
The “fear and greed index” is an indicator that measures the general market sentiment among Bitcoin and crypto investors.
The metric uses a numeric scale that runs from one to hundred for representing this sentiment. All values above “50” signify greed in the market, while those below the threshold suggest fear among investors.
The extreme values of above 75 and below 25 imply sentiments of “extreme fear” and “extreme greed,” respectively.
Historically, bottoms in the price of Bitcoin have tended to form during periods of extreme fear. On the other hand, the crypto has observed tops during stretches of extreme greed.
Some investors think that because of this, it’s best to buy during extreme fear, while extreme greed is ideal for selling.
Related Reading | Bitcoin LTHs Realized Significant Losses Recently, Final Capitulation Here?
“Contrarian investing” follows this approach. Warren Buffet’s famous quote sums it up: “Be fearful when others are greedy, and greedy when others are fearful.”
Now, here is a chart that shows the trend in the Bitcoin fear and greed index over the past year:

The value of the indicator seems to have been quite low recently | Source: Arcane Research's The Weekly Update - Week 21, 2022
As you can see in the above graph, the Bitcoin fear and greed index has a value of 16 right now, suggesting that the market is extremely fearful.
These low values of the metric have remained for almost a month now, making it the longest stretch of extreme fear since right after the COVID crash back in April 2020.
Related Reading | Bitcoin Exchange Outflows Suggest That Investors Are Starting To Accumulate
The report notes that long periods of poor sentiment aren’t extraordinary in the crypto market, but in the past such stretches have usually observed temporary spikes to better sentiment.
In the month of May, there was no such interruption that provided Bitcoin investors with a glimmer of hope.
BTC Price
At the time of writing, Bitcoin’s price floats around $31.4k, up 6% in the last seven days. Over the past month, the crypto has lost 16% in value.
The below chart shows the trend in the price of the coin over the last five days.

Looks like the price of the crypto has observed a push up in the last couple of days | Source: BTCUSD on TradingView
Bitcoin has now maintained strongly above the $31k mark for the first time since the beginning of May. However, at the moment, it’s unclear whether this recovery will last.
Featured image from Unsplash.com, charts from TradingView.com, Arcane Research
Bitcoin on-chain data shows the crypto exchange Binance observed large inflows amounting to almost 10k BTC yesterday.
Bitcoin Netflow Shows A Huge Positive Spike As 10k BTC Enters Binance
As pointed out by an analyst in a CryptoQuant post, the BTC netflow had a big positive spike yesterday, a sign that’s usually bearish for the price.
The “all exchanges netflow” is an indicator that measures the net amount of Bitcoin entering or exiting wallets of all exchanges. The metric’s value is simply calculated by taking the difference between the inflows and the outflows.
When the indicator has positive values, it means there are currently more inflows happening than outflows. Such a trend is often bearish as investors usually deposit their Bitcoin for selling purposes.
On the other hand, when the value of the metric is negative, it implies outflows are overwhelming inflows as a net amount of BTC is exiting exchanges. This kind of trend can be bullish for the price of the crypto as holders generally withdraw their coins to hold them.
Related Reading | Bitcoin Leverage: Lack Of Liquidations Could Indicate Another Wave Of Selling
Now, here is a chart that shows the trend in the Bitcoin netflow over the last couple of months:
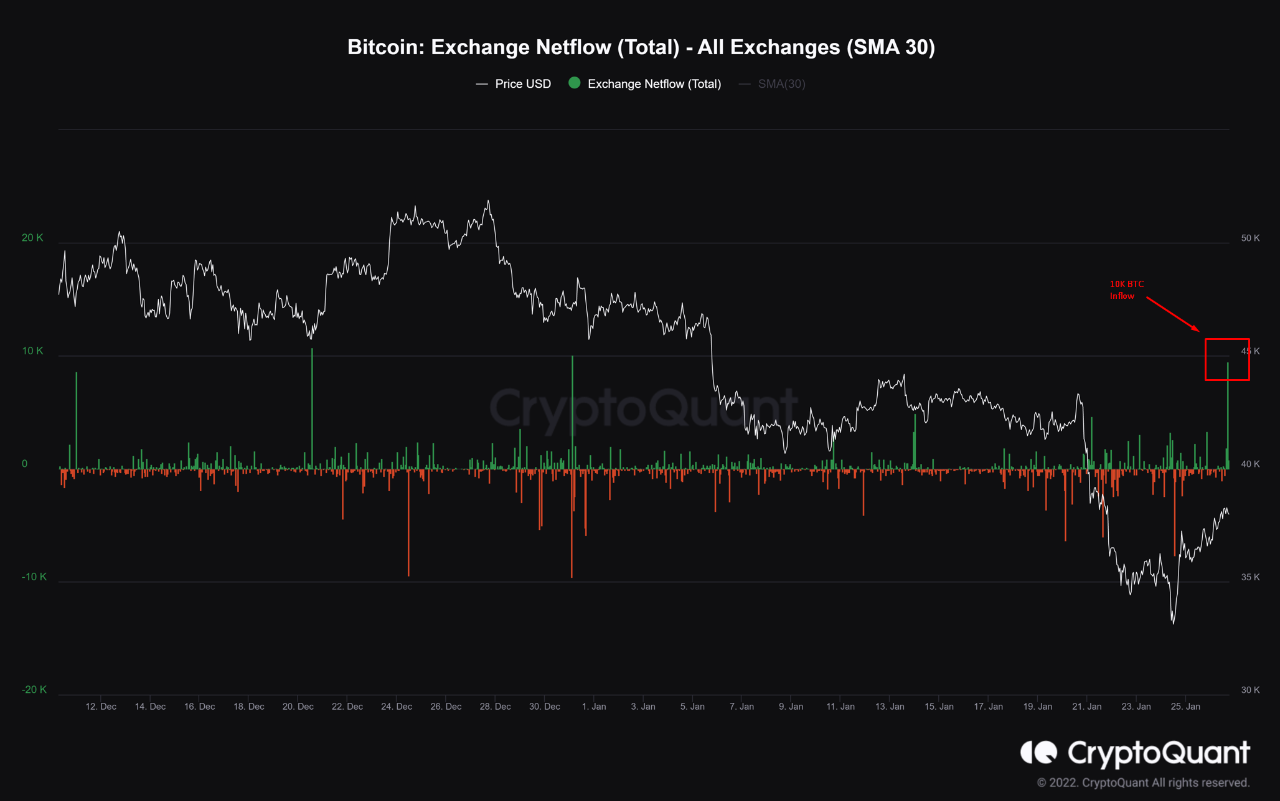
Looks like the value of the metric showed a huge positive spike recently | Source: CryptoQuant
As you can see in the above graph, yesterday the Bitcoin netflow showed that almost 10k BTC entered exchanges yesterday within an hour.
A look at the chain data reveals these inflows were to Binance. Interestingly, just a few hours later, the crypto exchange Gemini observed an outflow of about 10k BTC, cancelling out these inflows and making the netflow neutral again.
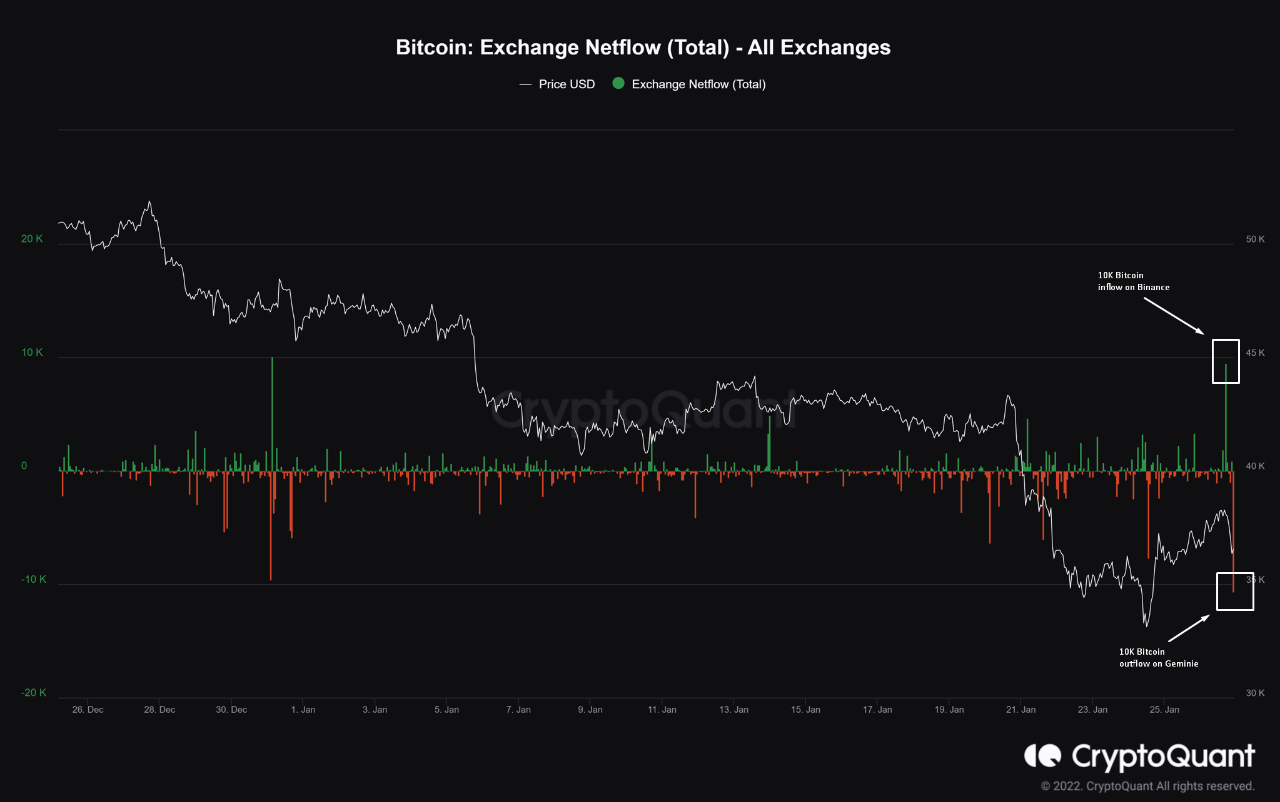
The negative spike makes up for the positive one from a few hours earlier | Source: CryptoQuant
As mentioned earlier, inflows are usually bearish for the price of Bitcoin. However, since outflows of the same amount occurred just a couple of hours later, the netflows effectively became neutral.
Related Reading | Anthony Scaramucci Urges Bitcoin Holders To Think Long-Term As Downtrend Won’t Last
Now, outflows can be bullish for the price if they occurred for the purpose of accumulation. But that doesn’t necessarily have to be the case. If the investors who were behind the withdrawal intend to sell them through OTC deals, the effect on the price may be bearish instead.
BTC Price
At the time of writing, Bitcoin’s price floats around $36.8k, down 12% in the last seven days. The below chart shows the trend in the value of the coin over the last five days.

BTC's price has retraced a lot of the recovery that it made over the last few days | Source: BTCUSD on TradingView
Featured image from Unsplash.com, charts from TradignView.com, CryptoQuant.com
On-chain data shows despite the Bitcoin drop to $47k, Coinbase saw outflows of around 31k BTC, a sign that the market could still be bullish.
Outflows Of 31k BTC On Crypto Exchange Coinbase
As pointed out by a CryptoQuant post, the popular crypto exchange Coinbase has observed huge Bitcoin outflows today.
As is apparent from the name, the “outflows” indicator shows the amount of BTC transferred from an exchange to personal wallets.
A huge spike in the metric’s value means big investors are moving their Bitcoin out of exchanges either to hodl or for selling through OTC deals.
Therefore, outflows are generally good signs for the cryptocurrency’s price as they may imply that there is a buying pressure in the market.
Now, here is the chart for Coinbase Pro Bitcoin outflows over the past few months:
Coinbase Pro outflows show a huge spike | Source: CryptoQuant
As the above graph displays, the indicator has shot up for Coinbase Pro. The outflow value was about 31,107 BTC, which is worth over $1.5 billion at the current price exchange.
The exchange is mainly used by US institutional investors so that such a large spike could be bullish for the cryptocurrency.
Related Reading | 4 Reasons Why Bitcoin Remains Bullish, What Might Bring New ATHs
Big outflows are generally associated with an increase in the price shortly after. A look at the Coinbase Pro outflow history supports the trend; from March 2020 onwards, similar values of the indicator became frequent as the bull run marched on.
Bitcoin Price
At the time of writing, BTC’s price floats around $48.5k, down 0.16% in the last 24 hours. Though, over the last week the cryptocurrency is still green as its value is about 6.8% up.
In the past 30 days, Bitcoin has accumulated 26.4% in gains. The below chart showcases the trends in the price of the coin over the last three months:
BTC’s price sharply falls down after touching the $50k price level | Source: BTCUSD on TradingView
After weeks of climbing upwards, BTC was finally able to break $50k a couple of days ago for the first time since May. However, the coin couldn’t sustain at the level and was rejected downwards.
Related Reading | Will Ethereum Reach Its All-Time-High Before Bitcoin?
The downtrend has been sharp, and earlier today the price fell down to as low as $47k. However, since then it has recovered somewhat to above the $48k level.
It’s unclear which direction Bitcoin will go in next, but if the Coinbase Pro outflows are anything to go by, signs seem to be still bullish for the market. Though, at the moment BTC’s on-chain activity is still very low. If the coin tests $50k again without the network activity going up, a bearish signal could flare up instead.
]]>