Ethereum price started a fresh recovery above $4,120. ETH is now showing positive signs and might rise further toward the $4,400 level.
- Ethereum started a recovery wave above the $4,000 and $4,120 levels.
- The price is trading above $4,120 and the 100-hourly Simple Moving Average.
- There is a key bullish trend line forming with support at $4,150 on the hourly chart of ETH/USD (data feed via Kraken).
- The pair could continue to move up if it trades above $4,320.
Ethereum Price Gains Traction
Ethereum price started a recovery wave above the $3,850 level, like Bitcoin. ETH price formed a base and was able to recover above the $4,000 level.
The price cleared the 50% Fib retracement level of the main drop from the $4,758 swing high to the $3,422 low. The bulls were able to push the price above the $4,200 pivot level. Besides, there is a key bullish trend line forming with support at $4,150 on the hourly chart of ETH/USD.
Ethereum price is now trading above $4,200 and the 100-hourly Simple Moving Average. On the upside, the price could face resistance near the $4,250 level. The next key resistance is near the $4,400 level.
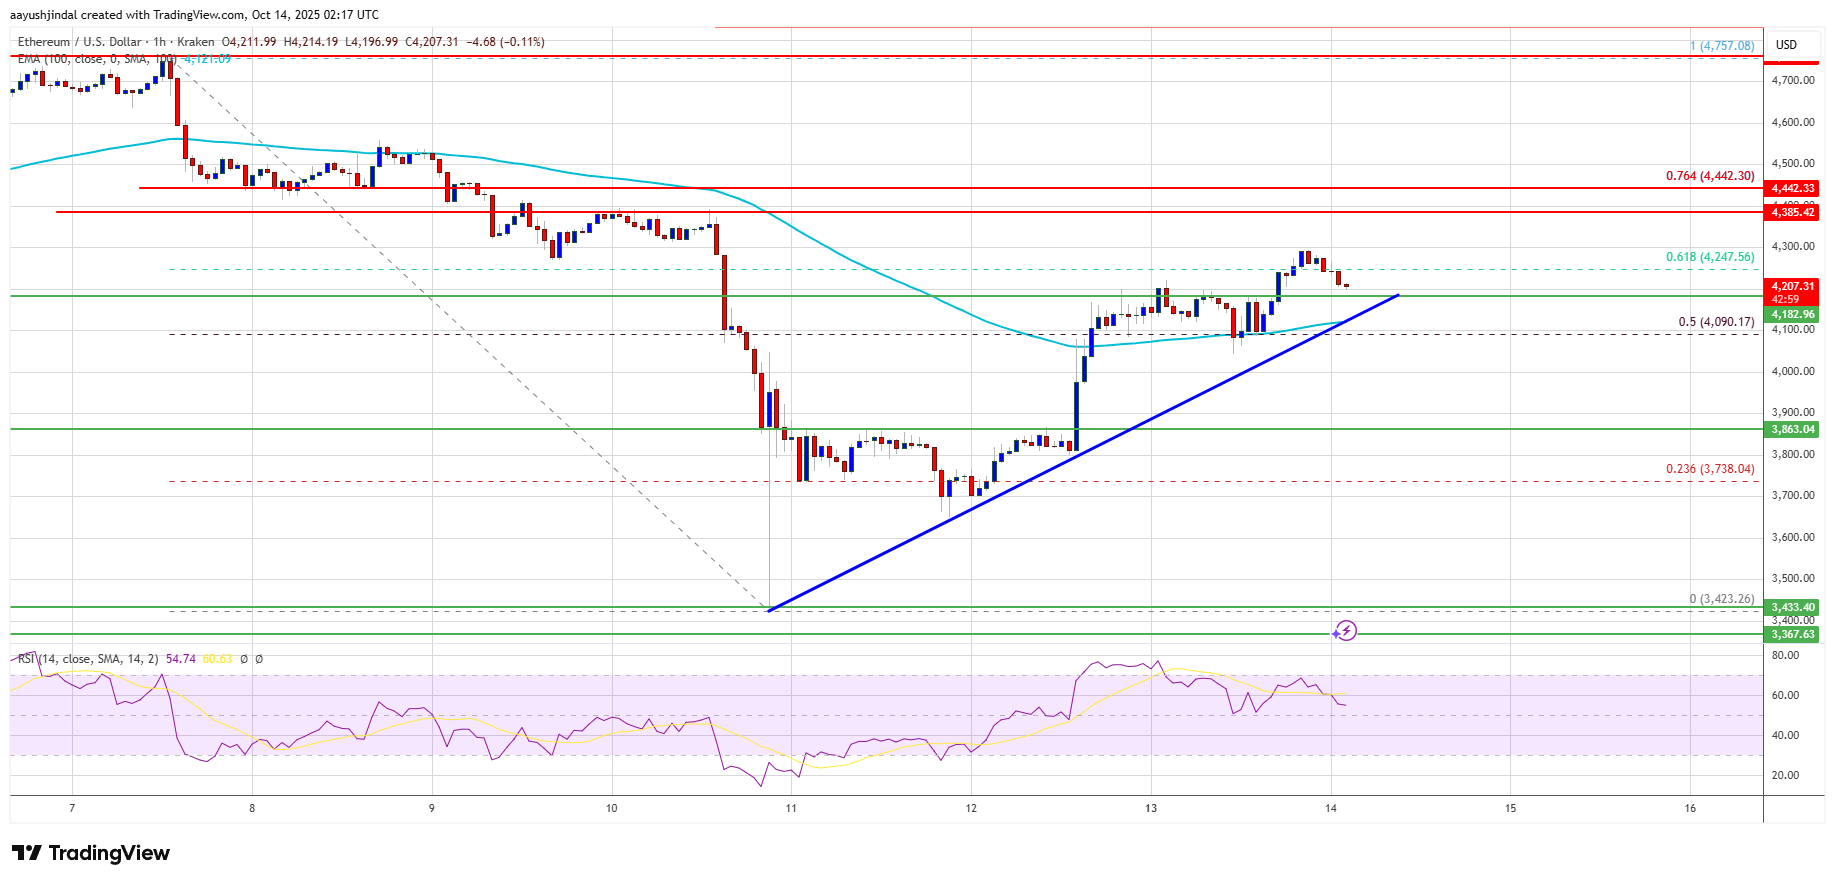
The first major resistance is near the $4,440 level and the 76.4% Fib retracement level of the main drop from the $4,758 swing high to the $3,422 low. A clear move above the $4,400 resistance might send the price toward the $4,500 resistance. An upside break above the $4,500 region might call for more gains in the coming sessions. In the stated case, Ether could rise toward the $4,550 resistance zone or even $4,650 in the near term.
Another Decline In ETH?
If Ethereum fails to clear the $4,300 resistance, it could start a fresh decline. Initial support on the downside is near the $4,150 level and the trend line. The first major support sits near the $4,120 zone.
A clear move below the $4,120 support might push the price toward the $4,050 support. Any more losses might send the price toward the $3,950 region in the near term. The next key support sits at $3,880.
Technical Indicators
Hourly MACD – The MACD for ETH/USD is gaining momentum in the bullish zone.
Hourly RSI – The RSI for ETH/USD is now above the 50 zone.
Major Support Level – $4,150
Major Resistance Level – $4,300
Michael Saylor has once again highlighted Bitcoin’s growing dominance. In a recent post, he showed how Strategy’s Bitcoin-driven returns, open interest, and treasury growth has surpassed the Magnificent 7. Saylor Highlights Bitcoin’s Market Edge Over Tech Giants Saylor first revealed how Bitcoin-linked exposure has reshaped market narratives by posting data on open interest relative to
The post Michael Saylor Credits Bitcoin for Strategy’s Outperformance Over ‘Mag 7’ Stocks appeared first on CoinGape.
]]>Bitcoin, Ethereum, XRP, Dogecoin Flat As Traders Hope For Altcoin Outperformance Benzinga
Source link ]]>
Dogecoin Surges After House of Doge Buys 10M Tokens For Strategic Reserve – Retail Sentiment Split Despite Bitcoin Outperformance MSN
Source link ]]>
Bitcoin’s Outperformance Could Leave Dogecoin, Shiba Inu Sidelined, But Propel Pepe, Dogwifhat, Bonk To New Highs MSN
Source link ]]>
Bitcoin’s Outperformance Could Leave Dogecoin, Shiba Inu Sidelined, But Propel Pepe, Dogwifhat, Bonk To New Highs Benzinga
Source link ]]>
Microstrategy, the world’s largest corporate holder of Bitcoins, witnessed its MSTR share price surging by 15% on Monday’s trading session and giving a close at $1,611. This rally follows the Bitcoin price pump to $65,000 as BTC registers double-digital gains just over the last three trading sessions.
MicroStrategy Outperforms Bitcoin
Microstrategy (MSTR) has outperformed Bitcoin at every stage throughout the last year and continues to do so even today. While the Bitcoin price is up by 13% on the weekly chart, the MSTR share has gained more than 22% in the last five trading sessions.
Since the beginning of 20224, the MSTR share price has gained by a massive 135% while Bitcoin has gained 44% during the same time. Similarly, on the yearly chart, the MSTR stock is up by a massive 258%.
Of course, this current outperformance of MicroStrategy comes due to the company’s massive Bitcoin holdings on its balance sheet. Furthermore, MicroStrategy recently announced the MSTR stock split in the ratio of 10:1 to make the stock accessible to investors after its massive run-up over the past year. Ever since MicroStrategy decided to hold Bitcoins as part of its reserves, MSTR has outperformed some of the top tech giants on Wall Street, including Nvidia (NASDAQ: NVDA).
To outperform $NVDA – get on the #Bitcoin Standard. pic.twitter.com/Dp361BFfPi
— Michael Saylor
(@saylor) July 15, 2024
Amid the recent recovery in the crypto market, supported by a strong rally on Wall Street, other crypto stocks like Coinbase (COIN) and Marathon Digital (MARA) have delivered strong gains in recent times.
Also Read: Coinbase, MicroStrategy, and Crypto Stocks Record Weekly Upswing
Crypto firms Adopt the Bitcoin Playbook
Following MicroStrategy’s success other small and mid-tier companies are also considering having Bitcoin holdings on their balance sheet and thus boost their share price. Metaplanet, also popular as Japan’s MicroStrategy, has accumulated 225 Bitcoin in the last two months buying during the BTC price dips. During this period, the share price of Metaplanet has surged by 500%.
“We’re seeing kind of post what’s happened with MicroStrategy, a whole bunch of particularly midcap companies, even nonprofits, come to us and say, ‘Hey look, we saw your announcement about your new registered investment advisor separately managed accounts’. They love that model for holding crypto,” said Abra CEO Bill Barhydt during a recent CNBC interview.
Also Read: Japan’s Metaplanet Buys Another Bitcoin Dip
The presented content may include the personal opinion of the author and is subject to market condition. Do your market research before investing in cryptocurrencies. The author or the publication does not hold any responsibility for your personal financial loss.

- LTC/BTC has been in a bearish trend for the last five years
- Bitcoin’s outperformance is likely to continue
- A descending triangle keeps the bearish bias intact
One of the most interesting markets to trade are cross pairs. Crosses are less liquid than major pairs and often move in tight ranges. This is a general rule for the classic currency market but also valid for cryptocurrency.
LTC/BTC is such a cross. It moves based on the differences in the prices of Litecoin and Bitcoin.
Since 2018, the market has been in a bearish trend. It means that Bitcoin has quite outperformed Litecoin in the past five years.
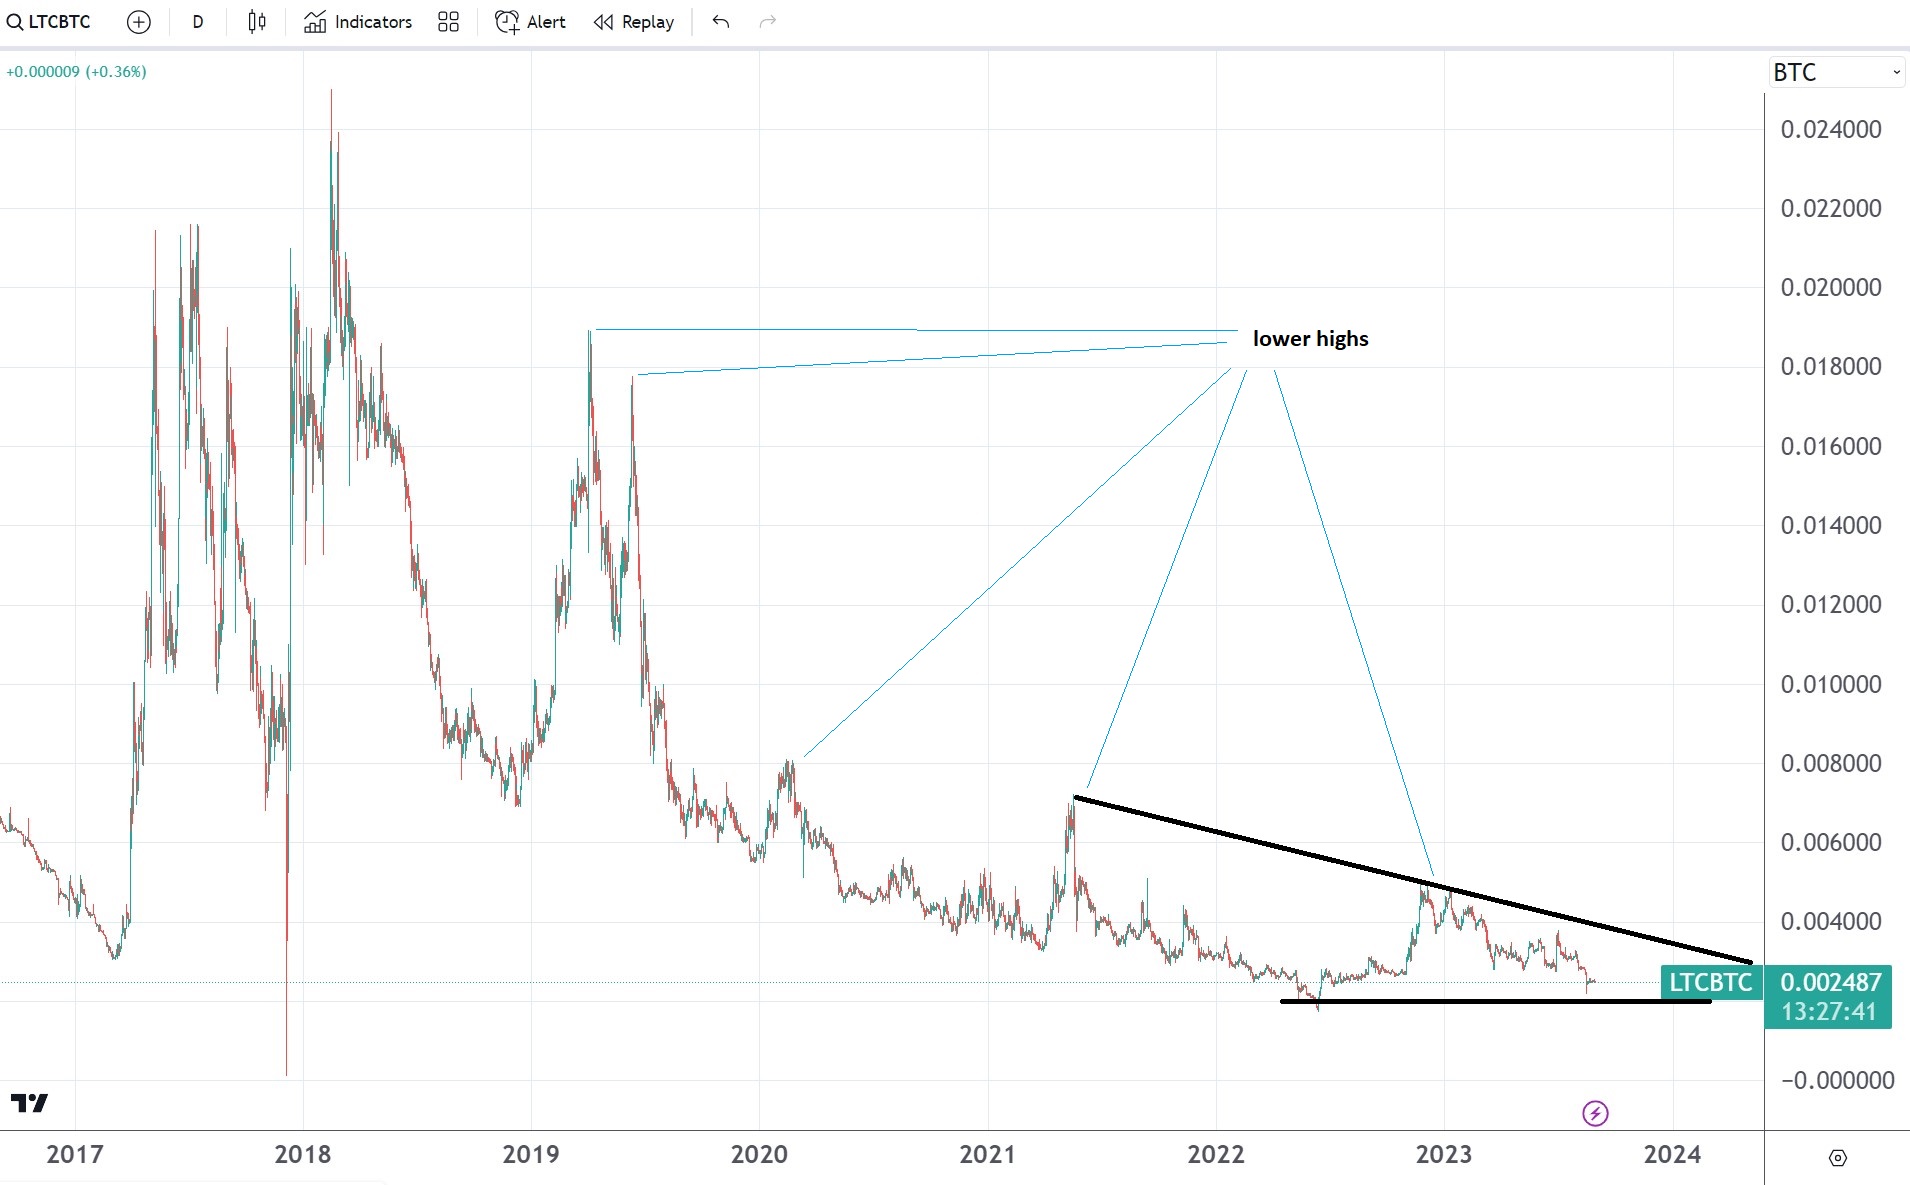
The chart above shows that the cross formed a series of lower highs and lower lows – characteristic in bearish triangles. Also, the bearish bias remains strong due to the presence of a descending triangle.
A descending triangle is a bearish continuation pattern. Its measured move equals the size of the longest segment of the triangle, projected from the horizontal base.
Therefore, traders may want to wait for the triangle to break lower before shorting the cross with a stop at the previous lower high.
What moves a cross?
Other rates influence a cross pair’s movements. In this case, the LTC/BTC cross pair reflects the differences between the LTC/USD and BTC/USD pairs.
Because the cross is in a bearish trend, Bitcoin outperformed Litecoin in the last five years. In other words, it means that Bitcoin was a better investment than Litecoin. Given the bearish bias for the cross, Bitcoin’s outperformance should continue.
✓ Share: