Ethereum has pushed above the $3,350 level, injecting fresh momentum into the market after weeks of uncertainty. Yet despite this breakout, overall sentiment remains clouded by fear, with many analysts still warning that the broader structure points toward a developing bear market. Traders now find themselves at a pivotal juncture: is this the beginning of a sustained recovery, or merely a temporary rally before further downside?
Related Reading
According to a new CryptoQuant report, one of the most revealing indicators right now is Ethereum’s funding rate behavior across major exchanges. Unlike the explosive funding spikes seen during the two major rallies earlier this year, the current move shows a remarkably restrained funding environment. During those earlier surges, funding rates climbed aggressively into overheated territory, signaling euphoric long leverage and speculative excess — conditions that closely preceded short-term market tops.
This time, however, funding remains far more subdued. The absence of aggressive long positioning suggests that the current rally is not being driven by excessive leverage, which gives the move a different character compared to earlier spikes. Whether this signals healthier accumulation or simply a lack of conviction remains the core question as Ethereum approaches the next decisive phase.
Muted Funding Rates Highlight a Cautious But Potentially Constructive Rally
The CryptoQuant report highlights that, unlike previous explosive rallies, Ethereum’s current funding rates remain unusually low, even after its sharp recovery from the $2.8K region. This subdued funding environment signals that the derivatives market is not yet saturated with speculative long positions.
Buyers are stepping in, but modest leverage drives this move compared to past phases dominated by aggressive traders. Consequently, spot accumulation drives the current advance more than overheated futures activity.

This difference carries important implications. Without a surge in speculative demand, Ethereum may struggle to ignite the kind of full bullish continuation leg seen in earlier breakout cycles. Historically, strong uptrends have required funding rates to expand meaningfully as traders chase price, forcing shorts to cover and fueling upward momentum. That behavior has not yet emerged in the current structure.
However, this muted landscape is not inherently bearish. Instead, it reflects a recovering market, not an overextended one. This leaves Ethereum with room to climb further — if demand strengthens. At the same time, the lack of leverage means the rally remains vulnerable; strong resistance rejections could quickly weaken momentum unless fresh buyers step in.
Related Reading
Testing Key Resistance as Momentum Builds
Ethereum’s daily chart shows a notable shift in momentum as the price pushes toward $3,320, extending its rebound from the sub-$2,800 lows. This recovery phase has been steady rather than explosive, reflecting a market that is stabilizing but still facing key overhead challenges.
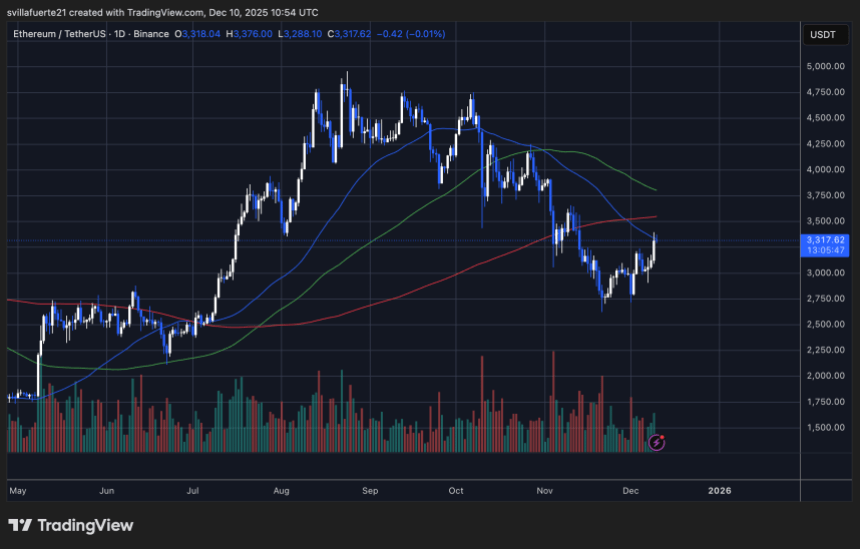
The first major test is the 200-day moving average (red line), which ETH is now approaching after several weeks of trading below it. Historically, reclaiming this level has marked the transition from corrective phases into renewed bullish cycles, but a clean breakout is far from guaranteed.
Related Reading
The structure of the recent move highlights improving buyer confidence: ETH has formed a series of higher lows, indicating accumulation after the capitulation-like November drop. Although buyers are active, the relatively subdued volume profile suggests they lack broad-based conviction. A stronger influx of volume must flip the trend decisively bullish.
The 50-day and 100-day moving averages remain above the current price and are both aligned downward, reinforcing that ETH is still technically in a broader downtrend. For momentum to extend, Ethereum must break above the $3,350–$3,400 resistance zone, where prior support turned into resistance.
Featured image from ChatGPT, chart from TradingView.com

Ethereum is now at the center of market attention as Bitcoin fails to confirm a breakout above its all-time highs. While BTC’s momentum stalls, altcoins are struggling to extend their strength, leaving Ethereum in a decisive position. Trading above $4,400, ETH is now less than 10% away from reaching new record highs.
Bulls remain confident in a continuation of the uptrend. Analysts argue that accumulation trends and strong on-chain activity point to further gains ahead. Exchange reserves continue to decline, while OTC desks show thinning liquidity, suggesting demand is outpacing available supply. This combination has historically preceded sharp upward moves.
However, risks are also growing as the market enters a new phase. With Bitcoin showing weakness near its highs, Ethereum’s ability to decouple and push forward will determine the direction of altcoins broadly. Some analysts view this as the beginning of a true altseason, while others warn that failure to sustain momentum could trigger a correction.
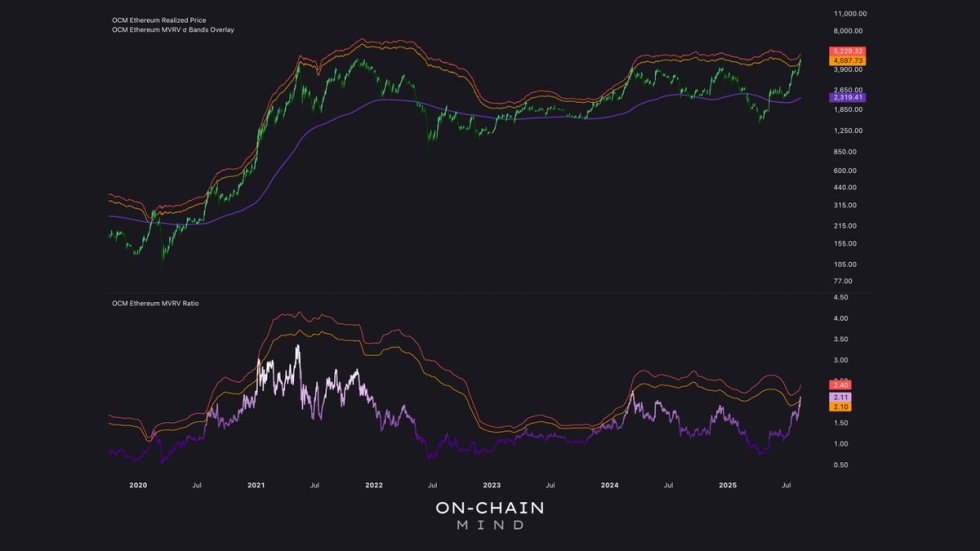
Ethereum MVRV Ratio Signals Potential Short-Term Pullback
According to top analyst On-Chain Mind, Ethereum’s MVRV ratio is moving into the +3σ to +4σ zone, a range that has historically marked overheated conditions and led to short-term pullbacks. This suggests that profit-taking pressure is likely to surface between $4,600 and $5,200, creating a critical test for ETH in the days ahead.
Despite these risks, Ethereum remains strong, less than 10% away from new all-time highs, and many analysts believe a breakout could still materialize. Some expect consolidation as short-term holders lock in gains, while others view the current setup as the prelude to Ethereum pushing decisively beyond its previous highs.
Institutional accumulation continues to accelerate, with large players treating ETH as both an investment and a strategic asset. Meanwhile, legal clarity across key jurisdictions has reduced uncertainty, creating a more stable environment for long-term adoption. At the same time, exchange supply has been steadily declining, signaling conviction among holders and reducing potential selling pressure.
If Ethereum breaks through resistance levels despite its overheated MVRV, it could spark a powerful continuation rally, potentially leading the broader altcoin market. However, if profit-taking dominates, a pullback would not weaken the bullish trend but instead set the stage for healthier continuation later.
Technical Details: Key Levels To Hold
Ethereum is showing remarkable momentum on the weekly chart, now trading at $4,447 after hitting a recent peak at $4,792, just below its 2021 all-time high. The price has surged above the 50, 100, and 200-week moving averages, with the 50-week SMA ($2,771) crossing decisively above the longer-term averages. This alignment confirms a strong bullish structure that historically precedes extended rallies.
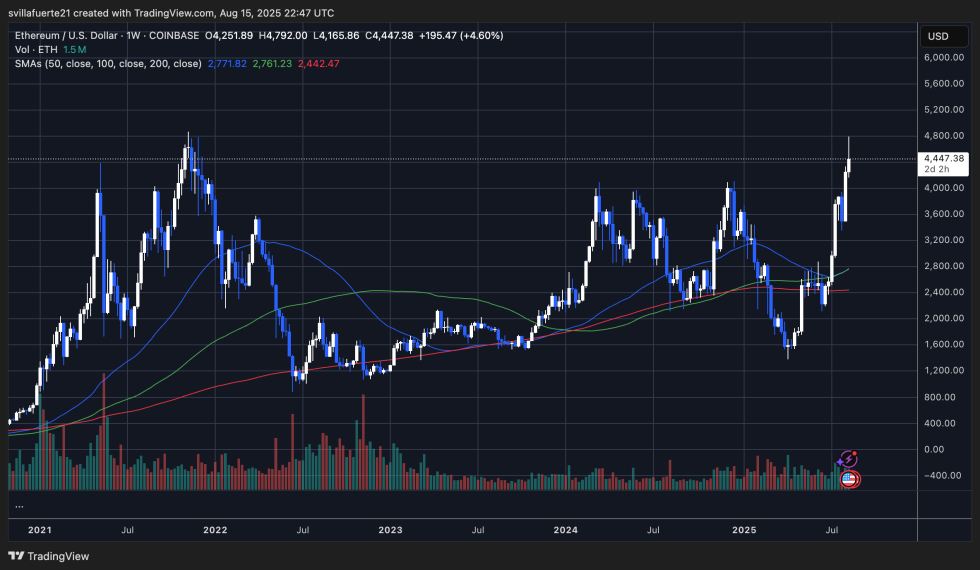
Volume has also expanded notably during this rally, reflecting strong demand and conviction from buyers. The breakout from the $3,600–$3,800 resistance zone has been followed by sharp upward momentum, showing that bulls remain firmly in control. However, Ethereum is now approaching historically significant resistance near $4,800–$4,900, where sellers could attempt to cap gains.
If ETH manages a weekly close above $4,800, the path toward fresh all-time highs above $5,000 becomes increasingly probable. On the other hand, failure to hold above current levels could trigger a healthy correction back to the $4,200–$4,000 support zone, where the 50-week SMA is now acting as a cushion.
Featured image from Dall-E, chart from TradingView
Editorial Process for bitcoinist is centered on delivering thoroughly researched, accurate, and unbiased content. We uphold strict sourcing standards, and each page undergoes diligent review by our team of top technology experts and seasoned editors. This process ensures the integrity, relevance, and value of our content for our readers.
A new report from Glassnode has revealed a historically significant Ethereum level that could mark the start of an overheated phase if breached.
Ethereum Is Moving Towards Active Realized Price
In its latest weekly report, the on-chain analytics firm Glassnode has talked about some valuation models for Ethereum. The models in question are the Realized Price, True Market Mean, and Active Realized Price.
Related Reading
The first of these, the Realized Price, refers to the average cost basis or acquisition price of all tokens of the cryptocurrency that are currently part of the circulating supply.
The other two models, the True Market Mean and Active Realized Price, also aim to find the network cost basis, but both of these exclude for the long-dormant coins. Such tokens are likely to be lost due to missing wallets keys, so they aren’t part of the economic supply. Thus, these models may provide for a more accurate measure of the market situation than the Realized Price.
Now, here is a chart that shows the trend in the three on-chain pricing models for Ethereum over the last few years:

As displayed in the above graph, the Ethereum Realized Price, True Market Mean, and Active Investor Price are situated around $2,100, $2,500, and $3,000, respectively. This means that at ETH’s current spot value, all models agree that the holders as a whole are in the green.
But now that the asset has escaped above these lines, what could be next? “In order to gauge upside targets for this ETH rally, we can turn to the +1 standard deviation band of Ethereum’s Active Realized Price,” notes Glassnode.
The +1 standard deviation (SD) band of the indicator happens to be where selling pressure has intensified in the past. The reason behind the trend may lie in the fact that investor profits become significant beyond this boundary, so mass selloffs with the purpose of profit-taking can become more likely to take place.
Below is a chart that shows where this level currently lies for ETH.

From the graph, it’s visible that the Ethereum Active Realized Price +1 SD is located at $4,500 today. ETH is currently still at a distance from the level, but if its recent bullish push continues, it might end up retesting it.
In the current cycle so far, ETH has tested the boundary once, in March 2024. Back then, the cryptocurrency found rejection at it. In the 2021 bull run, the coin was able to surge past it, but in doing so, it kicked off the unsustainable euphoria market phase.
Related Reading
“As such, $4,500 can be identified as a critical level to watch on the upside, especially if Ethereum’s uptrend continues and speculative froth builds further,” explains the analytics firm.
ETH Price
At the time of writing, Ethereum is floating around $3,600, up almost 7% in the last seven days.
Featured image from Dall-E, Glassnode.com, chart from TradingView.com
Bitcoin Flash Crashes, Ethereum, Dogecoin Gain As Overheated Crypto Market Takes A Breather: Top Analyst Asks Traders To Hold Positions And Buy Dips Benzinga
Source link ]]>
The market participants are witnessing sudden Bitcoin price movements because the bear market is officially coming to an end. While timing the market is a bad strategy, the Bitcoin market has some advantages such as on-chain historical data depicting exact days and patterns after which massive BTC price rallies can be expected.
BTC price fell 10% last week after surpassing the $30,000 psychological level, which signals the start of the “overheated bull phase” as bulls takeover bears. The recent BTC price rally from $20,000 was actually supported by Bitcoin entering the bull market cycle in January and crossing the key 200-weekly moving average (WMA) in March.

The recent declines in the Bitcoin price are due to profit-taking by traders in the perpetual futures markets, with open interest falling. The “long squeeze” caused massive liquidations, giving investors an opportunity to “buy the dip.” Traders also took profits as the ETH price jumped over $2,000 after the Shanghai upgrade on April 12 and Binance opened Ethereum withdrawals on April 19.
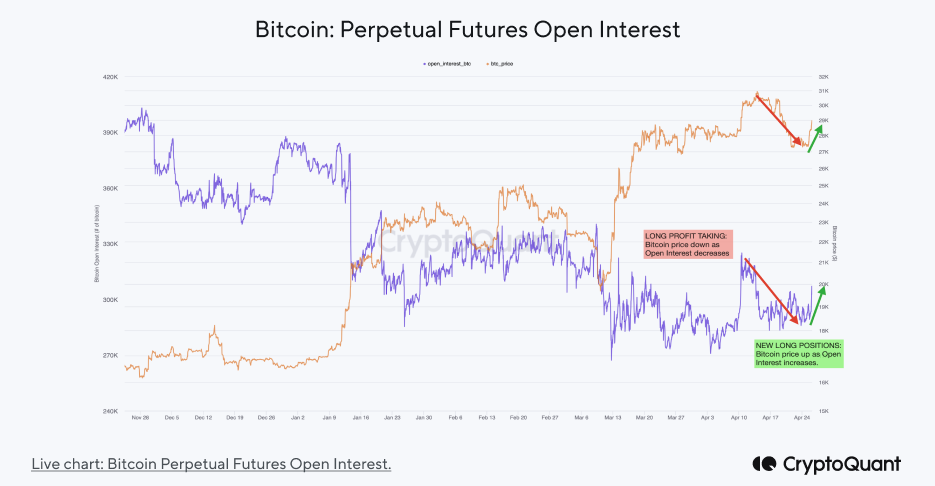
Traders have again started opening long positions and spending activity of whales remains higher. Typically, price rallies occur during whale spending activity with at least 20% of total coins being moved, but Spent Output Value Bands indicate whale spending activity rose above 40%. In fact, whales with over 10k BTC had a spending activity of 25%, the first time since the FTX fallout. This coincides with many dormant whales waking up after 8–10 years.
Bitcoin Price Begins Bull Run
Bitcoin price currently trading in the $28k-30k range, with volatility rising as the bull market starts. The short-term cost basis or the realized price is at $24,000, indicating the key support level for this bull market.

Traders wait for two key events before a rally can potentially start, Friday’s monthly expiry and the U.S. Fed rate hike decision on May 2. This could be the last rate hike by the Fed before it looks to cut the funds rate from September.
While the global market keeps an eye on the U.S. debt ceiling crisis, Republicans are actively working to increase the debt ceiling amid risks of a recession. The US dollar is also weakening, which will likely increase BTC prices.
With Bitcoin halving to happen in April 2024, the BTC price is likely to surpass $135,000 and probably we will never see BTC below $20,000 again.
Also Read: Crypto Market Recovery: Bitcoin and Ethereum Price Begins Major FOMO Rally
The presented content may include the personal opinion of the author and is subject to market condition. Do your market research before investing in cryptocurrencies. The author or the publication does not hold any responsibility for your personal financial loss.