
Ethereum (ETH) is inching closer to the $4,000 milestone, boosted by a perfect storm of factors including surging transaction volume, growing institutional interest, and bullish technical signals.
On August 7, ETH climbed to $3,718, backed by robust on-chain metrics. According to recent data, Ethereum processed 1.87 million daily transactions, its second-highest in history, driven by stablecoin usage, primarily USDC and Tether, and DeFi activity on platforms like Uniswap.
This spike follows the passage of the U.S. GENIUS Act, which has provided regulatory clarity for stablecoins, paving the way for greater adoption and institutional investment. Ethereum’s role as the backbone of DeFi continues to solidify, with stablecoin transactions on its network exceeding $50 billion in the past week alone.
Ethereum (ETH)’s Bullish Chart Patterns Suggest $4,000 Could Be Next
Technical analysts are now highlighting a bullish pennant formation on Ethereum’s chart, an indicator that could propel the asset toward $4,000 if confirmed.
This pattern, as explained by experts, forms after a sharp price move followed by a consolidation phase, typically leading to another leg upward.
In addition, Ethereum recently triggered a “golden cross”, where the 20-day and 50-day moving averages crossed above the 200-day moving average, a historically strong bullish signal last seen before the 2020–2021 bull run.
If ETH decisively breaks above $4,100, analysts forecast a significant breakout, potentially pushing prices toward $5,000 before year-end.
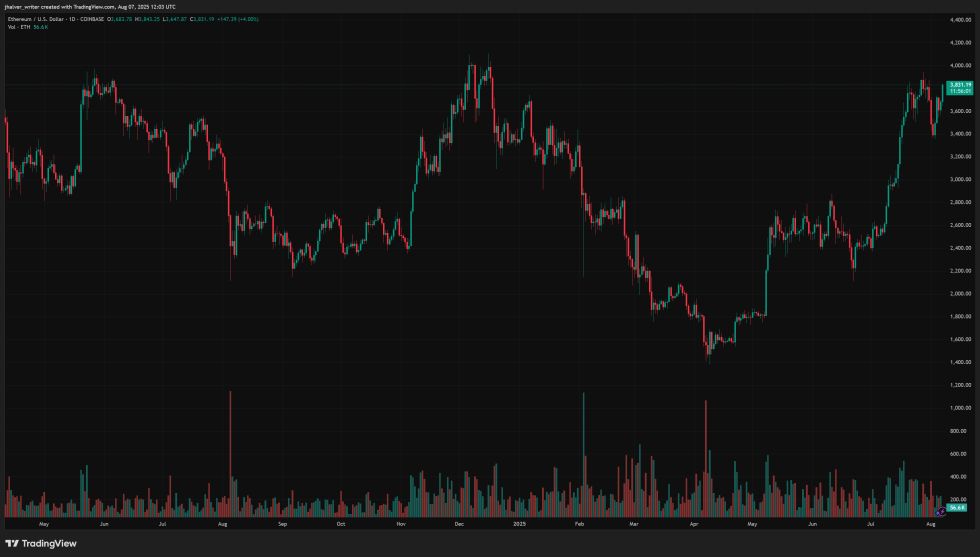
ETH's price trends to the upside on the daily chart eyeing the key level at $4,100. Source: ETHUSD on Tradingview
Altcoin Momentum and Institutional Demand Drive Market Surge
Ethereum is not rising in isolation. It’s leading a broader altcoin rally amid declining Bitcoin dominance, which recently dropped to around 60%. According to CMC data, Ethereum’s market share now stands above 11.9%, with ETH ETFs recording 19 consecutive days of net inflows.
Furthermore, corporate ETH treasuries have soared 127.7% in the past month, signaling growing confidence in Ethereum as a long-term asset.
Analysts caution that despite short-term volatility, strong staking yields, deflationary supply mechanics, and rising institutional interest set the stage for Ethereum to lead the next phase of the crypto bull market.
Cover image by ChatGPT, ETHUSD chart from Tradingview
Editorial Process for bitcoinist is centered on delivering thoroughly researched, accurate, and unbiased content. We uphold strict sourcing standards, and each page undergoes diligent review by our team of top technology experts and seasoned editors. This process ensures the integrity, relevance, and value of our content for our readers.
Cardano (ADA) Explodes From Bull Pennant — Can It Hit $1.60 Next? CryptoPotato
Source link ]]>
DOGE breaking out of bullish pennant; New AI coin aims to overthrow Cardano as king of DeFi Crypto News
Source link ]]>
Dogecoin Bull Pennant Breakout Targets 29% Rally to $0.31: Market Expert The Crypto Basic
Source link ]]>
Dogecoin Bull Pennant Signals Potential 22 Cent Breakout: Trading Analysis Blockchain News
Source link ]]>
Reason to trust
![]()
Strict editorial policy that focuses on accuracy, relevance, and impartiality
Created by industry experts and meticulously reviewed
The highest standards in reporting and publishing
Strict editorial policy that focuses on accuracy, relevance, and impartiality
Morbi pretium leo et nisl aliquam mollis. Quisque arcu lorem, ultricies quis pellentesque nec, ullamcorper eu odio.
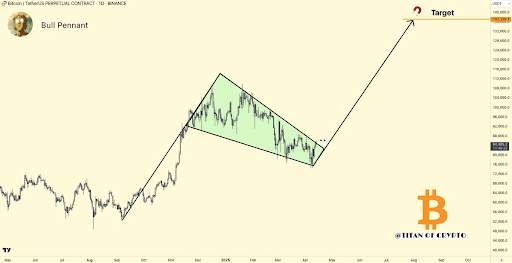
Crypto analyst Titan of Crypto has raised the possibility of the Bitcoin price rallying to as high as $137,000. The analyst highlighted a bullish pattern that shows the flagship crypto can reach this ambitious price target.
Bitcoin Price Could Rally To $137,000 As Bullish Pennant Forms
In an X post, Titan of Crypto suggested that the Bitcoin price could reach $137,000 at some point. This came as he revealed that BTC has formed a bullish pennant on the daily chart. The analyst remarked that if this plays out, a new all-time high (ATH) could be reached, regardless of the current market sentiment.
Related Reading
His accompanying chart showed that $137,129 was the target for the Bitcoin price as it eyes a rally to new highs. The analyst indicated the key was to see if the flagship crypto could break to the upside in the coming weeks. In the meantime, BTC looks to be facing a lot of resistance and bearish pressure.
In his Ichimoku cloud analysis of the Bitcoin price action, the analyst stated that BTC is now facing resistance with a fair gap value and entry into the Kumo cloud. He outlined two scenarios that could play out for the flagship crypto. The first is a continuation through the cloud, while the second is a retest of the Kijun and the trendline before continuation.
His accompanying chart indicated that the key was to break above the range of around $84,000. A successful breakout from this range could lead to a rally to as high as $92,000. This could eventually pave the way for the Bitcoin price to rally to new highs, especially with the psychological $100,000 level in sight once BTC reclaims $92,000.
Key Resistance At $86,000
In an X post, crypto analyst Ali Martinez revealed that $86,000 is a key resistance zone for the Bitcoin price. He stated that a rejection from this zone could send BTC back to $79,000. However, a breakout might open the path for the flagship crypto to rally to as high as $97,000.
Related Reading
Crypto whales are still actively accumulating BTC, which is positive for the Bitcoin price. Martinez revealed that 37,000 BTC have been withdrawn from exchanges in the past 24 hours, which the analyst noted is a strong signal of accumulation.
Crypto analyst Kevin Capital believes that the Bitcoin price structure is still bearish for now. In an X post, he stated that a break above $89,000 would mean BTC is back in action. Until then, he asserted that there is no real reason to get overly hyped at the current level.
At the time of writing, the Bitcoin price is trading at around $84,600, up in the last 24 hours, according to data from CoinMarketCap.
Featured image from Adobe Stock, chart from Tradingview.com
Cardano Price News: Bearish Breakout of Pennant Pattern Could Result in 18% Loss for ADA FX Empire
Source link ]]>
Cardano News: ADA Could Drop Below $0.600 Again as Bearish Pennant Pattern Pops Up FX Empire
Source link ]]>
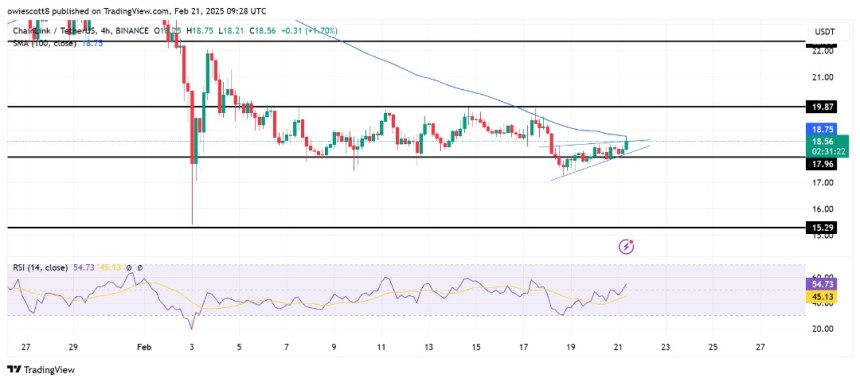
Chainlink (LINK) is flashing bearish signals as it forms a pennant pattern, hinting at a potential continuation of its downward trajectory. After struggling to gain bullish momentum, the price remains in consolidation, with sellers keeping a tight grip on the market. If this pattern plays out, LINK could be at risk of a steep drop, with key support levels facing increased pressure.
Market sentiment appears cautious, as bulls attempt to hold the line against growing bearish momentum. A breakdown from this structure might accelerate losses, pushing LINK toward lower price zones. However, if buyers manage to invalidate the pattern, a relief rally may be in play.
Analyzing Price Action: Bearish Pennant Signals Breakdown
Currently, Chainlink continues to trade within the confines of the bearish pennant pattern, indicating a state of indecision in the market. Neither the bulls nor the bears have established firm control, as the price remains constrained within converging trendlines.
Typically, this consolidation phase suggests that market participants are in a wait-and-see mode, anticipating a technical or fundamental catalyst for a decisive breakout in either direction.
While the structure of a bearish pennant typically signals a continuation of the previous downtrend, LINK’s hesitation indicates that bulls are still attempting to defend key support levels. Nevertheless, without a strong surge in buying pressure, the risk of a breakdown remains high.
If LINK breaches the lower boundary of the pennant with strong volume, an accelerated decline is likely, reinforcing the bearish outlook and increasing selling pressure. This breakdown could attract bearish momentum, pushing the price toward key support levels.
Additionally, the asset is currently trading below the 100-day Simple Moving Average (SMA), further strengthening the negative trend in the market. This positioning suggests that LINK’s ongoing attempts to regain upward momentum may face significant resistance.
Potential Breakdown Targets: How Low Can LINK Go?
The formation of a bearish pennant in Chainlink’s price action raises the possibility of further downside, with the measured move target and key support levels providing a roadmap for potential price movement.
Should the bears seize control and a breakdown occur below the lower trendline, LINK’s downward trend could accelerate, pushing the price below the critical $17.96 support level. This drop eyes a deeper decline toward the $15 mark, where buyers may attempt to regain momentum and prevent additional losses.
However, if bulls manage to defend these key levels and initiate a strong rebound, LINK might invalidate the bearish setup and shift toward a recovery, possibly targeting the $19.87 resistance level. A decisive move above this threshold would reaffirm bullish momentum and pave the way for more gains.
]]>Shiba Inu Price Prediction: SHIB Eyes Breakout With Bullish Pennant Forming; Why RBLK Will Continue To Grab Attention In February CryptoDaily
Source link ]]>