Market expert Mark Moss has drawn the crypto community’s attention to an indicator that has perfectly nailed Bitcoin cycle tops. Based on this indicator, the expert revealed that the cycle top is unlikely to happen this year, as other analysts may have predicted.
Pi Cycle Top Indicator Reveals Next Bitcoin Cycle Top
In an X post, Moss stated that the indicator is predicting a Bitcoin cycle top in the first quarter of 2027, not at the end of this year. He made this comment while describing the Pi Cycle Top indicator as the “Holy Grail” of Bitcoin indicators. The expert noted that the indicator nailed the Bitcoin cycle tops in 2013, 2017, and 2021.
Related Reading
Moss admitted that this latest cycle top prediction is hard to believe, as everyone is expecting Bitcoin to peak in the fourth quarter of this year. However, the Pi Cycle Top indicator suggests that the Bitcoin cycle top will occur in Q1 2027 and that the BTC price could reach $395,000 by then.
Crypto analyst Rekt Capital also recently alluded to the Pi Cycle Top indicator, noting how it was hinting at a possible cycle extension. He also confirmed that the indicator predicts a Bitcoin cycle top will occur in Q1 2027, with the flagship crypto possibly reaching $400,000. The analyst noted that, based on previous cycles, the Bitcoin cycle top is expected to happen in the fourth quarter of this year.
However, the recent BTC rallies have caused the Moving Averages (MA) to shift to higher prices. With these MAs shifting with every Bitcoin rally, Rekt Capital stated that it could take at least until mid-early 2026 before a Pi Cycle Top crossover occurs. However, the analyst advised that it is still important to be cautious about Q4 of this year and possibly develop an exit strategy in case the Bitcoin cycle peaks then.
The BTC 4-Year Cycle Is Over
In a recent podcast, Bloomberg analyst James Seyffart and Bitwise Chief Investment Officer (CIO) Matt Hougan gave their opinions on whether the 4-year Bitcoin cycle is over. Seyffart stated that he expects the amplitude of these cycles to reduce as more institutional investors enter the BTC ecosystem.
Related Reading
Based on his statement, a Bitcoin cycle top might not happen as many expect, as the analyst predicts there won’t be massive drawdowns again with the flagship crypto maturing. On the other hand, the Bitwise CIO opined that the 4-year cycle for BTC is over.
He explained that the factors that drove this four-year cycle are now watered down. Meanwhile, there is a growing inflow into Bitcoin, which would continue to drive demand. In line with this, Hougan declared that 2026 will be an up year for Bitcoin.
At the time of writing, the Bitcoin price is trading at around $119,000, down in the last 24 hours, according to data from CoinMarketCap.
Featured image from Pixabay, chart from Tradingview.com
Analyst Says Dogecoin Has Unfolded Perfectly, Targets 653% Surge to $3 The Crypto Basic
Source link ]]>
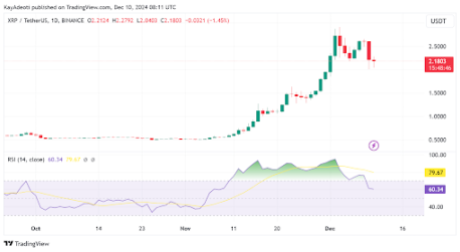
The XRP price action has played out notable volatility in the past eight or so weeks, with intense trading activity not seen in over six years. Following the U.S. presidential election on November 5, 2024, where Donald Trump secured victory, XRP’s value surged over 400%, reaching a peak of $2.90 on crypto exchange Binance on December 3.
However, the XRP price has experienced a downturn in the past week. Interestingly, this XRP price correction seems to be playing out an ABC correction path, with technical analysis suggesting a more downturn before the next leg up.
XRP Price Exhibiting ABC Correction
The XRP price correction since reaching the $2.9 mark has been highlighted by an ABC pattern that is almost nearing its end. Particularly, this pattern constitutes two downtrend waves A and C and a minor uptrend wave B in between.
Related Reading
According to the price chart below, which is of the XRP/US Dollar pair on the 4-hour candlestick timeframe, the first downtred wave A kicked off after the XRP price was rejected at resistance around $2.9 on December 3 up until it bottomed out around $2.16 on December 5, representing a 25% decline in two days. From there, it went on a minor uptrend wave B, which indicated that the bulls were still in action. Wave B culminated with a lower high at $2.65 on December 9, which translates to another 22% increase in four days.
Since reaching this lower high, the XRP price has kicked off another correction path in the past 24 hours, giving rise to the notion of corrective wave C now in action. If a similar trend were to play out like that of wave A, we could see the XRP price correcting by another 25% from $2.65, which would put the bottom just below $2 before another bounce up. This is very logical, considering that the $2 price level serves as a psychological threshold that the bulls would be preventing a break below.
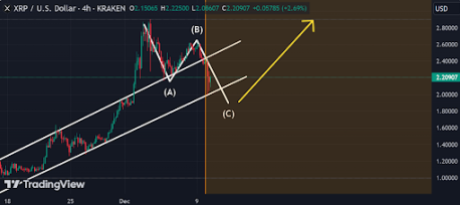
Bullish Impulse Suggests Next Move To $2.8 And Beyond
At the time of writing, the XRP price is trading at $2.19 and is down by almost 10% in the past 24 hours. The ongoing wave C, which is the final leg of the ABC corrective pattern, could continue on a downtrend until it reaches resistance at $2. Technical indicators support this outlook, especially the Relative Strength Index (RSI).
Related Reading
The RSI has slipped below its overbought zone for the first time since November 10. This signals a cooling off of the bullish momentum that propelled XRP to its recent highs, paving the way for the corrective wave C to run its course.
Despite this pullback, market dynamics suggest that a bounce from the $2 level is a strong possibility. Such a rebound could mark the beginning of a renewed bullish wave and drive the XRP price toward $2.80 and beyond. This scenario aligns with the broader outlook for XRP, which is still rolling in investor optimism regarding regulatory clarity after a new US presidential administration comes into power in January 2025.
Featured image created with Dall.E, chart from Tradingview.com
Market Insider Who Perfectly Timed Shiba Inu’s Monster Rally in 2021 Spotted Making Heavy Moves Into New Meme Coin—Next SHIB? Finbold – Finance in Bold
Source link ]]>
Bitcoin, Ethereum, Dogecoin Playing Seesaw: ‘Read Past Bitcoin Cycles…We’re Perfectly On The Path To The Moon,’ Trader Says Benzinga
Source link ]]>
How Dogecoin, Shiba Inu whales “perfectly foreshadowed” the current dump Cryptopolitan
Source link ]]>
Bitcoin price continues to stagnate and move sideways, but according to the cryptocurrency following an Elliott Wave market cycle, a break in the boredom is due soon.
Price action follows the predicted path so perfectly, that when layering Bitcoin directly over the comparison, there is little room for doubt about what comes next for crypto. Take a look for yourself and decide.
All About Elliott Wave Theory And The Guideline of Alternation
Bitcoin is maturing with each passing bull cycle, but it remains a speculative asset. As such, narratives tend to drive the price action. When the cryptocurrency is bullish, it moves in a powerful parabolic impulse up. When things are bearish, the rollercoaster ride turns scary and many get ejected along the way.
Markets might seem like an unpredictable rollercoaster at times, but on several time scales, they can be quite predictable. In the 1930s, Ralph Nelson Elliott developed what he referred to as Wave Principle. According to Wikipedia, “Elliott stated that, while stock market prices may appear random and unpredictable, they actually follow predictable, natural laws, and can be measured and forecast using Fibonacci numbers.”
Related Reading | Now Or Never: Bitcoin Builds Base At Decade-Long Parabolic Curve
Today, the study is more commonly referred to at Elliott Wave Theory. Each “wave” has a specific type of characteristic and guidelines. Waves alternate between bullish and bearish phases. Odd numbered phases are impulse waves that move in the primary trend direction, while even numbered waves are corrective phases that move against the primary trend.
In addition to waves alternating between positive and negative growth, they also alternate in their degree of severity. And according to the Guideline of Alternation, one correction is typically sharp, while the other is flat or sideways. When this exact example is projected over Bitcoin price action the path ahead looks a lot more clear.

If Bitcoin continues to follow the path, what comes next? | Source: BTCUSD on TradingView.com
What Is Next For Bitcoin When The Flat-Style Correction Ends?
The length of each correction is also different, according to Elliott Wave Theory. Sharp corrections tend to be over with a lot faster than a flat-style correction, which painfully grinds sideways. The market itself still has a sort of post-traumatic bear market syndrome from the severity of the sharp style correction, that it is expects the market to behave in the same manner yet again.
Related Reading | Time Vs Price: Why This Bitcoin Correction Was The Most Painful Yet
However, according to the Guideline of Alternation, the probability of two of the same type of corrections is extremely low. In rare situations, two sideways corrections occur, but never two sharp corrections. This suggests that whenever Bitcoin price finally does turn around, the corrective wave four should be complete and the grand finale wave five will begin.
What happens after wave five is complete? Another bear market, and likely the worst and longest in the history of Bitcoin.
Follow @TonySpilotroBTC on Twitter or join the TonyTradesBTC Telegram for exclusive daily market insights and technical analysis education. Please note: Content is educational and should not be considered investment advice.
Featured image from iStockPhoto, Charts from TradingView.com