Crypto analyst Mattsby has highlighted the best chart for market participants seeking the clearest macro picture for XRP. He also provided a bullish outlook for the altcoin, noting that a key resistance is now flipping into support.
This Chart Paints The Best Macro Picture For XRP
In an X post, Mattsby urged market participants to zoom out to the 2-month chart and add the 20SMA if they want to see the clear, well-defined macro trend for XRP. He noted that history shows that XRP has bullish momentum and room to run higher whenever it is above the 20SMA. On the other hand, the altcoin could be preparing for a potentially long, painful consolidation before the next big leg, as long as it remains below this level.
The analyst noted that XRP has been trading this key moving average since November 2024 and that what was once resistance is now flipping into solid support. He explained that this is why he is staying bullish on the altcoin despite the current price action. Mattsby added that support is holding and that the macro trend is intact.

Crypto analyst Chart Nerd also provided a bullish outlook for XRP. In an X post, he stated that after months of sustained pressure, multiple timeframes suggest bullish relief is on the table for XRP. He highlighted $1.54 and $1.87 as levels the altcoin could reclaim during this relief rally. He also noted that $1.560 is the immediate resistance that XRP could face on this rally to the upside. It is worth noting that XRP is already seeing a relief rally, bouncing alongside Bitcoin and the broader crypto market.
XRP Still Trapped Below A Key Resistance
In an X post, crypto analyst CasiTrades warned that XRP remains trapped below resistance, noting the altcoin has been ranging below $1.6 for over 68 days. In line with this, she declared that nothing has changed on the macro plan for XRP. It is worth noting that the analyst is currently bearish, predicting further crashes for the altcoin.
Related Reading
CasiTrades stated that, at the moment, there is a wait for XRP to do one of two things. The first could be a move down to the macro support levels at $1.09 and $0.87. Meanwhile, the second could be a break and hold above $1.65, which will flip the market bullish. Until then, she noted that the current price action is just continued chop, with XRP stuck in a tight range between $1.28 and $1.39. The analyst added that she expects continuation toward the lower supports once XRP breaks below $1.28.
At the time of writing, the XRP price is trading at around $1.43, up over 2% in the last 24 hours, according to data from CoinMarketCap.
Featured image from Sketchfab, chart from Tradingview.com
Dogecoin ETF Could Go Live in U.S. Soon, But DOGE Technicals Draw Bearish Picture For Now CoinDesk
Source link ]]>

- Tesla’s Bitcoin (BTC) holdings are now worth ~$1.2 billion after a 30% BTC price rally in Q2.
- A new US accounting rule (FASB) now allows Tesla to report the fair market value of its crypto holdings quarterly.
- Tesla has not bought or sold any Bitcoin for eight straight quarters, with its holdings unchanged at a cost basis of $184M.
Tesla’s significant Bitcoin holdings are now worth approximately $1.2 billion, thanks to a powerful 30% rally in the cryptocurrency’s price during the second quarter of this year.
This paper gain, highlighted by a recent change in US accounting rules, provides a bright spot in an otherwise challenging earnings report for the electric vehicle giant, which saw its core automotive revenue decline for a second straight quarter.
According to its latest earnings report, Tesla’s Bitcoin stash has benefited significantly from the crypto market’s recent strength. Bitcoin is currently trading at around $118,000, a substantial increase from its price of $83,000 on April 1.
Based on data from BitcoinTreasuries.Net, which lists Tesla as holding 11,509 BTC, the automaker is the tenth largest publicly traded company to hold the crypto asset on its balance sheet.
This gain is now more visible to investors due to a new rule approved by the Financial Accounting Standards Board (FASB). Effective from the first quarter of 2025, the rule allows companies to report the fair market value of their crypto holdings each quarter.
Previously, corporate holders like Tesla were required to report their crypto assets at the lowest value they reached during the holding period, a method that often failed to reflect market recoveries.
This meant that even if Bitcoin’s price rebounded, those gains would not be reflected on the balance sheet.
Now, Tesla’s Bitcoin gains can be recognized each quarter, providing shareholders with a much clearer view of the asset’s performance.
While its crypto holdings have appreciated, Tesla’s core business is facing significant headwinds.
The company reported second-quarter revenue of $22.5 billion, which, according to one set of figures in the source text, missed analyst estimates of $22.74 billion.
Adjusted earnings per share of $0.40 also reportedly fell below the expected $0.43.
A clear point of weakness was the company’s automotive revenue, which fell by 16% year-over-year, marking the second consecutive quarterly decline.
This follows a report from early July, in which Tesla had already disclosed a 14% drop in its Q2 vehicle deliveries, to 384,000 units.
The company’s stock performance reflects these struggles. Shares of TSLA are down roughly 18% this year, a stark underperformance compared to other big tech names and the broader Nasdaq Composite, which is up about 9% in 2025.
Adding to its challenges, Tesla has delayed its affordable “Model 2” EV, leaving the field open for its rivals.
Chinese EV makers, in particular, are aggressively pushing cheaper, tech-laden vehicles that are steadily eating into Tesla’s global market share.
The sound of silence: Tesla’s unchanged Bitcoin treasury
Despite the significant market value of its crypto holdings, Tesla did not mention Bitcoin once in its second-quarter 2025 financial filing.
This silence is not new. The company has not added to or sold any of its Bitcoin for eight consecutive quarters.
According to the 10-Q form filed with the SEC on July 23, the company’s digital asset holdings remain unchanged at a cost basis of $184 million, the same value it reported in the first quarter of 2024, with no impairment losses or gains noted this time either.
Tesla had initially made a bold move into the crypto space, purchasing $1.5 billion worth of Bitcoin in early 2021. Since then, however, it has sold off the majority of its holdings, with the last major sale occurring in the second quarter of 2022, when it offloaded roughly 75% of its BTC stash.
Despite the recent financial and political turbulence surrounding the company, Tesla appears to be holding firm on its current crypto position—for now.
But with mounting pressure from declining revenues and various reputational hits, investors will be watching closely for any future changes to the company’s digital asset strategy.
Following the earnings release, shares of TSLA were up a slight 0.71% in post-market trading, with the stock trading at $331.56.

Shiba Inu (SHIB) Paints Problematic Picture U.Today
Source link ]]>
Shiba Inu (SHIB) Key Indicator Paints Picture You Don’t Want to See U.Today
Source link ]]>

- Polygon erased all of its 2023 gains
- The technical picture is bearish
- Only a move above parity will change the bearish bias
What a ride it has been for Polygon investors. Since its inception, the cryptocurrency rallied strongly, only for the move to be faded.
Twice, it had tried at the $2.8 area, failing both times. The market has put a double top pattern there, as it was unable to break above the horizontal resistance area.
Following the double top, it all went wrong for Polygon investors. Another bearish pattern formed, a descending triangle, with a scary measured move for those that bought at the top.
The measured move sent the market all the way down to $ 0.4 before bouncing in the last part of 2022.
When cryptocurrencies rallied at the start of 2023 on the back of Bitcoin’s move higher, optimism emerged again. Polygon rallied, too, trading above $1.4, but those gains are long gone. However, Bitcoin still holds on most of its 2023 gains, which spells trouble for Polygon investors.
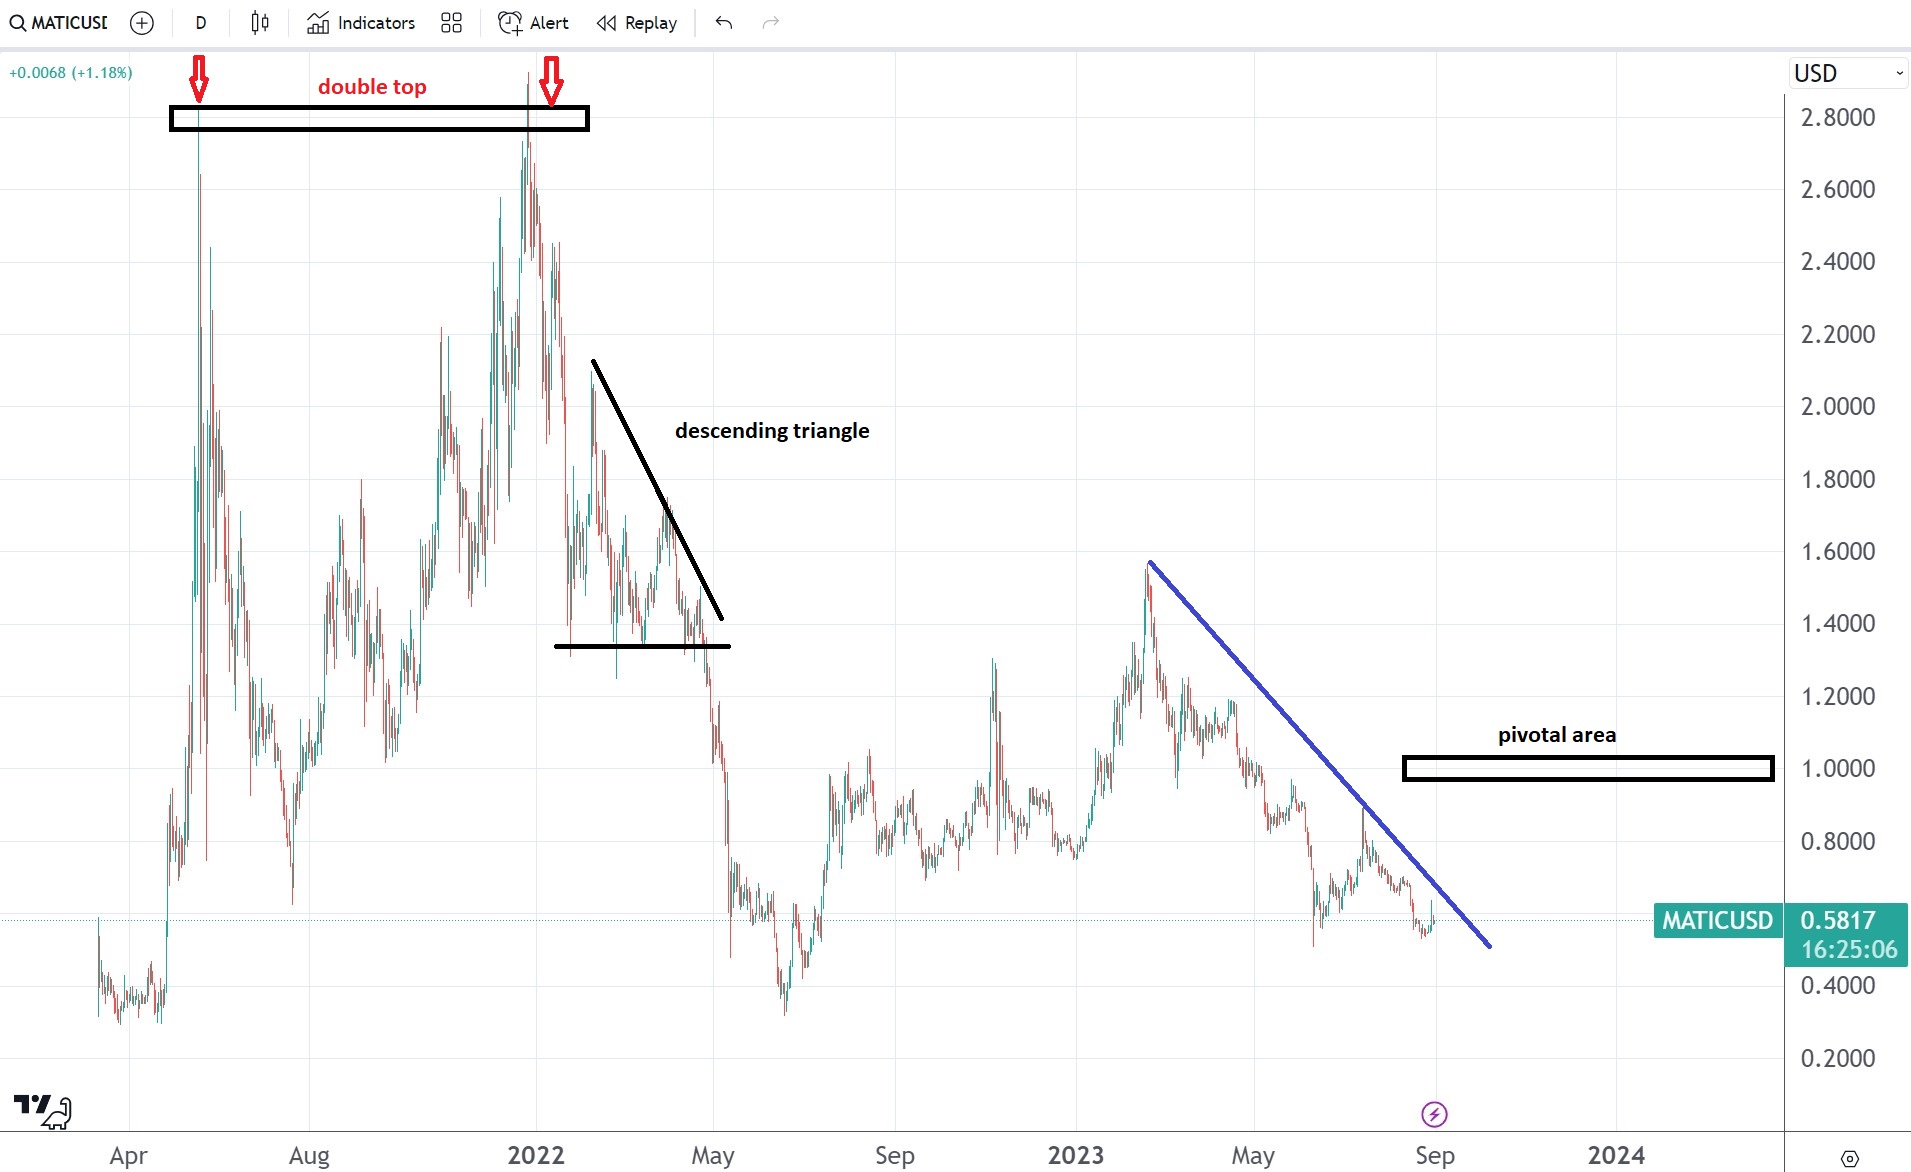
Polygon remains bearish while below $1
For the bearish bias to end, the market needs two things. First, it must break the bearish trendline on the chart above. Ideally, it should also break the series of lower highs.
Second, it must trade above parity with the dollar. That is a pivotal level; holding there builds energy for further advances.

Key Takeaways
- Crypto prices are rising sharply, with Bitcoin up 20% in the last three weeks
- The filing of a number of high-profile Bitcoin ETFs has pushed optimism in the market
- Under the hood, liquidity remains low and some worrisome trends emerge, however
- The regulatory woes are still present, with Coinbase and Binance facing a murky future
- The macro picture also remains uncertain, with the prospect of a lagged impact via tightening monetary policy looming large
It wouldn’t be like crypto markets to get overly excited. In the past couple of weeks, positivity has returned to the space, led by the seminal filings for a Bitcoin spot ETF by two of the world’s biggest asset managers, Blackrock and Fidelity.
Additionally, Fidelity were among a cohort of large trad-fi operators, including Schwab and Citadel, to back the new exchange EDX, which offers trading for Bitcoin, Ether, Litecoin and Bitcoin Cash.
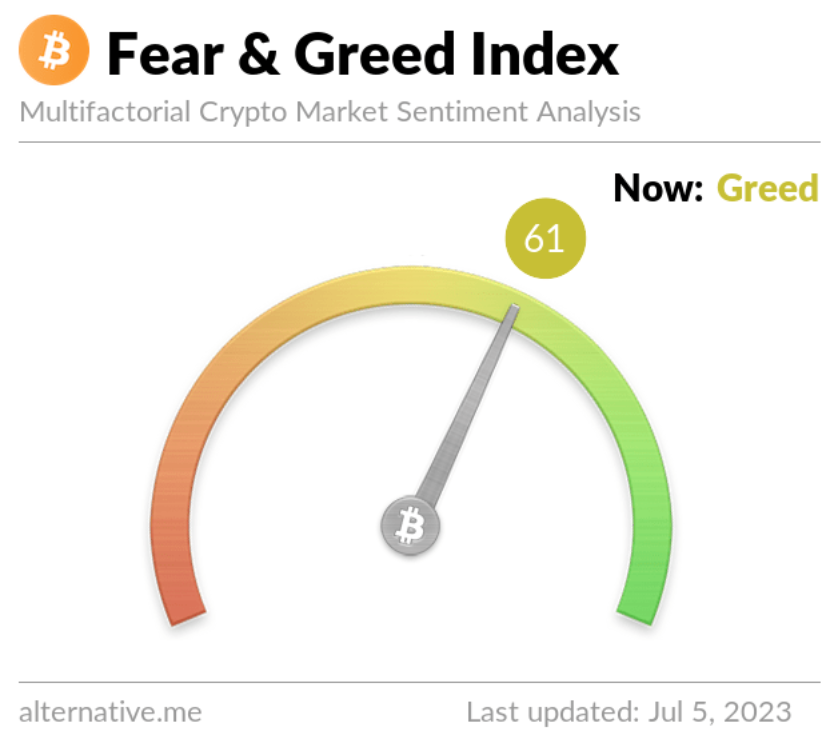
Bitcoin is up 20% in the last three weeks, breaching past the $30,000 mark, while Ether is up 16% in the same timeframe, approaching the $2,000 mark once more. A glance at the Fear and Greed index, an interesting metric which gauges overall sentiment in the space, shows it is markedly in the “greed” sector with a score of 61 (0 represents extreme fear, 100 represents extreme greed).
 And yet, a look under the hood betrays some concern. Firstly, if the filing of the ETFs is the reason for the recent ramp, as it appears to be, is a 20% jump justified? The SEC has declared the recent filings as “inadequate”, according to the WSJ, informing the Nasdaq and CBOE (who filed the paperwork on behalf of the asset managers) that there is not enough detail with respect to “surveillance-sharing agreements”. The SEC had previously said that sponsors of a Bitcoin trust are required to enter into a surveillance-sharing agreement with a regulated market of significant size.
While the applications can be updated and refiled (and the CBOE did indeed refile theirs since, with Nasdaq likely soon to follow) the development hints at how difficult it has been to get the much-coveted spot ETF over the line. There is no guarantee that these are approved, despite the big names involved – the SEC even rejected an application from Fidelity in the past, turning it away in January 2022.
In truth, it feels inevitable that Bitcoin spot ETFs will one day be traded freely, but a 20% jump on a mere filing in the last couple of weeks is a massive ramp when considering what else has happened in the space, and the state of markets, which we will delve into now.
Liquidity
Liquidity continues to lag, a factor which cannot be overstated – and indeed one which the eventual approval of spot ETFs should help.
Looking at centralised exchanges per data from Kaiko as we close out the second quarter of 2023, volume over the past three months was lower again, coming in at the lowest number since 2020, before Bitcoin and crypto embarked on their inexorable price rises and took the financial world by storm.
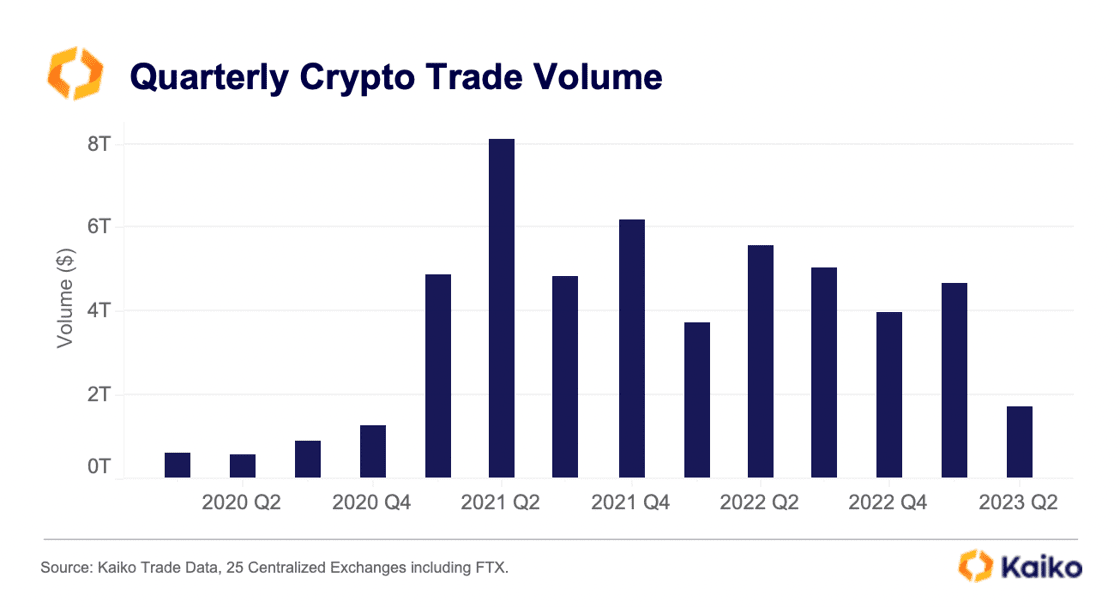
But with lower liquidity, moves to both the upside and downside are exacerbated. This has perhaps contributed to Bitcoin’s steep rise in the past few weeks, and also year-to-date, with it currently up 83%.
But liquidity and volumes being so low should be alarming for market participants. Much of the inroads made during the pandemic, with regard to Bitcoin taking its place next to bona-fide asset classes from a trading perspective, have slowed if not reversed – at least from a liquidity perspective.
As further evidence of this, in the below chart, I’ve presented the total balance of stablecoins across exchanges, which has fallen a staggering 60% in the past six months – an outflow of $26 billion.
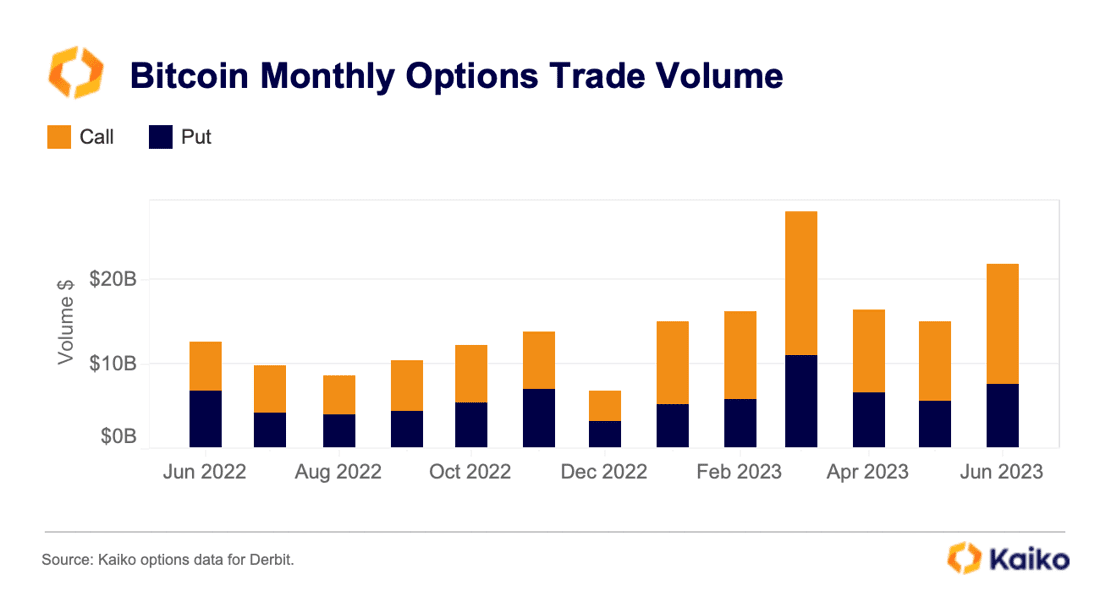
Having said that, there are pockets of optimism which hint at a brighter future if/when these spot ETFs do get approved. Looking at volume in derivatives markets, it has been rather consistent. In fact, it is markedly up on the second half of 2022. Perhaps this means the spot market has been greater affected by the regulatory crackdown. Either way, it’s a less gruesome picture than what we are seeing in spot markets.
Regulation
Right now, with regard to crypto-specific risk, it really all comes back to regulation. We have discussed the ETF filings, but June also brought two seminal moments: formal charges brought against Coinbase and Binance.
The two cases are extremely different, mind you. Binance’s lawsuit could not be less surprising, with the exchange constantly skirting guidelines and laws. The charges amount to a laundry list of different offences, including trading against customers, manipulating trade volume, encouraging users to circumvent geographical restrictions and securities violations.
It is the latter charge which is the centre of the suit against Coinbase, however, and the most pivotal of the lot. It is also why the Coinbase suit is far more intriguing. Do not forget that the allegations are coming from the SEC, the same body which presided over Coinbase’s IPO in April 2021. Why did the SEC let an unregistered securities exchange float on a US stock exchange? You tell me.
But let’s get back to the point: what this all means for crypto markets. While Bitcoin appears to be carving its own place out in the eyes of the law, a slew of other tokens were named as securities by the SEC. Despite this, they have risen sharply since off the Bitcoin ETF news. Does this make sense?
Conclusion
At the end of the day, crypto is going to crypto. Prices move, and trying to pinpoint reasons is often a fool’s errand. The last month, however, feels like we have seen an extremely aggressive price rise despite some bad news on the regulatory front.
Additionally, the macro picture has not changed much, even with the pause at the last Fed meeting. Fed chair Jerome Powell’s comments made it clear that this was a pause rather than an about-turn in policy.
“Looking ahead, nearly all committee participants view it as likely that some further rate increases will be appropriate this year,” Powell said when announcing the pause.
The market believes him. I backed out probabilities from Fed futures in the next chart, which show that there is currently an 86% chance of a 25 bps hike at the next Fed meeting in three weeks time, with only a 14% chance of rates being left unchanged again. I have presented this next to the same probabilities conveyed by the market exactly a month ago (Bitcoin is up 20% in the time since), showing softer forecasts do not explain the sharp price (the chance of no hike has actually come down).
As I said, crypto going to crypto. But with assets as notoriously volatile as what we see in this sector, it would be wise to stop and think about whether the sudden wave of positivity is justified. When considering the liquidity picture and the regulatory trouble, there are plenty of reasons to hesitate.
Then when one layers in the macro picture, the picture becomes murkier again. Let us not forget that we are in the midst of one of the swiftest rate hiking cycles in modern history, with rates rising all the way from zero to above 5%, and the prospect of them rising even further later this month.
Monetary policy operates with a lag, and the scale of that tightening is enormous. Sentiment may feel like it has flipped dramatically, but there is a long road ahead yet.

Key Takeways
- Spot volume remains low and liquidity thin in Bitcoin markets
- Only 2.7% of the supply has moved in the last week; 7% has moved in the last month
- This compares to 7% of the total supply of Bitcoins which are likely lost
- Uncertainty is high due to tightening regulation and the macro climate
- With institutions filing ETFs and launching exchanges, the liquidity picture may change drastically in the future
Market participants will know that if anything is true about the Bitcoin market over the last year, it’s that it has been incredibly illiquid.
Market depth was thin anyway by the time November 2022 rolled around. Then came the FTX implosion and an Alameda-sized hole in order books. Bankman-Fried’s trading firm was also one of the largest market makers around, and market depth has never recovered since its demise.
The effect has worsened in the last few months as a result of the regulatory clampdown in the US. We saw a host of market makers wind back operations in the US, including Jump Crypto and Jane Street in May (ironically, Bankman-Fried worked for the latter before founding Alameda).
We put together a data dive on this back in March, but in looking at the balance of stablecoins on exchanges below, we can see 60% have left exchanges in just over six months, amounting to $26 billion.
We can also see below that much of the volume earlier in the year was derived from Binance via zero-fee promotions. Once this promotion ceased, the futures-to-spot volume ratio jumped, highlighting that even that thin level of spot volume was propped up somewhat artificially by zero fees (chart via Kaiko).
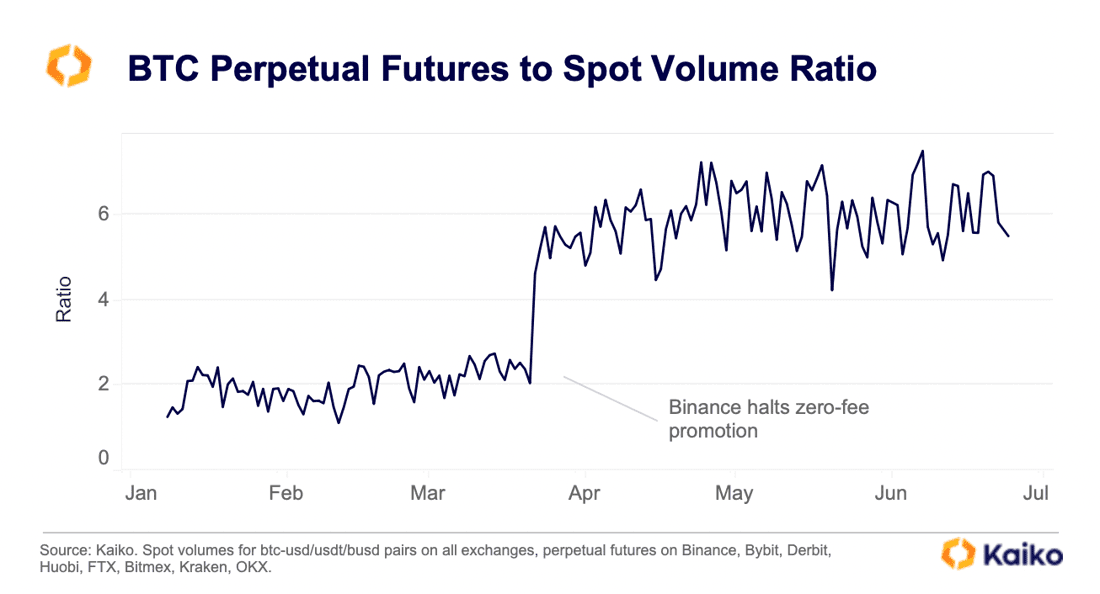
Indeed, one of the (many) charges facing Binance is that the exchange engaged in “targeted wash trading” to increase volumes. Therefore, the shallow volume could be even shallower in reality.
By now, we all know this. I want to take a moment to assess the supply side of the equation, however. From day 1, Bitcoin has possessed two qualities which make it ever-so-intriguing: a final capped supply of 21 million coins and a pre-determined schedule at which those coins are released (with the supply cap slated to be hit in the year 2140).
As of today, 92.4% of the Bitcoin supply has already been released. By pulling some on-chain data, I have plotted below the percentage of coins which have moved in the last month against the total supply. This gives some indication into how many coins are moving due to trading activity.
The chart shows 1.4 million coins have moved in the last month, equivalent to 7% of the circulating supply. In truth, one month is likely too broad a time horizon. Narrowing it to a (still conservative) one week in the next chart shows around half a million coins moving, around 2.7% on the total supply.
These charts highlight further how few Bitcoins are actually moving around these days. In fact, if I can use one more chart to illustrate the scarcity at play here, let’s look at this next one which layers in an estimate of lost coins. These lost coins are estimated by Glassnode and are coins which have been inactive since before the launch of the first Bitcoin exchange in July 2010 (as coins from pre-July 2010 are spent, this estimate converges to the real number of lost coins; it’s not a perfect measure, but a good estimate).
The chart shows that 7.5% of the total supply can be currently estimated as lost (Satoshi Nakamoto’s stash is included here). That means that it is roughly the same number as the amount of coins that have moved in the last month, and triple the number of coins that have moved in the last week.
Therefore, only a small portion of the supply is moving for Bitcoin. On one hand, this sounds bullish – one oft-repeated mantra within the space is that a dwindling supply will inevitably lead to an uptick in price. But this is only the case if the thin supply is matched by an uptick in demand.
When we look at order books and market depth over the last nine months, the shallow liquidity is a concern. However, there have been several important developments in the last two weeks that provide hope that this may change. Blackrock, the world’s largest asset manager, filed for a spot Bitcoin ETF, only to be swiftly followed by fellow giant Fidelity. There is also the launch of the exchange EDX, backed by trad-fi giants Fidelity, Schwab and Citadel.
Even the tightening regulatory noose around Binance could help provide a clearer picture for the future of the space and give investors confidence that something is finally being done to clean up the opaque nature of so much of the industry.
In conclusion, it feels quite likely that we will be looking back upon these uber-thin liquidity conditions in awe in a couple of years’ time. Uncertainty is extreme right now, both with regard to regulation but also the macro picture. There will come a day when that won’t be the case, and things may be very different as a result. But as of right now, it’s thin out there.
Shiba Inu (SHIB) Developer Looks at the Big Picture for the Dogecoin (DOGE) Rival, Warns Against Scammers The Daily Hodl
Source link ]]>
Crypto Market News: It would be an understatement to say PEPE Coin launch was successful. The memecoin craze in the last one week has been so high that it is standing put among the cryptocurrencies clocking highest transaction volumes. It hardly took the coin two weeks of time to break into the top 100 club of tokens with largest market capitalization. On Friday, PEPE crossed the $1 billion market cap, thanks to a 92% rise in the last 24 hours.
Also Read: New York Proposes Crypto Regulatory Bill “CRPTO”
Meanwhile, the daily trading volume for the cryptocurrency is highly impressive, overtaking some of the busiest cryptocurrencies. Also, other memecoins have also launched in quick succession after PEPE’s launch. As a result, the Ethereum gas fees went up to the 12 month high level.
PEPE Coin Trades Get $10 Million Worth ETH Gas Burn
According to Uniswap data, PEPE Coin traders have burned around 5,300 ETH worth $10 million in gas fee over the past 3 weeks. This was due to as many as 413,283 PEPE Uniswap transactions in the same period, which is since April 28, 2023. Meanwhile, CoinGape recently reported that crypto exchange Binance is about to list Pepe Coin. Binance said it will list two spot trading pairs PEPE/USDT and PEPE/TUSD on May 5, 2023.
Also Read: Cardano Scaling Tool Hydra Goes Live on Mainnet, Here’s What Comes Next
The presented content may include the personal opinion of the author and is subject to market condition. Do your market research before investing in cryptocurrencies. The author or the publication does not hold any responsibility for your personal financial loss.