As Ethereum (ETH) kicks off the year with a recovery past the critical $3,000 threshold amid a broader cryptocurrency market rally in early 2026, it continues to struggle against a key resistance level at $3,400. Currently, the second-largest cryptocurrency is entering a consolidation phase below this significant mark.
Technical analyst Ali Martinez has suggested that should the buying momentum observed in recent weeks persist, Ethereum could soon embark on a new rally that might bring it closer to reaching all-time high levels.
Ethereum Poised For Potential Price Breakout
In a recent update shared on social media platform X (formerly Twitter), Martinez pointed to on-chain indicators suggesting a fresh bullish sentiment among Ethereum investors. Notably, daily active addresses on the Ethereum network have surged, doubling to exceed 800,000 in just two weeks.
Related Reading
Martinez’s analysis further hints at a potential correlation with the rising demand for Ethereum exchange-traded funds (ETFs). Since December 29, these investment vehicles have accumulated approximately 158,545 ETH, a sum valued at around $520 million, adding to the positive outlook for the altcoin.
This heightened on-chain activity has created substantial support levels for Ethereum’s price action looking ahead, particularly between $2,772 and $3,109 that could prevent a new drop below these key marks.
Martinez believes that if these support levels remain intact and buying pressure continues, a breakout above the crucial $3,400 resistance could pave the way for a significant rally toward $4,000—representing an increase of approximately 24.33% from its current trading level of around $3,217.
What Lies Ahead For The Altcoin?
Other analysts, such as those from BitBull, share an optimistic view of ETH’s price trajectory. The analyst has identified a potential inverse head and shoulders pattern forming in the 10-day chart, which could lead to a bullish price target of $5,000. This projection implies a remarkable 55.48% increase, exceeding last year’s record highs.
However, despite these bullish forecasts, Ethereum’s price has fallen by 3% within a 24-hour period, according to CoinGecko data. The cryptocurrency has yet to demonstrate the bullish momentum necessary to meet these targets.
Related Reading
Another encouraging factor for investors looking for upward price movement is liquidity. Market expert Ted Pillows recently noted that, following Ethereum’s latest price drop, the maximum pain point appears to lean upward.

Historically, large investors and institutions have tended to “hunt” liquidity levels, which helps to reset positioning in the market and evacuate numerous retail investors.
With approximately $3.4 billion in short positions at risk if Ethereum successfully breaches the $3,400 mark in the days ahead, the possibility of a significant price movement looms.
Featured image from DALL-E, chart from TradingView.com
Shiba Inu Eyes Recovery: Analyst Pinpoints $0.000008 Support Level as Critical Coinpaper
Source link ]]>
Dogecoin Rally Ahead: Expert Pinpoints Timing For Next Major Price Surge, Here’s When | Bitcoinist.com Bitcoinist
Source link ]]>
Bitcoin, Ethereum, Dogecoin Recover Losses After Flash Crash: Analyst Pinpoints Critical BTC Support Levels Benzinga
Source link ]]>
ChatGPT 4.0 Pinpoints The Crypto Most Likely To Mimic The Famous 2021 500x Shiba Inu and Polygon Runs | Bitcoinist
Source link ]]>
Google Gemini Pinpoints Lunex (LNEX) Set To Outperform Cardano (ADA) and Avalanche (AVAX) Price Action! The Cryptonomist
Source link ]]>
According to data from CoinMarketCap, Bitcoin has had an unimpressive week with its market price falling by 4.65% over the last seven days. However, prominent crypto analyst Ali Martinez has released a price alert indicating that the market leader could be set for more losses if it fails to secure a certain support zone.
Related Reading
Bitcoin URPD Chart Shows Potential Correction – Analyst
In an X post on June 15, Martinez stated that Bitcoin needs to quickly rise above $66,254 else it risks a potential decline to around the $61,100 price mark. Martinez based his theory on the UTXO Realized Price Distribution (URPD) chart generated by the data analytics platform Glassnode.
#Bitcoin needs to climb back above $66,254 quickly to avoid a potential correction down to $61,100! pic.twitter.com/WMr7jcAVJU
— Ali (@ali_charts) June 14, 2024
For context, an unspent transaction output (UTXO) refers to units of Bitcoin that are unspent after a transaction. Each UTXO has a realized price i.e. the price the market price at the time of UTXO was transacted. In a UTXO Realized Price Distribution chart, Bitcoin’s supply is broken down based on the realized prices of UXTOs showing how much BTC was acquired at different levels.
This data can be used to study market sentiment, distribution analysis as well as support and resistance levels. More importantly, investor behavior can also be studied as a high concentration of UTXOs indicates levels at which most investors bought Bitcoin which can translate into a potential resistance or support level.
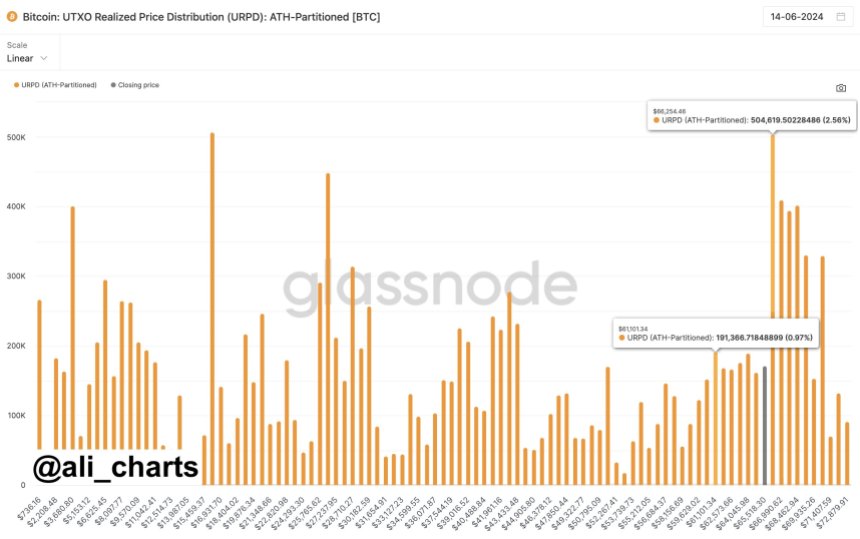
According to the URPD chart shared by Martinez, 504,619 BTC was purchased at $66,254 thus indicating a strong potential to serve as a support for Bitcoin amidst its current downtrend. Furthermore, the next realized price with the highest number of Bitcoin (191,366) bought is $61,101 representing the next support level should the premier cryptocurrency fail to reclaim the $66,254 price mark.
Related Reading
Bitcoin Price Overview
At the time of writing, Bitcoin trades at $66,151 reflecting a price decline of 1.15% in the last day. In tandem, the BTC’s daily trading volume is also down by 5.54% and valued at $25.4 billion. However, Bitcoin remains in the green on the monthly chart with a 5.80% gain which is a notable positive, especially for long-term traders.
According to Coincodex, the general sentiment is bearish nevertheless, the fear and greed index stands at 74 which indicates current optimism as well as risk-taking behavior among investors which highlights a potential for high market volatility.
Featured image from BBC, chart from Tradingview
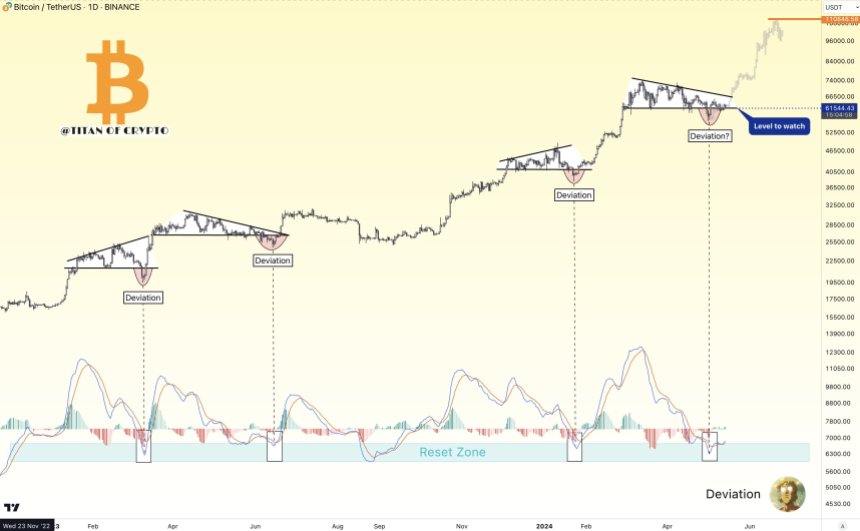
Amidst the recent decline in Bitcoin’s price and the general cryptocurrency market, popular cryptocurrency analyst and enthusiast Titan of Crypto has highlighted the $61,500 price level as a crucial threshold to watch for the largest cryptocurrency.
Titan of Crypto analysis examines the aforementioned level as a pivotal point for Bitcoin that could determine the coin’s next price trajectory.
$61,500, A Level To Watch For Bitcoin
Today, May 14, BTC witnessed a sharp decline to nearly $61,500, demonstrating little momentum for a price recovery. While many would see this as a worrying development, Titan of Crypto considers it a noteworthy development. He sees this level as significant and is one to watch out for for Bitcoin.
The crypto expert further warns of an impending volatility in the market around Federal Reserve Chair Jerome Powell‘s speech later today. Thus, Titan of Crypto has urged the community to remember that it’s better to hold off on making decisions until after the BTC daily candle closes and until the next one confirms the previous one.
The post read:
Bitcoin $61,500 is the level to watch. Expect volatility in the markets around today’s Powell speech. In any case, remember it’s wiser to wait for the BTC daily candle close and confirmation with the following one before jumping to a conclusion.
Although the expert anticipates volatility for Bitcoin, he is confident that the crypto asset’s bull run is far from over, suggesting a movement on the upside is still possible.
Related Reading
According to Titan of Crypto, Bitcoin’s Risk-Adjusted Return Oscillator (RAR) indicator has recently moved into the overbought area. However, the analyst asserts that this does not call for alarm, given that Bitcoin took over eight months to peak following the development based on previous bull cycles.
Looking at Bitcoin’s price action from the daily timeframe, the expert confirms that the digital asset is “looking good.” As a result, BTC is following the bullish target to unprecedented heights, specifically around $112,185. “This game is a zero-sum game where impatient people give their money to the patient,” he added.
Possible Retracement To $62,000
While Titan of Crypto anticipates a rally, Ali Martinez, another crypto, has predicted an early price retracement. The expert has highlighted the possibility for BTC to decline to $62,000 in the short term.
According to the analyst, the 4-hour chart’s 200 Exponential Moving Average (EMA) appears to be rejecting Bitcoin, whereas the TD Sequential indicator suggests a sell signal. Should the development be confirmed, Martinez expects BTC to drop to $62,000.
Related Reading
However, for BTC to witness an upward movement, it needs to maintain a 4-hour candlestick close above the $64,000 threshold. Thus, with the coin trading below the $62,000 level, Martinez’s prediction appears to have already manifested.
At the time of writing, the coin was trading at $61,512, indicating about 1.98% in the past day. Its trading volume was up by 9.67%, while its market cap was down by 2.65% in the last 24 hours.
Featured image from iStock, chart from Tradingview.com
Renowned market analyst Ali Charts recently shared his insights, predicting a bullish trajectory for XRP. Ali, known for his market predictions, anticipates that XRP is on the brink of a major breakout, potentially escalating to a significant price range shortly.
Expert Analysis Of XRP’s Movement
Ali Charts has recently turned the spotlight on XRP. In his latest analysis, Ali predicts a promising upturn for XRP, expecting it to break out from its “descending parallel channel.”
This optimistic forecast points to a swift climb, targeting the $0.65-$0.66 range. The analysis is backed by a detailed chart Ali shared, elucidating the potential breakout pattern XRP is forming.
This projection follows XRP’s peak performance on November 6, when it reached $0.72 per token – its highest valuation since late July.
Over the following weeks, XRP saw a slow downturn that brought its price to trade as low as $0.58 on Wednesday. However, the recent chart formations, as analyzed by Ali, suggest a potential reversal in this trend.
#Ripple | $XRP appears to be breaking out from a descending parallel channel, which may result in an upswing to $0.65 – $0.66 for #XRP. pic.twitter.com/gvfeEMKIDX
— Ali (@ali_charts) November 23, 2023
XRP Latest Price Action
Meanwhile, XRP has shown signs of a potential reversal from its recent ‘descending parallel channel,’ as indicated by analyst Ali. In the past 24 hours, the token has experienced a 2.9% uptick, climbing from its low of $0.58 seen yesterday to a current trading price of $0.61 at the time of writing.
This shift hints at a developing bullish momentum, aligning with Ali’s prediction of an imminent surge beyond the $0.65 mark. Notably, should the token’s price continue this upward trajectory, it could significantly bolster Ali’s analysis, possibly setting the stage for the digital asset to revisit and potentially surpass the $0.72 price level.
Such a development would confirm the accuracy of Ali’s forecasts and inject renewed investor confidence in XRP. However, it’s important to contextualize these recent gains against the broader picture.
Over the last two weeks, the altcoin has recorded a decline of over 10%, with a 2.7% decrease in the past seven days. This overall bearish trend is mirrored in the trading volume, which has notably reduced.
Specifically, XRP’s daily trading volume has fallen from a high of approximately $2.4 billion seen earlier this month to around $1.1 billion in the last 24 hours. This dip in trading activity could indicate a cautious approach from investors, awaiting clearer signals of market direction before committing further, or maybe a regular trading activity in the asset.
Featured image from Unsplash, Chart from TradingView
In a detailed chart analysis of the XRP/USD trading pair, seasoned crypto analyst Dark Defender has shed light on several significant indicators that point towards a bullish trajectory for the popular cryptocurrency.
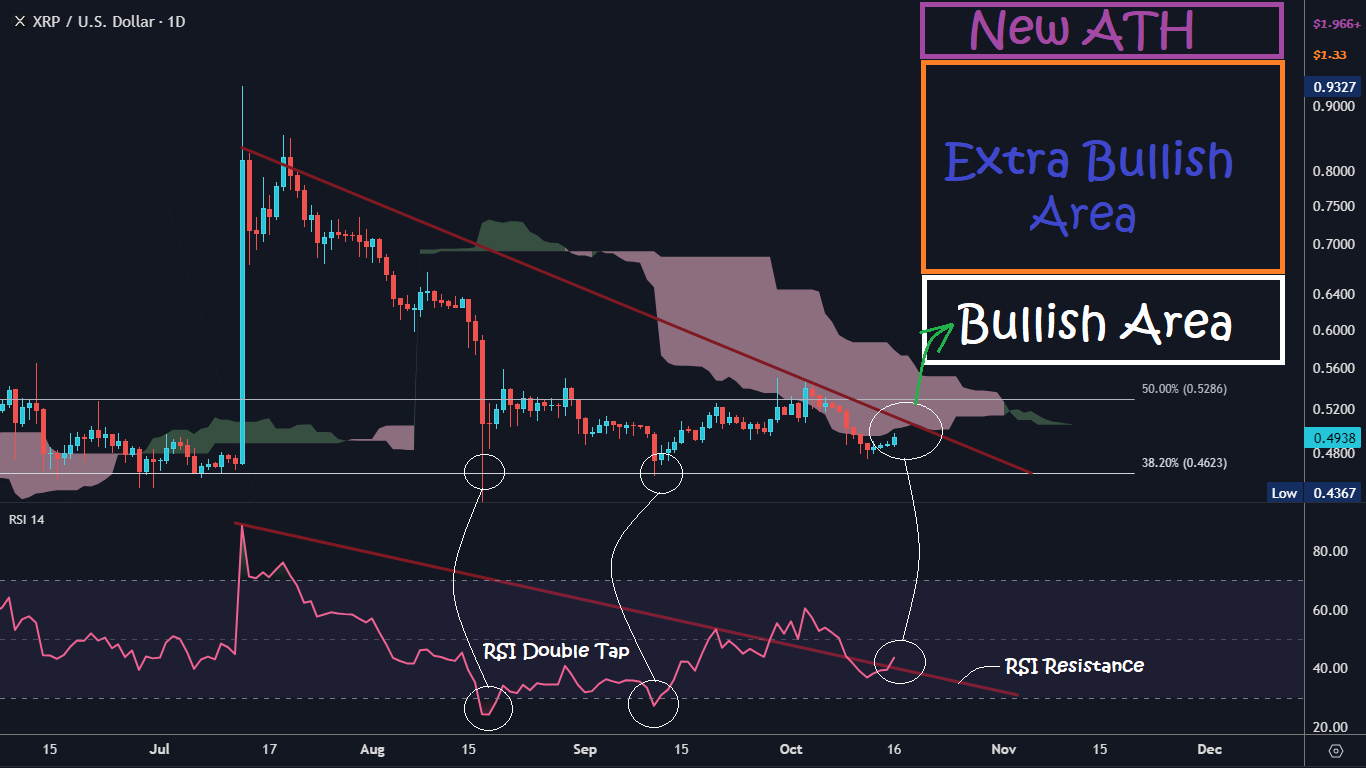
Taking to Twitter to share his insights, Dark Defender remarked, “Morning All. Hope you had a great weekend. XRP in the daily time frame is still within our price range. Above $0.52 – $0.55 is a challenge, first to break the resistance & stay above the Ichimoku Clouds.”
This sentiment aligns with the depicted interaction of XRP with the Ichimoku Cloud on the chart, a renowned technical tool that offers insights on support, resistance, and momentum. Furthermore, the analyst outlined specific price brackets, stating that XRP is: “Bullish above $0.55 – $0.66, Extra Bullish between $0.66 – $1.33, and envisions a New All-Time High Above $1.966.” These delineations echo the marked areas on the chart, notably the “Bullish Area” and “Extra Bullish Area.”
When To Get Extra Bullish On XRP
One of the primary takeaways from the chart is the “RSI Double Tap” event. For those unfamiliar, the Relative Strength Index (RSI) is a momentum oscillator that measures the speed and change of price movements. An RSI reading below 30 is typically considered oversold, while an RSI above 70 is seen as overbought. The “Double Tap” indicates that XRP has been undervalued in mid-August and mid-September, but found a strong foundation.
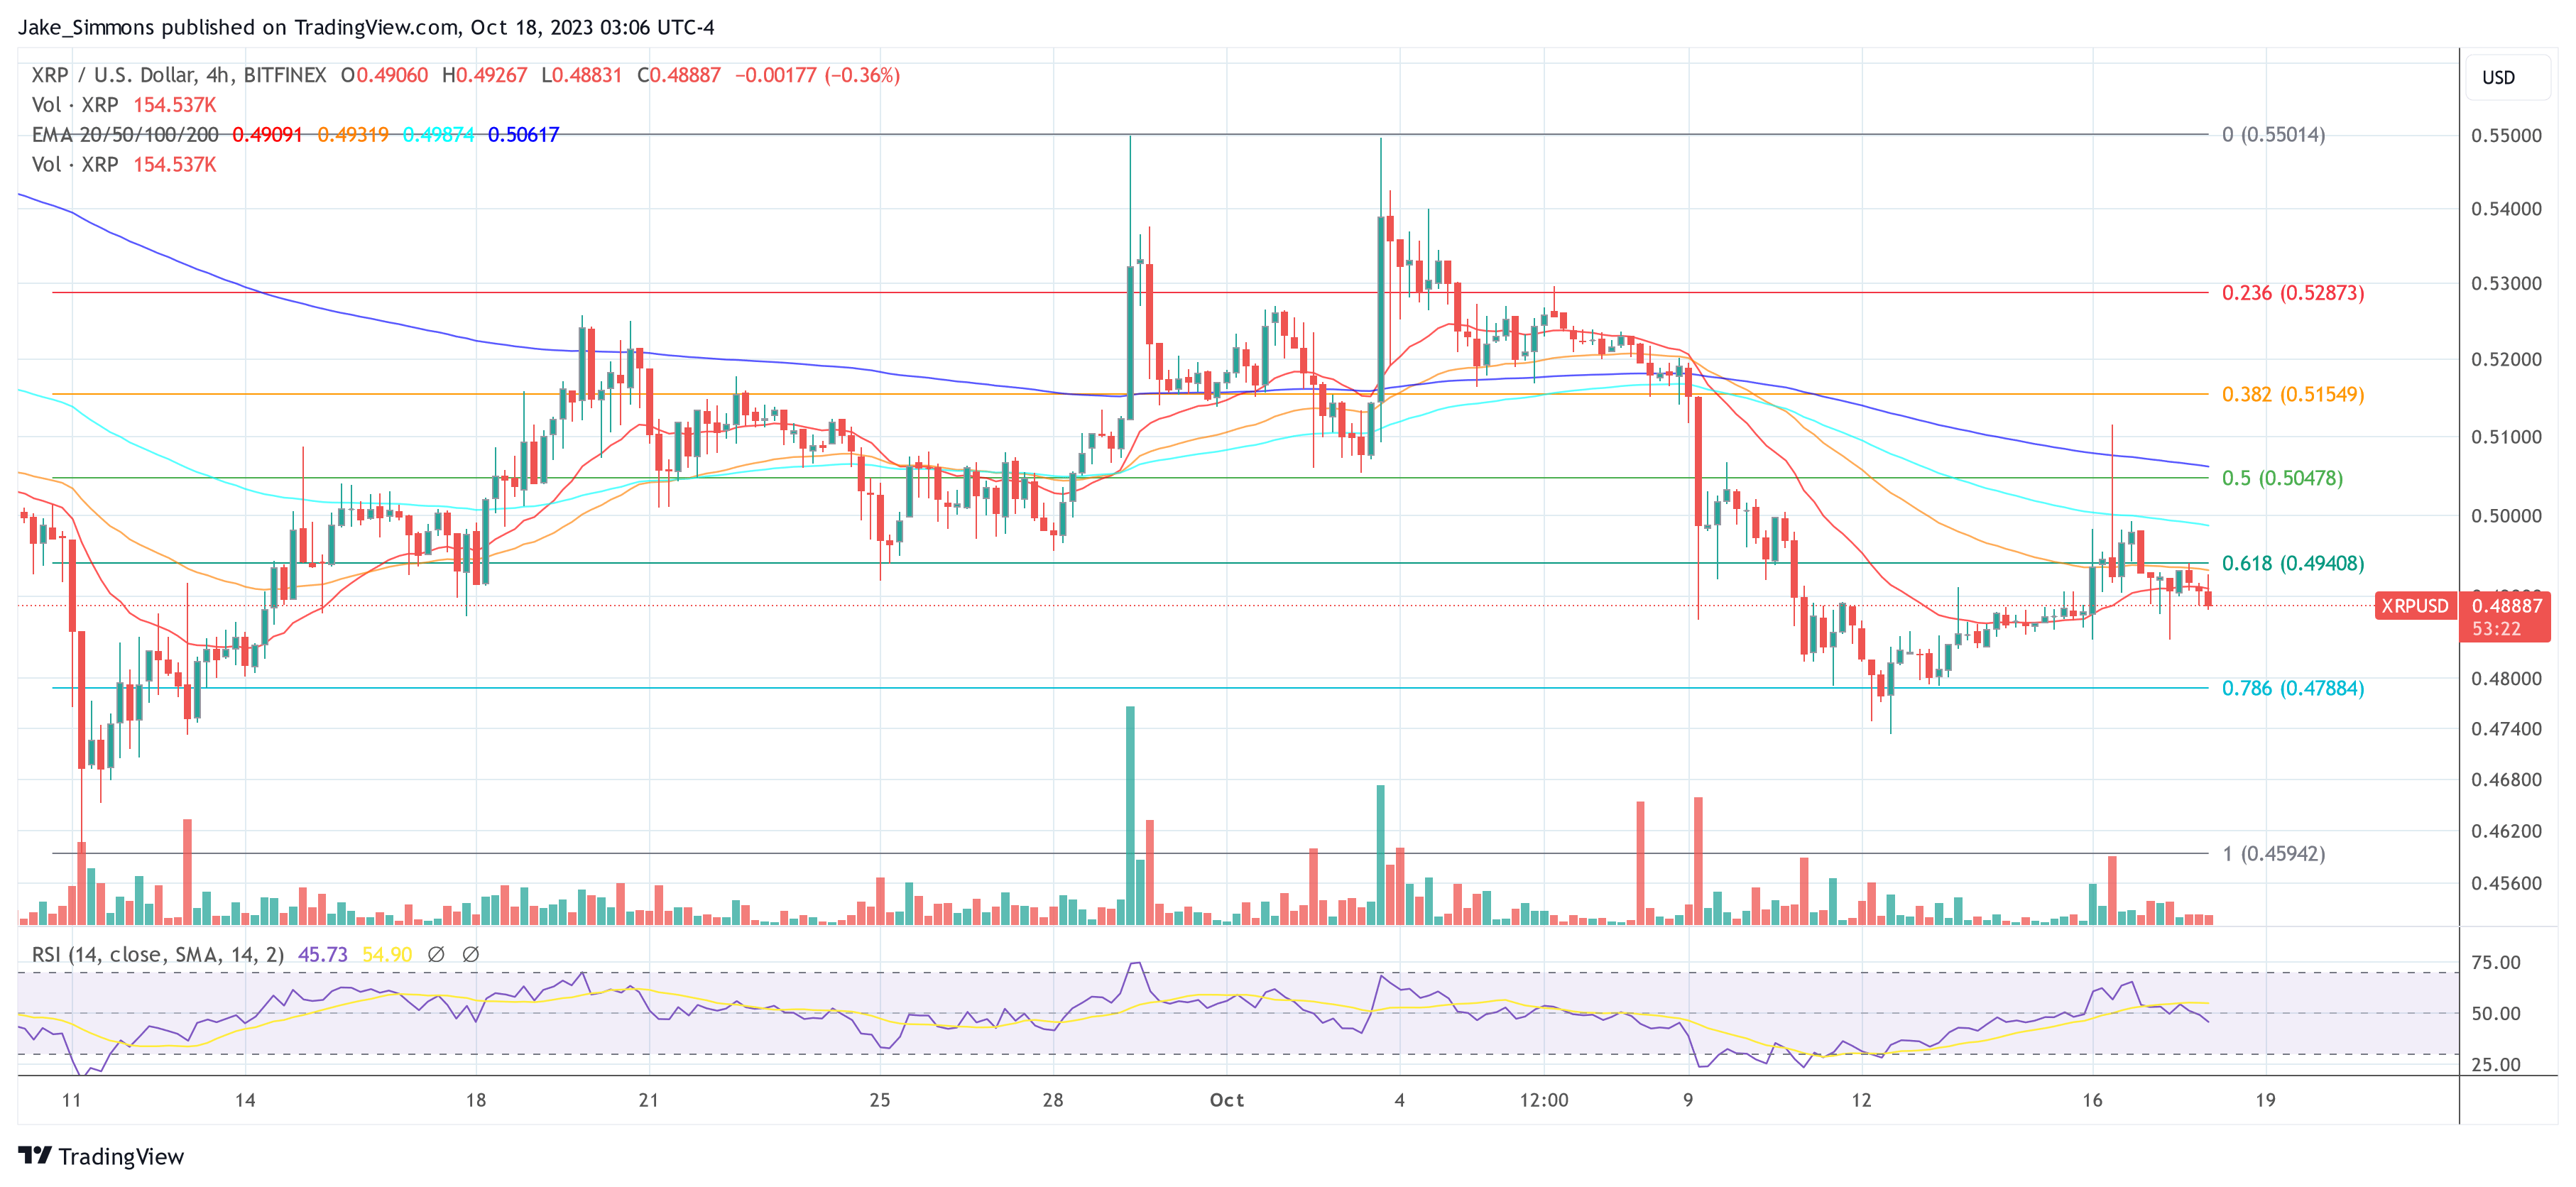
Further boosting the bullish sentiment is the declining trendline in the RSI that the XRP price recently broke out of, implying a potential shift in momentum. Remarkably, the RSI broke out of the downtrend for the first time at the end of September.
However, the XRP price could not keep this momentum, and as a result, the RSI once again fell below the trend line drawn by Dark Defender. But in recent days, another breakout has occurred, which could predict bullish price movements.
Moving onto the price action, the chart depicts XRP’s consistent interaction with the Ichimoku Cloud, a renowned technical tool that offers insights on support, resistance, and momentum. The fact that XRP is inching closer to entering the ‘Bullish Area’ of the Ichimoku Cloud is quite significant. This could mean that the asset is on the verge of a bullish reversal if it climbs back above $0.52.
Moreover, the chart also demarcates two distinct areas labeled “Bullish Area” and “Extra Bullish Area.” The latter is situated between the $0.66 and $1.33 mark, suggesting that if XRP manages to break above the lower boundary and hold above this price point, we might witness intensified bullish momentum. The XRP price could then more than double before major resistance is expected at the $1.33 level by Dark Defender.
Additionally, the Fibonacci retracement levels, drawn from the peak to the trough of the price movement, emphasize the 50% level at $0.5286 as a critical resistance point. Breaking through this level might propel XRP toward the “Extra Bullish Area” as specified by the analyst.
Concluding his tweet, Dark Defender aptly stated, “The clock is ticking,” indicating the expectation that the cryptocurrency could perform a strong bullish move into the “Bullish Area” between $0.55 and $0.66 at any time.
In summation, while the crypto market remains unpredictable, the technical indicators for XRP, combined with Dark Defender’s analysis, suggest a promising bullish trajectory. But as always, investors should conduct thorough research and remain cautious in their investment decisions.
At press time, XRP traded at $0.4888.
Featured image from Shutterstock, chart from TradingView.com