Bitcoin recently pushed into a key liquidity pocket near the $73,000 level, briefly tapping overhead liquidity before encountering a sharp reaction to the downside. With structure still holding and buyers stepping in on dips, attention is now shifting to whether this positioning phase could set the stage for a stronger push toward the $80,000 region.
Upper Liquidity Sweep Before Sharp Rejection Near $74,000
According to the latest MMT Heatmap update from Columbus, Bitcoin experienced a significant surge into the upper liquidity pocket during the overnight session. The price climbed aggressively to the $73,000 mark, testing the strength of overhead supply. However, this momentum was met with a sharp corrective reaction as it approached a substantial liquidity cluster situated near $74,000.
This specific price action is characterised by a market that is probing for liquidity without establishing immediate value acceptance. Here, there is a sweep, followed by investors building positions; a standard market mechanism where high-interest zones are cleared out before the market gathers the necessary structure to sustain a more permanent move higher.

Currently, Bitcoin remains in a rotation phase as it attempts to solidify a reclaim above its previous channel resistance. This transition period is vital for converting old resistance into support, providing the technical foundation required for the next leg of the bull cycle.
The broader outlook remains cautiously optimistic, provided that buyer demand is resilient and does not fade anytime soon. As long as bids continue to rebuild aggressively on every minor dip, the underlying market structure maintains its bullish bias.
Bitcoin Tests Historic Weekly Support–Resistance Zone
Bitcoin’s weekly chart shows that the price is currently negotiating one of its strongest support and resistance zones, a level that dates back to the week of March 11, 2024. Market action around such historically significant areas often determines the next major directional move, as both buyers and sellers tend to defend their positions aggressively.
Crypto analyst Christopher Inks notes that momentum indicators still leave plenty of room for further upside. Both the weekly RSI and the Stochastic RSI remain far from overheated territory, suggesting that Bitcoin could still extend its move higher and potentially push into the $80,000 region if bullish momentum continues to build.
Christopher Inks has also emphasized throughout the year that a strong, impulsive weekly candle breaking and closing above the yearly pivot at $96,071.25 would be a major signal for the market. Such a move would confirm that the cycle low is already in place and could open the path for Bitcoin to advance toward a new all-time high.
]]>XRP is showing signs of a potential bullish turnaround after recently hitting a Golden Pocket. Analysts say this Golden Pocket could trigger a strong relief bounce in the XRP price, potentially propelling it toward $2.50. At the same time, they predict that a price drop to new lows remains possible if the market does not unfold as expected.
In an X post on Monday, crypto market analyst CasiTrades announced that XRP has hit a Golden Pocket, bringing attention to an upcoming W4 relief bounce that could fuel a rally to $2.5. Sharing a detailed Elliot Wave chart, she noted that XRP experienced an expected flush into the Golden Pocket around the 0.618 Fibonacci level near $1.93. At the same time, the cryptocurrency aligned well with the 1.618 Extension for Wave 3, which CasiTrades describes as a textbook move.
XRP Golden Pocket Signals Rally To $2.5
According to the analyst, this sets the stage for a full Wave 4 relief to begin. She pointed out that the first resistance to watch is the 0.382 Fibonacci Retracement level at $1.78, which also coincides with a previous support breakdown and could serve as a backtest of resistance.
Related Reading: XRP To $11, And Then $70: The Next Impulse Wave To Watch Out For
CasiTrades noted that XRP experienced a very shallow Wave 2, only retracing to the 0.382 Fibonacci level in the Elliott Wave chart structure. She explained that modest Wave 2 corrections often signal a deeper Wave 4 retracement, indicating the XRP price could experience a stronger pullback during the next corrective phase before potentially resuming its upward trend.

Based on this pattern, the analyst stated that Wave 4 could push XRP higher, potentially reaching the $1.93 level from its current price of around $1.60. She added that the cryptocurrency could climb further to $2.03, which corresponds to the macro 0.5 retracement level. CasiTrades emphasized that XRP would need to reclaim the $2.03 level and hold it as support before a sustained upward move could begin. This highlights $2.03 as a key turning point that could trigger XRP’s next breakout phase above $2.50.
The analyst further explained that holding $2.03 as support would eliminate the need for another corrective wave down toward $1.55 or lower. She added that maintaining this level could also prevent Wave 5 from failing.
What Happens If Support Fails
In her Elliott Wave analysis, CasiTrades admitted that “nothing is confirmed yet,” keeping her bullish outlook for XRP speculative. She noted that XRP’s recent drop to new lows created a Bullish Divergence, but the market could still revisit lows.
Related Reading
CasiTrades said that XRP’s bullish scenario will only be confirmed once it breaks through the key resistance level. The accompanying chart highlights the potential downside of support failing, projecting a roughly 8% decline from $1.60 to $1.47.
Featured image from Getty Images, chart from Tradingview.com
Bitcoin bearish sentiments continue to dominate the market, after prices fell below the key $80,000 on January 31, resulting in a new wave of market liquidations. Interestingly, a pseudonymous analyst with the username CryptoMe has identified an “air pocket” in the present price structure, which potentially points to the downside target of this recent price drop.
Bitcoin Now Below $80K Support Zone – What Next?
In a QuickTake post on January 31, CryptoMe draws attention to an existing price vacuum between $73,000 – $80,000 as confirmed by three different market metrics. This observation is important in anticipating Bitcoin downside targets, considering the presently heightened market fears following the latest price decline.
According to CryptoMe, liquidity levels on the Binance spot order book showed a concentration of limit buy orders between $73,000 – $80,000 that formed between late October and early November. Despite the price surge from $80,000 to around $100,000 seen in late Q4 2025, the liquidity cluster price zone remained untouched. Therefore, the zone is likely to act as a short-term price magnet should bearish momentum persist, as markets often gravitate toward areas of unfilled liquidity during periods of heightened volatility.

Another on-chain metric that supports the existence of an air pocket between $73,000 – $80,000 is the Unspent Transaction Output (UTXO) price histogram. Each Bitcoin transaction consumes existing UTXOs and creates new ones; therefore, UTXOs are a good measure of on-chain transaction activity. As seen in the chart above, the sparse UTXO density between $73,000 and $80,000 suggests that a small number of transactions occurred within this price range. Thus, investors failed to establish a cost basis that would prevent further price decline, as prices have now slipped below $80,000.

The final metric highlighted by CryptoMe is the Spot ETF Investor Average Cost, which currently stands at $79,000. Following the launch of the Bitcoin Spot ETFs in January 2024, Bitcoin has failed to trade below its realized price until now. Considering all three metrics, it’s likely that Bitcoin is headed for the $73,000 price mark, which the market has not visited since April 2025. Moreover, such a decline would represent a 40% devaluation from the present market all-time high.

Bitcoin Price Overview
At the time of writing, Bitcoin trades at $78,558, reflecting a 6.5% increase in the last 24 hours. Meanwhile, total trading volume is up by 37.15% and valued at $74.67 billion.
]]>Ethereum is testing a critical juncture as the golden pocket between $2,600 and $2,800 comes into play. With resistance looming at $2,800, the market now faces a pivotal moment. Can ETH reclaim this level and spark a move toward $3,000, or will sellers push it back below key support?
Golden Pocket Breakdown Validates Ethereum’s Downside Target
In an Ethereum update, analyst Luca has offered a detailed analysis of the leading altcoin, reflecting on the expert’s previous predictions. As he covered all his PAT updates and his latest YouTube video, once Ethereum broke down below the high-timeframe support range, specifically the golden pocket between the 0.5 and 0.618 Fibonacci POIs, the most likely outcome was a continuation of the downside pressure.
Related Reading
Luca explained that this expected continuation was targeting the next major support, the high-timeframe support range marked in purple. That exact scenario just played out, with the price now confirming the bounce on the low-timeframes, performing precisely as anticipated.

From this validated support, Luca believes the most likely outcome is a reversal back to the upside. However, he stressed the need for confirmation before fully committing to the long side: “Before I start scaling out of my hedges, I want to see additional signs of strength and a clear bottoming formation to confirm that this level is holding,” Luca stated.
The analyst concluded with a warning: if the price were to break below this established range, it would entirely invalidate the idea that the move is a simple corrective Wave 2 on the high-timeframes. Instead, the breakdown would signal a durable structural decline, which Luca intends to “avoid getting caught in.”
$2,600 Tested: Buyers Rush To Defend Lows
After examining current price action, crypto analyst Ted Pillows highlighted that ETH experienced significant volatility yesterday, nearly touching the $2,600 level before finding a temporary floor. Following that test, Ethereum is currently attempting to reclaim the $2,800 level, but is facing noticeable resistance from sellers at that mark.
Related Reading
The analyst provided a clear path for a continued recovery. Should Ethereum decisively reclaim and hold the $2,800 level, it would signal sufficient bullish strength, propelling ETH toward the next significant psychological and technical target at the $3,000 level.
Conversely, Ted warns that if this essential $2,800 level is not reclaimed, the market is likely to reverse lower. As a result, traders should expect a sweep below the $2,500 level, indicating a need to test deeper support before the asset can attempt another structural recovery.
Featured image from iStock, chart from Tradingview.com
Ethereum is showing renewed strength after rebounding from its Bull Market Support Band, a key zone that has historically served as a launchpad for major uptrends. The bounce signals a possible shift in momentum, but the real test now lies ahead. With the price approaching the crucial golden pocket resistance, a breakthrough is likely to confirm a sustained bullish phase.
ETH Bounces Back From Weekly Bull Market Support Band
In his recent update on ETH, Luca, a crypto analyst on X, noted that the asset has once again found solid footing at a familiar support area. According to Luca, the price has successfully bounced off the Weekly Bull Market Support Band. This rebound also aligns perfectly with the high-timeframe support range highlighted in his previous PAT updates, reaffirming the technical strength of this level.
He emphasized that this move was largely anticipated, as the support zone has repeatedly proven to be a reliable area for bullish reactions whenever ETH enters a corrective phase. The recent bounce signals that buyers are still active and willing to defend key levels, which could set the stage for renewed momentum if sustained.

However, Luca urged caution in the short term, pointing out that ETH is now approaching a major resistance zone. This zone corresponds with the golden pocket area between the 0.5 and 0.618 Fibonacci levels, where Ethereum previously encountered selling pressure. A failure to break above this region could result in sideways movement or a minor pullback before any decisive trend shift occurs.
ETH Eyes High-Timeframe Resistance Range For Next Leg Up
The analyst further explained that if Ethereum manages to break above the current resistance range, it would signal a decisive shift in market structure. Such a move would confirm renewed bullish momentum, paving the way for a mid-term uptrend toward the high-timeframe resistance zone marked in red.
He added that as long as ETH holds above the “golden pocket” zone after a breakout, the most likely outcome remains further upward. Sustaining momentum above this key area would reinforce the bullish narrative, suggesting that Ethereum could continue climbing toward higher resistance levels without facing major corrections.
However, until that breakout occurs, the analyst expects a period of consolidation around the current support band. According to the analyst, this phase would likely serve as a base for a more durable upside reversal in the future. At this time, patience remains essential, as the ongoing structure hints that Ethereum is preparing for a stronger, more sustained rally once the market confirms direction.
]]>Crypto in Your Pocket: 7 Best Cloud Mining Apps to Mine Bitcoin & Dogecoin and Earn Passive Crypto Income (Android & iOS Users) CoinCentral
Source link ]]>
Reason to trust
![]()
Strict editorial policy that focuses on accuracy, relevance, and impartiality
Created by industry experts and meticulously reviewed
The highest standards in reporting and publishing
Strict editorial policy that focuses on accuracy, relevance, and impartiality
Morbi pretium leo et nisl aliquam mollis. Quisque arcu lorem, ultricies quis pellentesque nec, ullamcorper eu odio.
Bitcoin bulls are trying to push higher from just under $97,000, attempting to confirm its latest breakout above a multi-day consolidation range. After stalling near $95,000 for over a week, Bitcoin broke out to $97,000 before reversing and forming a fair value gap.
Related Reading
This has led to a surge in activity on the Bitcoin blockchain, and the next outlook is whether the current structure holds for a continuation to $100,000 or if this momentum could falter at a zone of resistance.
Bitcoin Reaches 6-Month Peak In Network Activity
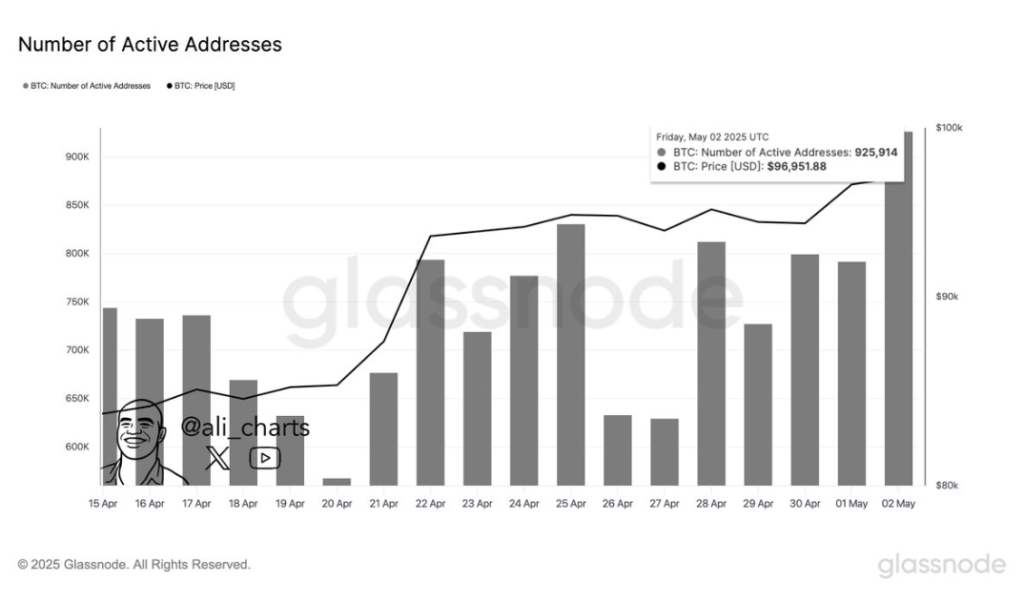
One of the most notable shifts in market dynamics came from the on-chain side. According to crypto analyst Ali Martinez, Bitcoin just recorded its highest number of active addresses in the past six months. As shared in a post on social media platform X, Martinez noted that 925,914 BTC addresses were active within a single day, which is an unusually high level of engagement on the Bitcoin blockchain.
The accompanying Glassnode chart reveals how steep this surge has been, building on a gradual climb that started in the last week of April. Interestingly, the spike in Bitcoin activity coincides with its recent reclaim of the $95,000 price range.
Adding to the bullish case, crypto analyst TehThomas shared a compelling technical analysis that pointed to a breakout continuation toward $100,000. Interpretation of the BTCUSDT 4-hour timeframe shows an almost identical structure to the one seen in mid-April.
Back then, Bitcoin consolidated near $86,000, broke out, left behind a fair value gap (FVG), retested the gap, and rallied nearly $10,000. A mirror image of this pattern is currently unfolding. The Bitcoin price compressed below $95,000, broke through resistance, and created a fresh FVG between $94,200 and $95,000.
TehThomas noted that the key is not to chase the breakout but to wait for a clean retest of the new FVG. If buyers defend that area as they did earlier this month, the road to $100,000 is structurally intact. However, even though the structure currently favors the bulls, the situation could turn bearish if Bitcoin drops back into the old range below $94,000.
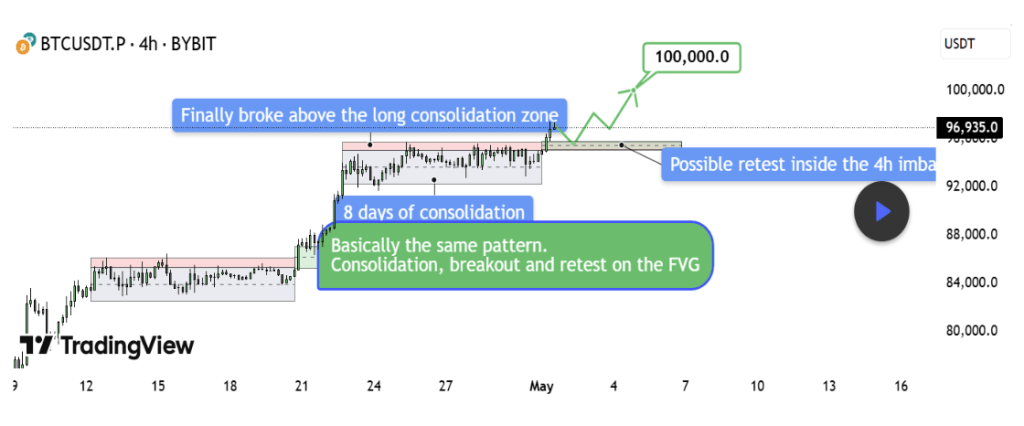
Chart from TradingView
Bearish Golden Pocket Setup Highlights Risk Ahead
Not all analysts are convinced that Bitcoin will reach $100,000 again without a shakeout first. A counterview on the TradingView platform highlights a possible short-term bearish setup based on the BTCUSDT 15-minute chart.
According to the analyst, the current upward retracement appears corrective rather than impulsive, forming a classic short setup within a strong fair value gap resistance zone. Technical analysis shows that Bitcoin has retraced into a region that aligns with a bearish fair value gap and the golden pocket zone defined by the 0.618 to 0.65 Fibonacci levels.
Related Reading
As it stands, the fair value gap is sitting between $97,000 and $97,450. Should price fail to break through this supply region, it could reverse and catch bulls off guard.
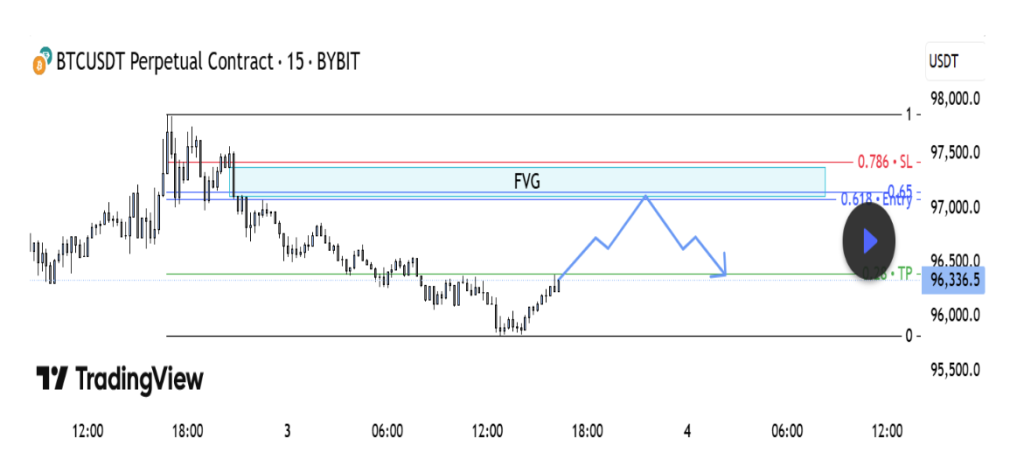
Chart from TradingView
At the time of writing, Bitcoin was trading at $96,040.
Featured image from Unsplash, chart from TradingView
Deep Pocket Investor Raises Concern Over Cardano’s (ADA) Future and Identifies Mutuum Finance (MUTM) Could Save Investors Mitrade
Source link ]]>
Reason to trust
![]()
Strict editorial policy that focuses on accuracy, relevance, and impartiality
Created by industry experts and meticulously reviewed
The highest standards in reporting and publishing
Strict editorial policy that focuses on accuracy, relevance, and impartiality
Morbi pretium leo et nisl aliquam mollis. Quisque arcu lorem, ultricies quis pellentesque nec, ullamcorper eu odio.
The XRP price is gearing up for another bullish move upward, as a crypto analyst has predicted a 20% surge in the near future. This optimistic forecast is backed by the formation of a key technical pattern called the Golden Pocket and indicators including strong support levels and a critical resistance zone.
Golden Pocket Signals XRP Price Surge
According to TradingView analyst TehThomas, the XRP price is currently trading within a well-defined Ascending Channel, setting the stage for a potential 20% move upwards. In the 4-hour time frame, XRP has continued to respect this Ascending Channel, forming higher highs and higher lows — a key indicator of a sustained uptrend.
Related Reading
Interestingly, the most notable development in XRP’s price action is the appearance of a Golden Pocket on its chart. A Golden Pocket is a key Fibonacci retracement area that is often used to identify potential support and resistance levels. It represents a complete trend reversal for a cryptocurrency and a possibility of an aggressive uptrend.
The TradingView analyst has revealed that XRP’s current Golden Pocket aligns with an imbalance zone, an area of unfilled liquidity where prices typically revisit before resuming movement.
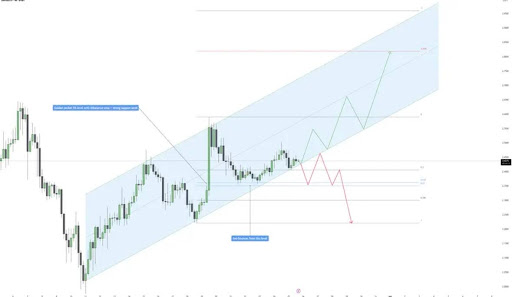
In the chart, XRP’s Golden Pocket sits between the 0.618 – 0.65 Fibonacci retracement level — a well-known area where the price usually finds strong support before continuing the trend. Historically, XRP has reacted twice from this key level, indicating that buyers have been actively defending this area.
TehThomas has predicted that as long as the XRP price can hold above the key Fibonacci retracement level, which also acts as a critical resistance, the cryptocurrency’s bullish structure will remain unchanged. Additionally, XRP could be primed for a massive rally toward the 0.618 Fibonacci extension level, which corresponds with the upper boundary of the Ascending Channel.
If this bullish momentum continues, it means that the analyst expects the XRP price to see a rally to a target between the $2.8 to – $2.9 range. This represents a 29% price increase from XRP’s current price of $2.2.
Short-Term Resistance Could Trigger Decline
TehThomas’s bullish outlook for the XRP price, the TradingView analyst noted that the 1-hour time frame presents short-term resistance, which could lead to a significant pullback before the next leg up. XRP recently faced a rejection at the imbalance zone, indicating that sellers are increasing activity at this level.
Related Reading
Previously, when the price struggled to break the imbalance zone, it highlighted a lack of liquidity to sustain a continued uptrend. A repeat of this could result in a retracement toward the Golden Pocket in the 4-hour timeframe.
Notably, a confirmed breakout from the 1-hour imbalance timeframe could reinforce XRP’s bullish momentum, supporting its projected move toward upper levels of the Ascending Channel. However, a failure could shift this bullish structure, leading to a deeper correction toward lower support levels.
Featured image from iStock, chart from Tradingview.com
Is The Dogecoin Price Still Bearish? Macro Golden Pocket Sitting Above $0.26 Tells A Story CoinGape
Source link ]]>