Dogecoin Is Sitting On A Powder Keg: Here’s The Explosion That Will Send Price To $1.3 TradingView
Source link ]]>
The Ethereum price is flashing major upside signals as on-chain and market activity align toward a potential breakout to the $3,000 level. With crypto exchange balances falling to their lowest in nine years, stablecoin rails hitting record highs, and Spot Ethereum ETF inflows spiking last month, analysts now describe ETH as a “powder keg” primed for explosive movement.
Ethereum Price Eyes A $3,300 Breakout
The Ethereum price action is drawing attention as it continues to trade within a well-defined consolidation range, hovering near $2,555 at the time of writing. Based on a recently released technical analysis by crypto analyst Pentoshi on X social media, ETH could be on the verge of a significant move, with $3,300 marked as the next bullish target in the near term.
Related Reading
The crypto expert’s chart reveals that since early May 2025, Ethereum has been locked between two key levels—a support zone around $2,190 and resistance near $2,750. This range has remained intact for over eight weeks, signaling a period of accumulation and low volatility after the sharp decline experienced in the first quarter of the year.
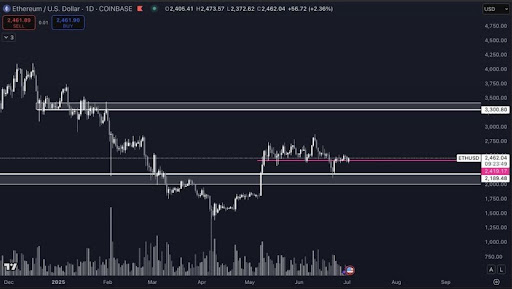
Pentoshi has pinpointed $2,100 as the key downside risk in his bullish outlook, aligning closely with the lower support zone marked on the chart. While the next bullish extension and major resistance level has been identified as $3,300, the analyst expects Ethereum to make a move toward this price level within the next three months. He suggests that the current setup offers a favorable risk-reward profile, estimating a potential upside of roughly 3.2x compared to the downside risk.
Analyst Calls Ethereum A “Powder Keg”
In other news, Eric Conner refers to Ethereum as a “powder keg,” highlighting a growing convergence of fundamental factors that are building up pressure and positioning the cryptocurrency for a potentially parabolic move in the market.
Related Reading
The analyst reports that Stablecoin activity on Ethereum has reached historic highs, with the total market capitalization of on-chain dollar-denominated assets hitting $251 billion—a record that also marks 21 consecutive months of uninterrupted growth. In parallel, Ethereum Spot ETFs have brought in $1.17 billion in net inflows during June alone, marking a major shift in investors’ appetite for ETH exposure.
Even more notable, the amount of Ethereum available for trading is now at its lowest level in nearly a decade, with only nine million ETH tokens on centralized crypto exchanges. This nine-year low in exchange balances signals a drying float, where any fresh demand has an outsized impact on price.
Conner has stated that large-scale crypto investors are beginning to take note. He reports that wallets holding between 1,000 and 10,000 ETH have accumulated more than 800,000 tokens daily during the peak week in June, marking the most aggressive absorption by whales since 2017.
Currently, price action mirrors tension, and the analyst warns that if Ethereum decisively clears the $2,600 resistance level, the combination of supply scarcity, ETF-driven demand, and explosive stablecoin usage could unleash a violent and rapid breakout.
Featured image from iStock, chart from Tradingview.com
While Bitcoin has dipped from its recent highs of around $74,000, some analysts are urging investors to stay calm and even see this as a buying opportunity. So far, Bitcoin prices have remained under pressure, trickling lower in the past trading week.
Are There Similarities With The Bitcoin Bull Run Of 2020?
Though the downward momentum is slowing down, and there has been no confirmation of the April 2 dump, the failure of bulls to convincingly flow back and drive the coin above $71,000 remains a concern for some traders.
Even so, taking a bullish stand, one analyst on X compares the current formation with that of 2020. Pointing to the cyclic nature of prices and the inevitability of retracements from bottoms and peaks, the trader expects prices to bounce.
The trader said that in 2020, when Bitcoin prices fell, shaking out weak hands, the recovery sparked a bull run that forcefully saw the coin surge above previous all-time highs of $20,000. The analyst seems to allude to the retracement before the breakout as a catapult that eventually fed the “legendary” bull run, which saw Bitcoin float to as high as $70,000.
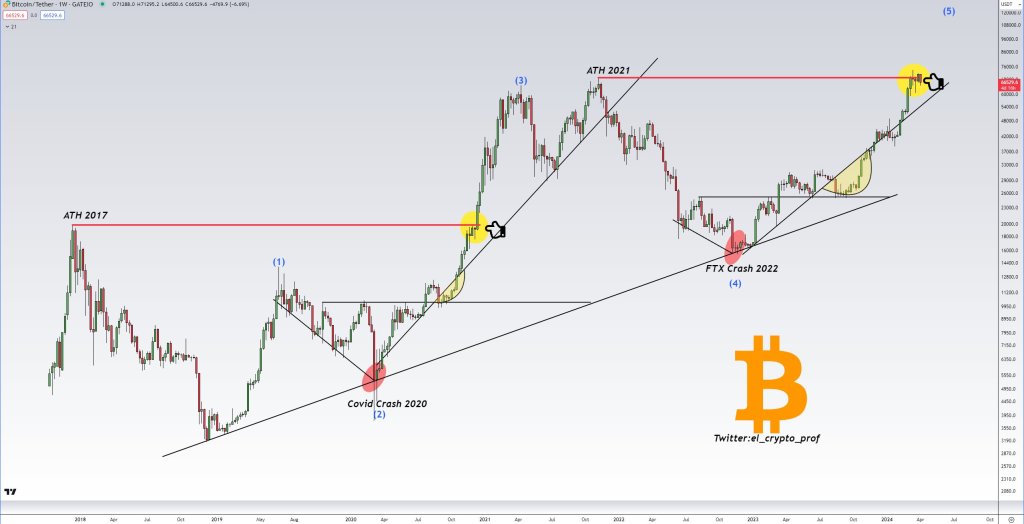
Based on this comparison, the trader is adamant that it may, reading from history, be the best time to “sell” at around spot levels. Still, for now, buyers can consider doubling down until there is a clear trend definition and shake-off of the current bear formation. Currently, BTC has strong rejections in the $71,700 to $72,000 liquidation zone, marking last week’s highs.
Watch Out For The “Dry Powder”
Besides technical candlestick formation, another trader thinks buyers better HODL even with sellers in control.
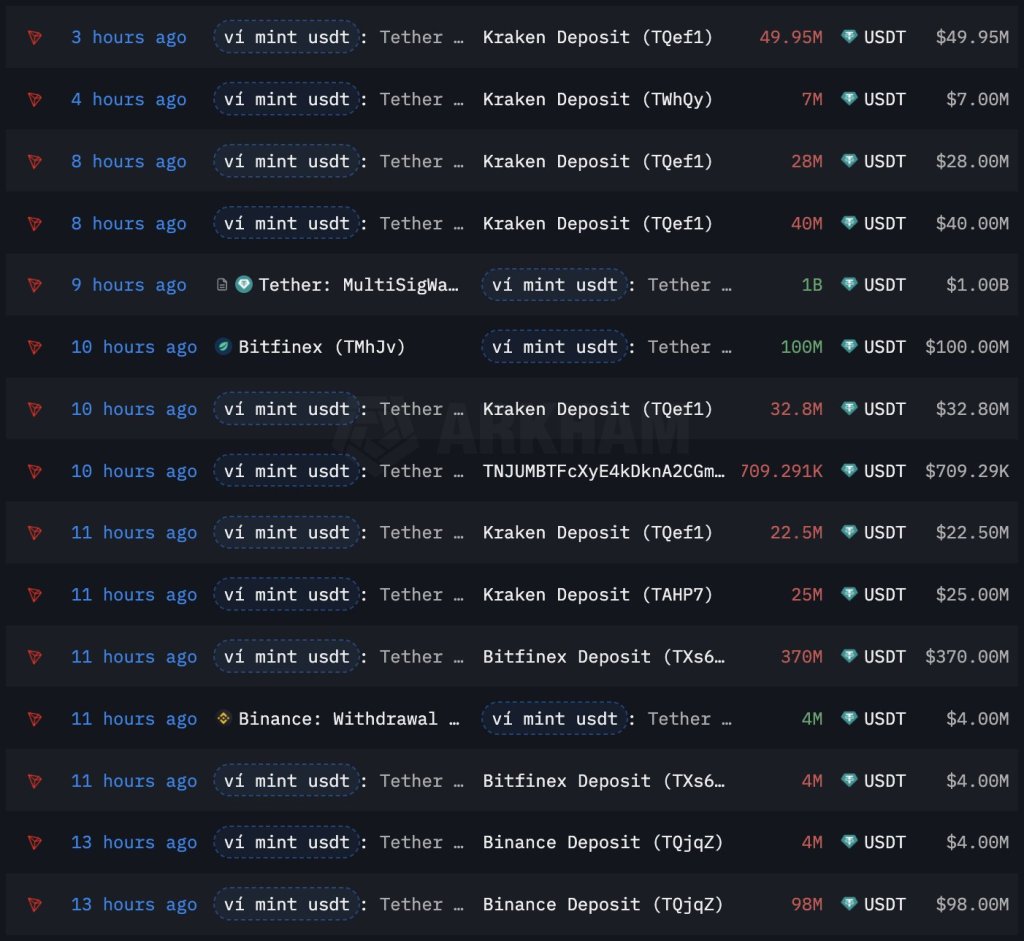
In a post on X, the analyst said Tether Holdings, the issuer of USDT, and Circle, the issuer of USDC, recently minted billions. On April 2, Tether issued 1 billion USDT on Tron, while Circle issued 250 million USDC on Solana.
This development, the analyst said, means there is “plenty of dry powder.” Stablecoins like USDT and USDC offer stability in the crypto markets, providing a refuge for crypto holders whenever prices tumble.
However, they can also act as conduits of liquidity from the traditional market, providing an avenue for interested users to get exposure to top coins or even engage in activities such as decentralized finance (DeFi).
In the past, prices often edged higher when there were huge stablecoin mints.
Feature image from Canva, chart from TradingView
Disclaimer: The article is provided for educational purposes only. It does not represent the opinions of NewsBTC on whether to buy, sell or hold any investments and naturally investing carries risks. You are advised to conduct your own research before making any investment decisions. Use information provided on this website entirely at your own risk.
- BTC’s price slowed down after showing so much strength as it rallied to a high of $21,000 but got rejected as the price rallied downward.
- BTC could suffer retracement as the price breaks below the crucial support area, holding the price off from sellers with hopes of a rebound.
- BTC’s price remains strong on the daily timeframes as the price trades above the 50 Exponential Moving Average (EMA).
The price of Bitcoin (BTC) showed some incredible price action as the price rallied from a low of $19,200 to a high of $21,000 before facing a rejection back to its key support of $20,500, where bulls had tried to hold sell-offs. The crypto market has enjoyed a bit of relief across all assets, with Bitcoin (BTC) showing great traction, rallying and dragging the market. With uncertainty in the crypto market, the Federal Open Market Committee are set to hold their meeting because most traders and investors have maintained more caution this time. (Data from Binance)
Bitcoin (BTC) Price Analysis On The Weekly Chart
The past week has seen many altcoins continue to produce over 200% gains over the past 7 days of breaking out of their range-bound movement, as many believe more hope could be settling into the crypto space once more.
The new week looked different, as many altcoins have had a good run, and Bitcoin (BTC) prices have struggled to stay afloat ahead of the scheduled Federal Open Market Committee (FOMC) to hold off BTC prices from losing going lower than expected.
Bitcoin’s (BTC) price has had a great run but has faced a setback in rallying past the high of $20,800 to a region of $21,500-$22,000, as anticipated by many. After its weekly close of above $20,500, the price of BTC rallied to a high of $21,000; the price faced a minor rejection to break higher to a region of $1.
The price of BTC has maintained a strong outlook above its crucial support form at $19,500, determined to defend this region from sellers.
Weekly resistance for the price of BTC – $21,300.
Weekly support for the price of BTC – $19,500.
Price Analysis Of BTC On The Daily (1D) Chart

In the daily timeframe, the price of BTC continues to be strong as bulls try to hold the price above its key support zone at $19,500, forming strong support to hold off the price from sellers.
BTC currently trades at $20,100, just above its key support on the daily timeframe after successfully rallying from this region several times to a high of $21,000-$22,000 before being rejected.
The price of BTC needs to hold above this region which corresponds to the Fibonacci retracement value at 23.6%, to avoid bears from taking over and driving the price down to a low of $19,500-$18,800.
If BNB fails to break and close above $335, we could see the price retraced to $300-$270, acting as good support for prices, but if the price breaks past $335, we would expect a rally to a high of $400-$450.
Daily resistance for the B price – $21,000-$22,000.
Daily support for the BTC price – $19,500.
Featured Image From zipmex, Charts From Tradingview
- BTC price trades below key resistance as prices get rejected under daily EMA.
- BTC’s monthly candle closes with so many mixed feelings ahead of October.
- The price of BTC must close above $21,500 to renew bullish sentiments.
The price action of Bitcoin (BTC) continues to toil with the emotions of traders and investors as it moves in an indecisive and uncertain fashion. Traders continue to speculate about what Bitcoin (BTC) holds for this new month of October. The price action and movements of Bitcoin (BTC) continue in its choppy, leaving most traders at loose ends due to an unstructured Bitcoin (BTC) price movement. (Data from Binance)
Bitcoin (BTC) Price Analysis On The Weekly Chart

Despite showing some fake movement of a bounce ahead of the monthly close, the price has found some rejection around $19,500 as the price struggles to break above.
The price of BTC retraced to a region of $18,700 but swiftly bounced from this region as price rallied to $19,300 but was faced with resistance to breaking above. BTC’s price needs to break and hold above $20,500 before it can resume bullish sentiment as the price trades at a key level.
BTC’s price needs to trade away from this region of $19,000 as a break below $18,100 could mean the price going to a low of $17,500 and even a low of $16,000.
Ahead of the weekly close, the price for BTC needs to close above $19,500 for a little bit of haven; a close below this range indicates exposure to more risk to go higher.
Weekly resistance for the price of BTC – $19,500.
Weekly support for the price of BTC – $18,100.
Price Analysis Of BTC On The Daily (1D) Chart

On the daily timeframe, the price of BTC remains below key resistance as it attempts to break above higher levels, with the price being rejected on several occasions.
The price of BTC has shown strength, rallying from a low of $18,700, with the price attempting to break above the $20,500 daily price range but facing rejection as the price trades between $18,800-$19,500.
The price of BTC trades at $19,100 below the 50 and 200 Exponential Moving Average (EMA). The prices of $20,400 and $27,000 correspond to the prices at 50 and 200 EMA for BTC on the daily timeframe.
A break and close above $20,500 could see the price of BTC assume some bullish sentiment in October as many traders and investors anticipate a green October, which could spell a rally to a region of $24,000 or higher.
Daily resistance for the BTC price – $20,500.
Daily support for the BTC price – $18,100.
Featured Image From zipmex, Charts From Tradingview
On-chain data shows the USDC exchange inflow has spiked up. Historically, stablecoins have provided dry powder for kicking off new Bitcoin rallies.
USDC Exchange Inflow Sharply Rose To High Values Recently
As explained by an analyst in a CryptoQuant post, almost one billion USDC has flowed into exchanges recently. Past pattern suggests this may lead to uptrend for Bitcoin.
The “USD Coin exchange inflow” is an indicator that measures the total amount of the stablecoin entering wallets of all exchanges within a given period.
When the value of this indicator moves up, it means investors are depositing a higher amount of coins at the moment. Usually, holders transfer stablecoins to exchanges for converting them into a volatile crypto, like Bitcoin. They may also withdraw the coins to fiat.
Investors use stablecoins like USDC when they want to exit volatile markets and hold on until prices are favorable enough for re-entering them. This implies that high stablecoin exchange inflows may show that prices are once again good for re-entry.
Related Reading | Bitcoin Trading Volume Has Now Stabilized At High Values, But For How Long?
Now, here is a chart that shows the trend in the USD Coin exchange inflows over the past year:

Looks like the value of the metric has surged up to high values recently | Source: CryptoQuant
As you can see in the above graph, the USDC inflow has spiked up over the past few weeks. These inflows have amounted to around 1 billion coins.
There were two other instances earlier during the period where similar values were also observed. Looking at the Bitcoin price curve in the same chart, it seems like some time following such large spikes in the indicator, the value of the crypto has always surged up as well.
Related Reading | Bitcoin Exchange Reserve Has Now Reached An Equilibrium After 2 Years Of Downtrend
This makes sense as many investors deposit the USDC for converting to BTC, so such inflows provide for a fresh supply of dry powder for sustaining a rally.
Now it remains to be seen whether a similar effect on the price of Bitcoin will also be there this time, or if this USDC inflow will pump some other coins instead.
Bitcoin Price
At the time of writing, Bitcoin’s price floats around $39.2k, down 10% in the last seven days. Over the past month, the crypto has lost 11% in value.
The below chart shows the trend in the price of the coin over the last five days.

BTC's price seems to have dropped down once again today | Source: BTCUSD on TradingView
Yesterday, Bitcoin showed some sharp uptrend and broke above the $42k level again. However, today the coin looks to have plunged down once more.
Featured image from Unsplash.com, charts from TradingView.com, CryptoQaunt.com
Data shows stablecoins volume has surged up once again. Past pattern may suggest that this accumulation could be dry powder for Bitcoin’s next big move.
Bitcoin Stablecoins Reserve Rises Up Again
As pointed out by an analyst in a CryptoQuant post, the stablecoins reserve seems to have risen again back to peak levels.
The stablecoins reserve is an indicator that shows the total amount of stablecoins being held on wallets of all exchanges
When the value of this indicator moves up, it means investors could be moving out of volatile crypto markets, and into the stable fiat tokens.
High values can imply investors are piling up these coins while waiting to find the optimal openings into markets like BTC.
Related Reading | Why Bitcoin Bears Might Not Get To Buy New Lows
On the other hand, when the metric’s value shows a downtrend, it could mean investors have started to move their funds from stablecoins back into volatile markets. Large volumes moving out to exchanges and into personal wallets will also register as a decrease in the reserve.
Now, here is a chart showing the latest trend of the indicator vs the Bitcoin price:
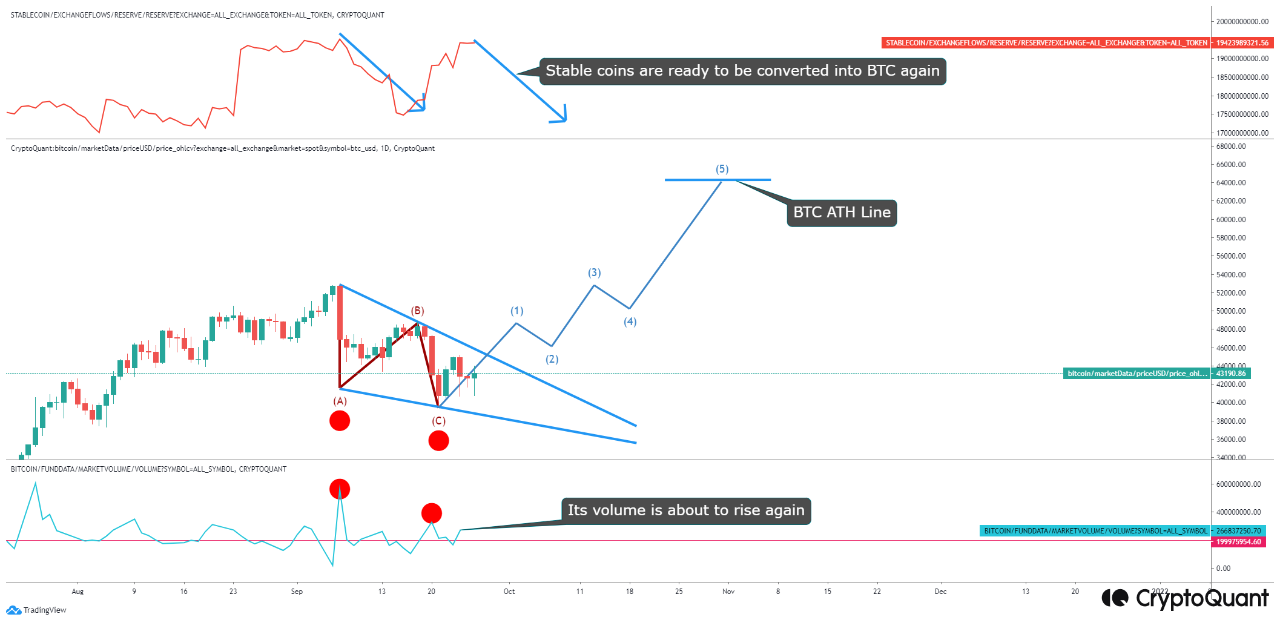
Stablecoins reserve has once again hit a peak | Source: CryptoQuant
As the above graph shows, the metric has once again shown an uptrend recently as its values reach up near the peak again.
Lately the trend this year has been that whenever stablecoins reserve shoots up, it means an accumulation of dry powder for Bitcoin. And when the indicator goes back down, these fiat tied coins are converted to BTC, showing up as a rise in the crypto’s price.
This trend can be seen in action in the above chart as well. When BTC hit a bottom due to the El Salvador day crash, stablecoins started dropping off quickly as BTC’s price recovered back to a higher level.
Related Reading | Will The SEC Approve A Bitcoin Futures ETF In 2021? Here Are The Implications
Once the price hit a peak, the reserve started going up once again as investors took the profits of the price increase and moved into fiat-tied tokens.
Now the stablecoins reserve has plateaued at a peak again. This may mean investors are just waiting to put their coins back in once the price is suitable.
Perhaps once Bitcoin gets pumped through these coins, it will be able to make a big move up again. The analyst in the post believes this could be one of the keys to hitting a new ATH.
BTC Price
At the time of writing, Bitcoin’s price floats around $43.5k, up 0.2% in the last seven days. The below chart shows the trend in the coin’s value over the last five days.

BTC's price heading on path of recovery from the crash due to China's crypto ban | Source: BTCUSD on TradingView