Shiba Inu Hit $41 Billion With Zero Products: Pepeto Has a Full Exchange at Presale Pricing and the Market Has Not Priced It In Yet BlockchainReporter
Source link ]]>
Bitcoin (BTC) has maintained a strong bullish performance over the past seven days, with the price gaining by approximately 12%. The crypto market leader rose to near $124,000 before experiencing a slight retracement, which has now forced prices to $122,070. With the market maintaining a consolidation pattern, prominent analyst Ali Martinez has shared some important price insights based on the MVRV pricing bands.
Holding Above $117k Could Propel BTC To $140k Next
The MVRV (Market Value to Realized Value) metric measures how far Bitcoin’s market price deviates from its realized price, effectively assessing whether BTC is overvalued or undervalued relative to historical norms. The chart’s color-coded deviation bands visualize these extremes, with the +0.5σ ($117,644) band presently acting as an important threshold.
In an X post on October 4, Maritnez explains the importance of this deviation band, stating that BTC’s ability to maintain price action above this mid-level band could precede large-scale bullish continuations. In contrast, the chart below suggests that a sustained price drop below the +0.5σ has often marked deeper corrections or mid-cycle resets.

Notably, the upper red band, marked around $139,800 (+1σ), represents the next key resistance level and an area where traders are expected to start taking profits. However, a steady consolidation above +0.5σ is necessary to maintain bullish structural strength and provide the push for the next leg, which is expected to propel BTC beyond its current all-time high at $124,457.
However, a price fall below this level could result in Bitcoin heading to the mean deviation band around $95,394. This would represent a 21.8% decline from present market prices and potentially the start of a bear market.
Bitcoin Realized Price Steady At $54,000 As Market Remains Healthy
In other news, Glassnode MVRV pricing bands data reveal that the current BTC realized price is set around $54,348. For context, this metric reflects the average price at which investors last moved their BTC, effectively serving as a psychological support during market corrections.
Notably, the current gap between the spot price, around $122,000, and the realized price underscores a healthy bull phase, with most holders sitting on substantial unrealized gains. As long as the realized price continues to rise steadily, it reinforces the underlying strength of the market and signals long-term confidence in an upward trajectory.
At press time, Bitcoin is valued at $122,197 following a 0.3% decline in the past day. In tandem, the daily trading volume is down by 55.52% representing a fall in trading activity.
]]>Bitcoin, Ethereum, and XRP rebound as the latest job reports, including ADP nonfarm employment change and jobless claims, signaled a weakening U.S. labor market. The data now shows 3 Fed rate cuts this year. Traders now wait for Nonfarm payrolls and unemployment rate jobs data due later today. Bitcoin, Ethereum, XRP Shorts Get Liquidated The
The post Bitcoin, Ethereum, XRP Rebound as Markets Pricing In 3 Fed Rate Cuts appeared first on CoinGape.
]]>Cardano Upgrades, XLM Rallies 7%, BlockDAG Offers 17x Pricing Advantage Until August 11 AInvest
Source link ]]>
Top market analyst Ali Martinez has shared on-chain data that tips Bitcoin to reach a $130,000 valuation, albeit on one condition. This bullish price prediction comes following a slight 2.6% price rebound over the past two days, pushing Bitcoin within the $118,000 price range.
$110K Emerges As Crucial Bitcoin Support Zone – Here’s Why
In an X post on July 26, Ali Martinez postulates that Bitcoin may be on track for a significant leg higher based on recent data from the MVRV pricing bands by Glassnode. However, the premier cryptocurrency must avoid losing a certain support zone to prevent an invalidation of this bullish thesis.
The MVRV bands, derived from Market Value to Realized Value (MVRV) ratios, help visualize when Bitcoin is either overvalued or undervalued relative to its historical realized price. These bands function like Bollinger Bands but are grounded in on-chain fundamentals, tracking statistical deviations around the mean MVRV value.
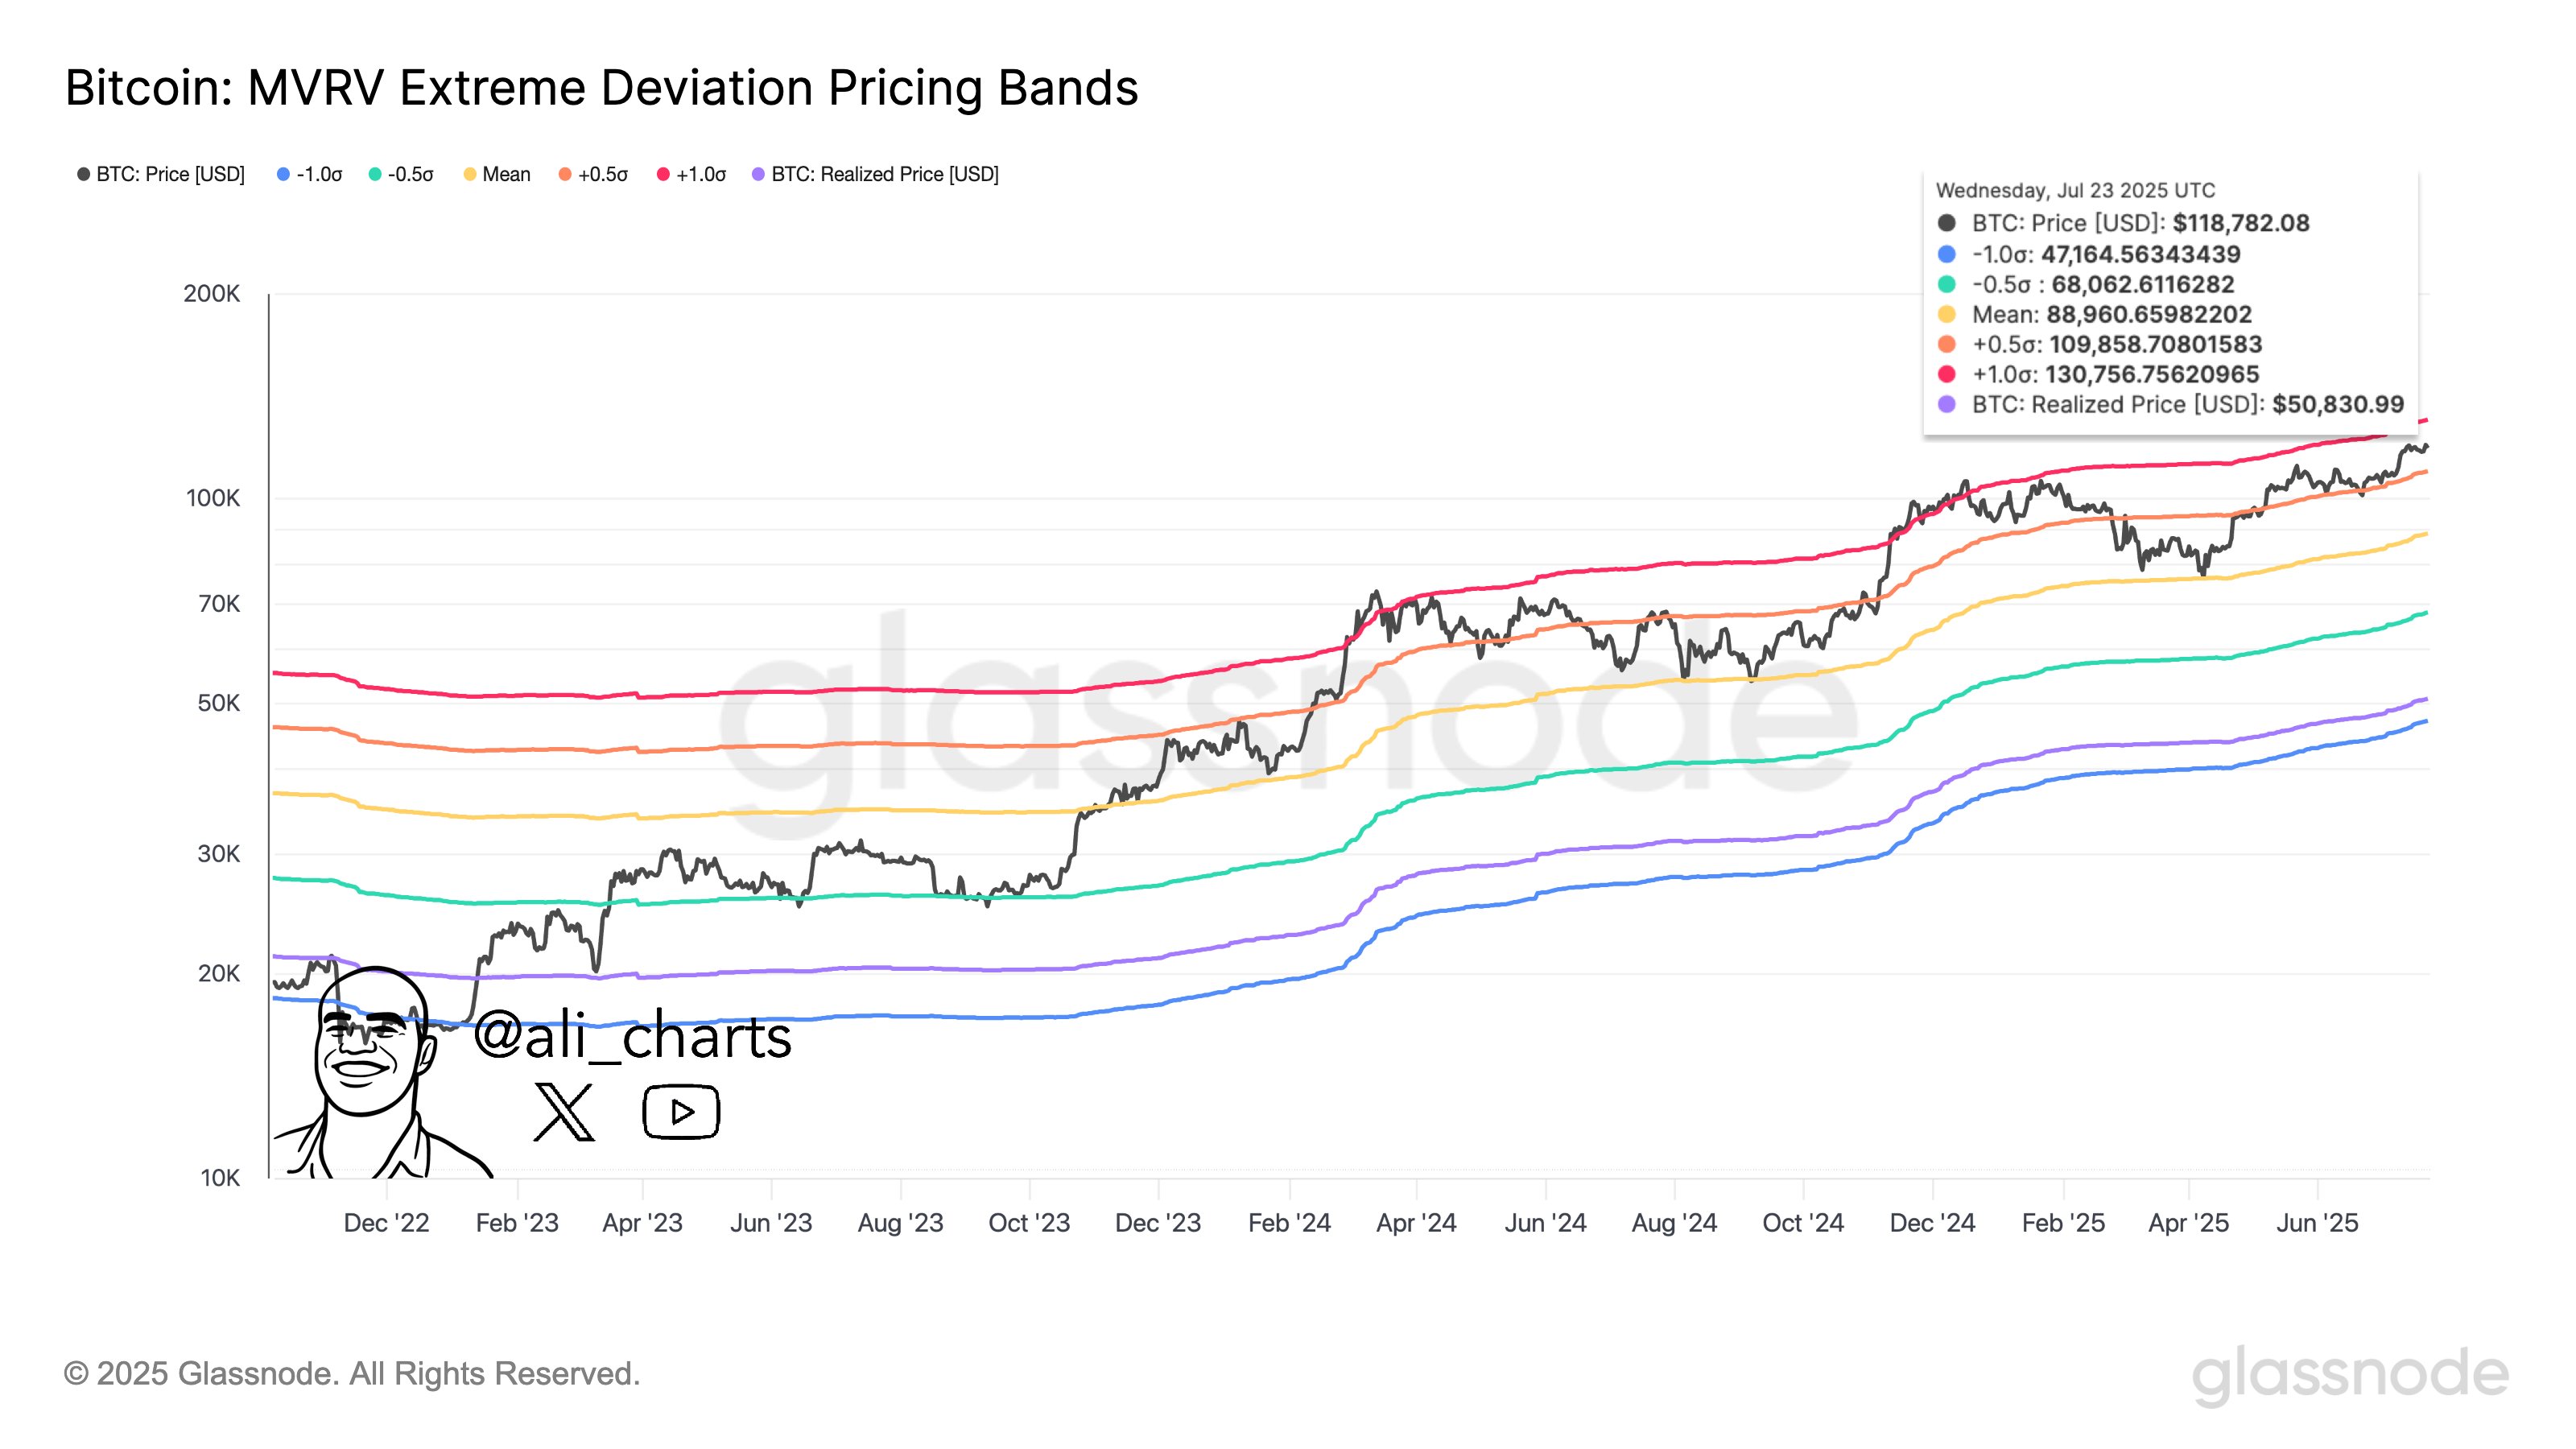
As of July 23, 2025, Bitcoin was trading at approximately $118,782, following a steady climb over recent weeks. According to the MVRV pricing model, the cryptocurrency was hovering just beneath the +1.0σ deviation band, marked at $130,756, representing the next major price resistance and target. Notably, the +1.0σ band is also interpreted as a key zone of extreme market optimism, often preceding local tops (+2.0σ)
On the other hand, the model’s +0.5σ band sat at $109,858 below the current market prices, serving as a vital support threshold. Ali Marinez explains that Bitcoin must maintain its price level above this band to retain a high probability of continuation toward the +1.0σ level target based on historical patterns. However, a breakdown below $110,000 could signal a deeper correction, potentially down to the mean band at around $88,960, or lower toward $68,062 (-0.5σ).
Bitcoin Investors Take Profits With Rising Market Confidence
According to more data from the MVRV model, the growing distance between BTC’s realized price, around $50,831, and its present market price reflects growing investor conviction. For context, the realized price represents the average cost basis of all coins in circulation, thereby indicating how deeply in profit the average Bitcoin holder is at the moment.
At press time, the premier cryptocurrency trades at $118,178 following a 0.73% in the past day. However, the daily trading volume is significantly down by 53.39% and valued at $47.98 billion. According to price prediction site Coincodex, the Bitcoin market sentiment remains largely bullish, with the Fear & Greed Index nearing extreme greed at 72.
Coincodex analysts project the leading cryptocurrency to maintain its current rebound, rising to $122,019 in five days and $141,075 in a month.
]]>Reason to trust
![]()
Strict editorial policy that focuses on accuracy, relevance, and impartiality
Created by industry experts and meticulously reviewed
The highest standards in reporting and publishing
Strict editorial policy that focuses on accuracy, relevance, and impartiality
Morbi pretium leo et nisl aliquam mollis. Quisque arcu lorem, ultricies quis pellentesque nec, ullamcorper eu odio.
Ethereum is trading firmly above the $2,600 mark after a surge in buying pressure over the past several days, marking a strong shift in momentum across the broader market. After months of choppy action and bearish sentiment, bulls are clearly back in control. ETH has reclaimed several key levels with conviction, signaling a potential continuation toward higher targets.
Related Reading
Price action now looks structurally bullish, with Ethereum pushing through resistance zones that previously capped upside for weeks. This rally has reignited investor confidence and brought renewed attention to Ethereum’s medium-term outlook, especially as altcoins start to show strength alongside Bitcoin’s recent consolidation.
According to fresh data from Glassnode, the next major resistance area to watch is at $3,100, where Ethereum is likely to encounter heavier sell pressure. This level, derived from pricing bands, now defines Ethereum’s current trading range and will likely dictate price direction in the coming sessions. With volatility returning and sentiment improving, Ethereum appears poised for a critical breakout or a decisive retest of support, depending on how bulls handle the next leg.
Ethereum Nears Key Resistance As Altseason Expectations Grow
Ethereum has rallied over 98% since its April 9th low, marking one of its most powerful recoveries in recent years. This explosive move has not only flipped sentiment from bearish to bullish, but also reignited speculation around a broader altseason — a period in which altcoins significantly outperform Bitcoin.
After months of heavy selling pressure that began in late December, Ethereum is now showing sustained strength for the first time. The price has reclaimed critical levels, and momentum continues to build as traders and investors rotate capital back into ETH and other large-cap altcoins. Market participants are watching closely to see if Ethereum can maintain this pace and confirm a longer-term trend reversal.
Top analyst Ali Martinez shared Ethereum’s MVRV Extreme Deviation Pricing Bands, offering a clear technical framework for what’s next. According to the data, the next key resistance level is at $3,100 — a region that could act as a short-term ceiling if buying pressure fades. On the downside, the major support zone sits at $2,233, a critical level to hold in the event of a pullback.
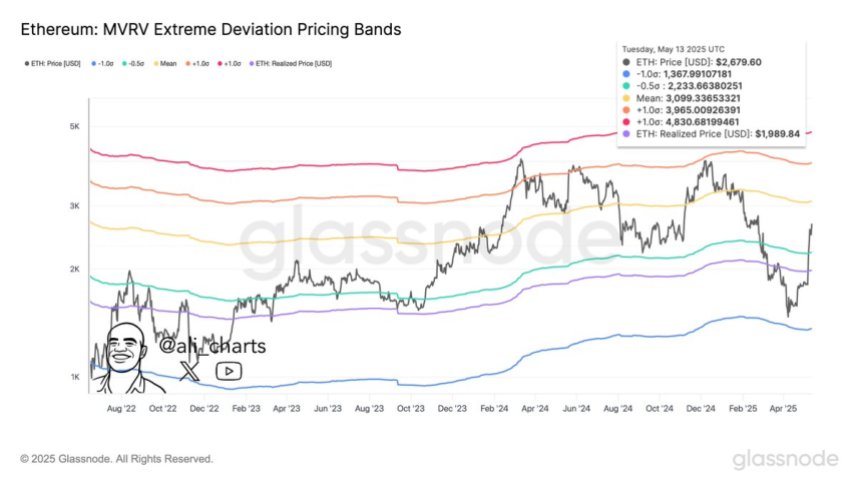
As Ethereum continues to climb, these levels will become increasingly important. A clean breakout above $3,100 could open the door to a broader rally across altcoins, while a rejection or correction would likely test the market’s true conviction. For now, ETH remains in a bullish structure, supported by growing volume, on-chain signals, and renewed investor enthusiasm. The coming days will be crucial in determining whether Ethereum leads the charge into a full-fledged altseason.
Related Reading
ETH Price Action: Testing Resistance After Massive Rally
Ethereum (ETH) is currently trading around $2,604, consolidating after a sharp surge that lifted it from under $1,400 to a high of $2,725 in just two weeks. The daily chart shows that ETH is now approaching the 200-day simple moving average (SMA) at $2,702.60, which is acting as a key resistance level. This zone also coincides with recent local highs from early February, making it a critical area to break for further upside continuation.

The recent rally brought strong volume and bullish momentum, with ETH closing multiple daily candles above the 200-day exponential moving average (EMA) at $2,435.66. This is a positive sign for trend reversal after months of sustained bearish pressure. However, today’s pullback signals that bulls are losing some steam as the price tests this crucial resistance.
Related Reading
If ETH can consolidate above the $2,500–$2,600 range and break through the 200-day SMA with convincing volume, the next upside target lies near the $3,100 level, as noted in recent technical studies. On the downside, maintaining support above $2,435–$2,450 is essential to avoid a deeper correction. The coming days will reveal whether Ethereum can turn this consolidation into a true breakout or if further cooling is needed before the next leg up.
Featured image from Dall-E, chart from TradingView

The price of Ethereum continues to struggle in the month of April, as it barely holds above the $1,600 level over this weekend. Despite its underwhelming performance, several investors are still keeping an eye out for the second-largest cryptocurrency by market cap. As such, a popular crypto trader on the social media platform X postulated that it might be time to buy the Ethereum token again.
Has ETH Price Reached A Bottom?
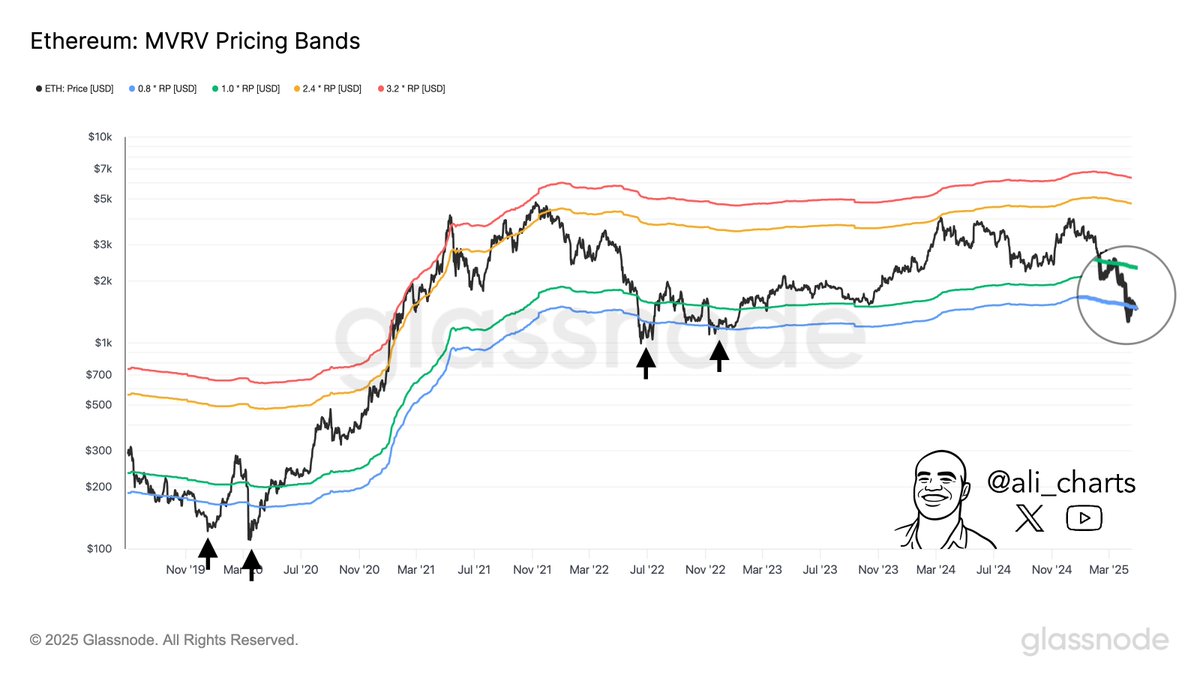
In an April 19 post on X, prominent crypto analyst Ali Martinez revealed that Ethereum has hit a crucial on-chain level, which could be bullish for the price. This on-chain observation revolves around the Market Value to Realized Value (MVRV) Pricing Bands, which are based on a set of MVRV values that typically describe the extremes of the market cycles.
The MVRV (Market Value to Realized Value) ratio is an indicator that tracks the ratio between a coin’s market cap and its realized cap. When the value of this ratio is greater than 1, it implies that more investors are considered to be in profit at the moment.
Typically, the MVRV ratio offers insight into how the value the investors hold (the market cap) measures against the value they put in (the realized cap). Meanwhile, the pricing bands help to estimate the extremes of a coin’s market cycle, where high levels indicate extreme unrealized profit and low levels signal extreme unrealized loss.
For context, a high MVRV value is considered a price top signal, as traders are usually more likely to offload their assets when they are in the green. Meanwhile, when the MVRV ratio is low, it implies that the market cycle has reached a bottom.
Source: @ali_charts on X
The blue pricing band represents extremely low levels, where the MVRV has been below 0.8 for around 5% of trading days. Meanwhile, the red pricing band marks extremely high levels, with the MVRV value trending above the 2.4 mark for around 6% of the trading days.
As shown in the chart above, the price of Ethereum has dropped beneath the blue pricing band in the past few days. Historically, whenever the price of ETH falls to this extremely low level, it means that the altcoin has bottomed out and might be gearing up for a trend reversal.
Ethereum Price At A Glance
As of this writing, the price of ETH sits just above $1,610, reflecting 1.4% increase in the past 24 hours. According to data from CoinGecko, the altcoin is down by 2% in the past seven days.
The price of ETH on the daily timeframe | Source: ETHUSDT chart on TradingView
Featured image from iStock, chart from TradingView
Editorial Process for bitcoinist is centered on delivering thoroughly researched, accurate, and unbiased content. We uphold strict sourcing standards, and each page undergoes diligent review by our team of top technology experts and seasoned editors. This process ensures the integrity, relevance, and value of our content for our readers.
Multiple crypto analysts suggest that Ethereum (ETH) may have already reached the bottom for this market cycle. However, the second-largest digital asset by market cap is expected to encounter significant price resistance in the near term.
Ethereum Has Likely Hit This Cycle’s Bottom
According to an X post by crypto analyst TraderPA, ETH has likely found this market cycle’s bottom. The analyst shared the following chart showing ETH repeatedly bouncing off a five-year-old support level.

The last time ETH touched this support line, it triggered a powerful rally, with its price surging an impressive 340%. A similar move this time could potentially push ETH to a new all-time high (ATH).
Fellow crypto trader Merlijn The Trader proposed that Ethereum might be on the verge of another parabolic run. He pointed out that ETH appears to follow the ‘1, 2, 3 bounce pattern,’ which previously led to a massive 3,600% gain the last time this setup played out.
For the uninitiated, the 1, 2, 3 bounce pattern is a technical analysis setup where the underlying asset’s price bounces off a trendline – point 1 and 2 in the below chart – followed by a range breakout after bouncing off from point 3.

Crypto analyst CryptoBullet provided a medium-term outlook for ETH’s price action. He suggested that ETH may be primed for a “good mid-term bounce.” He added:
This month ETH hit the 300-Week MA. In its history, ETH hit the 300-Week MA only 2 times: in June 2022 (bear market bottom) and this month – March 2025. My target for the bounce is $2900-3200. Once my target is reached, we will re-evaluate.

ETH Faces Strong Resistance At $2,300
In a recent X post, prominent digital assets analyst Ali Martinez noted that while Ethereum has reclaimed its realized price of $2,040, its next major obstacle lies at $2,300, based on pricing bands analysis.

Meanwhile, on-chain data and other indicators suggest a potential price recovery for ETH. Recent data from Santiment shows that ETH whales – wallets holding large amounts of ETH – accumulated more than 420,000 ETH over five days.
Additionally, ETH reserves on cryptocurrency exchanges hit a new all-time low this week, dropping to 18.3 million tokens. Shrinking ETH reserves on trading platforms often fuel a supply scarcity narrative, potentially driving prices higher.
That said, ETH continues to underperform against Bitcoin (BTC), sliding to fresh multi-year lows with no clear signs of recovery. At press time, ETH trades at $2,052, down 0.9% over the past 24 hours.

Featured Image from Unsplash.com, Charts from X and TradingView.com
Editorial Process for bitcoinist is centered on delivering thoroughly researched, accurate, and unbiased content. We uphold strict sourcing standards, and each page undergoes diligent review by our team of top technology experts and seasoned editors. This process ensures the integrity, relevance, and value of our content for our readers.
Dogecoin Pricing Strategy: Will 1Fuel Be the Difference for a 100x Return? Coinspeaker
Source link ]]>
Ethereum, the largest altcoin by market capitalization, is trading at surprisingly low levels compared to its peers, raising concerns among investors. As the broader crypto market shows signs of strength, Ethereum’s underperformance has sparked fears that this cycle may not deliver the returns many expected from the leading altcoin. Sentiment in the market is shifting, with some questioning whether Ethereum can reclaim its former dominance amid fierce competition from emerging projects.
Related Reading
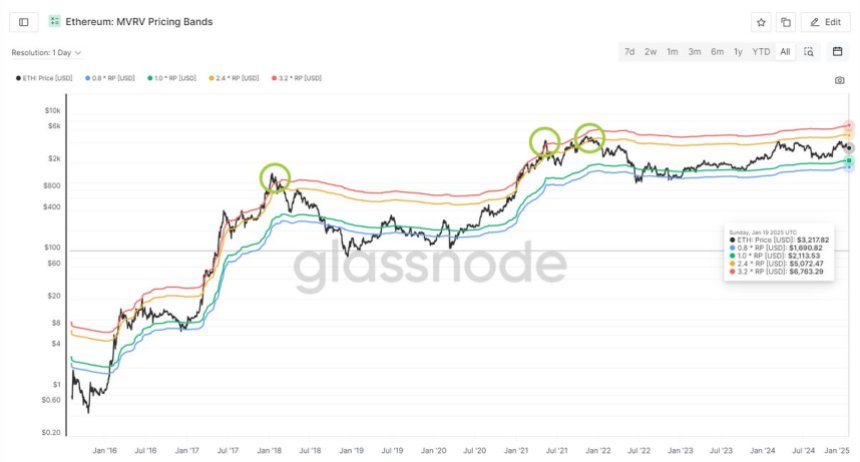
However, a closer look at key metrics offers a more optimistic perspective. According to the MVRV Pricing Bands chart, Ethereum is still far from its previous all-time high (ATH). This metric, which evaluates the market value relative to realized value, suggests that ETH has significant room to grow in the coming months.
While the current price action may seem discouraging to some, historical data indicates that Ethereum often lags in the early stages of a bull market before catching up with explosive moves. For long-term investors, this could represent an opportunity rather than a setback, as Ethereum’s fundamentals remain strong and its ecosystem continues to expand. As the market anticipates the next phase of growth, all eyes are on Ethereum to see if it can reclaim its leadership role and deliver on its potential.
Ethereum Preparing To Surprise The Market
Ethereum has faced significant challenges over the past month, remaining in a downtrend since mid-December. The cryptocurrency has dropped as much as 29% in less than 30 days, testing the patience of investors as the broader market shows strength while ETH struggles to gain momentum. Trading below key supply levels, Ethereum’s performance has raised concerns about its ability to keep up with the overall crypto rally.
Despite the bleak sentiment, some analysts see Ethereum’s current situation as an opportunity rather than a setback. Top analyst Carl Runefelt recently shared insights on X, pointing to the MVRV Pricing Bands chart as a key indicator of Ethereum’s potential. According to Runefelt, ETH is far from its all-time high (ATH), suggesting significant room for growth. He confidently stated that a $7,000 price target for Ethereum is only a matter of time, given its long-term fundamentals and historical market cycles.
Runefelt also highlighted Ethereum’s readiness to change the bearish sentiment surrounding it. As the second-largest cryptocurrency by market cap, Ethereum’s extensive ecosystem and institutional adoption remain strong drivers for future growth.
Related Reading
For investors with a long-term outlook, Ethereum’s current underperformance could represent a strategic entry point. With sentiment poised to shift and key metrics signaling room for growth, ETH has the potential to recover and reclaim its position as a market leader.
ETH Price Testing Key Demand
Ethereum (ETH) is currently trading at $3,302 following days of heightened volatility and sustained selling pressure. Despite the challenging market conditions, ETH has demonstrated resilience by holding above a key demand zone near the 200-day exponential moving average (EMA) at $3,127. This critical level has acted as a strong support, signaling that buyers remain active even amid market uncertainty.

For Ethereum to reclaim bullish momentum, the price needs to break above the $3,520 resistance level with conviction. This move would not only reinforce confidence among investors but also pave the way for further upside. Holding above $3,520 is essential for confirming a shift in market sentiment and establishing a foundation for a sustained rally.
Related Reading
As ETH navigates these pivotal levels, traders are closely monitoring its ability to maintain support and generate upward momentum. A successful push above $3,520 could trigger increased buying activity, potentially setting the stage for Ethereum to resume its uptrend. However, failure to clear this resistance could lead to continued consolidation, delaying a potential recovery. For now, all eyes remain on Ethereum as it tests key technical levels in a bid to regain its position as a top-performing asset in the crypto market.
Featured image from Dall-E, chart from TradingView.