Crypto analyst Cupra has revealed that Bitcoin has printed a historical aggressive recovery setup, signaling that a rally to the upside may be on the horizon. The analyst predicted that BTC could rally to a new all-time high (ATH) of $150,000 as the next bull phase approaches.
Bitcoin Prints One of the Most Aggressive Setups In Years
In an X post, Cupra stated that Bitcoin has just printed one of the most aggressive recovery setups that the market has seen in years. He noted that such a setup played out in 2019 after months of “pain,” which then led to a 282% explosive move for BTC. Now, the same structure is playing out, with the analyst noting a similar reset but with even more liquidity.
Related Reading
Cupra noted that this is not a coincidence, as this is how the bull run starts, with sentiment destroyed while liquidity builds and smart money begins to position. He added that the market is about to shock everyone and that a Bitcoin rally to $150,000 is not a “meme” but the next phase. His accompanying chart showed that BTC could also rally to a cycle peak of $420,000.

In another X post, the analyst doubled down on his assertion that Bitcoin could soon see a parabolic reversal to the upside. He noted that 35 bars are up while 12 bars are down, which is the “perfect cycle structure.”Cupra added that every time this happens, a massive expansion follows.
Cupra also revealed that Bitcoin has just completed the 12-bar reset and that this is the launch zone. In line with this, he declared that the next leg will be violent and won’t be a “normal pump.” The analyst added that the parabolic phase is starting now.
BTC Still At Risk Of A Decline
Crypto analyst Colin has predicted that Bitcoin remains at risk of a decline despite claims that the leading crypto has formed a bottom. He highlighted a bear flag on his chart, suggesting BTC could rally above $77,000 in the short term following the 2-week ceasefire agreement between the U.S. and Iran. However, the leading crypto is likely to continue its downward momentum after this relief bounce.
Related Reading
Crypto analyst Aralez warned market participants to be careful with any Bitcoin trades right now. He noted that price is sitting in a key zone after clearing a large liquidity shelf and that locally, the structure still looks bullish. However, there are two main things to monitor now, which are whether the market will show weakness soon and if the price will stall in a range.
At the time of writing, the Bitcoin price is trading at around $71,000, down in the last 24 hours, according to data from CoinMarketCap.
Featured image from Pixabay, chart from Tradingview.com
Cardano’s Chart Just Printed a “Black 9” – Here’s Where ADA Price Could Go Next CaptainAltcoin
Source link ]]>
-141 Billion Shiba Inu Netflow Printed as Demand Surges Cryptonews.net
Source link ]]>
- Cardano price breached below import support and is set to steamroll bulls in its avalanche.
- ADA is set to drop another 10% and print a new two-year low.
- Expect support to come in around $0.265 with the low of December 2017.
Cardano (ADA) price is pulling out all the registers and issuing distress signals to the markets. Traders are exiting, call it even an exodus if you want, from their long positions in risk assets. The reality seems to be kicking in among investors that the Federal Reserve, the European Central Bank and the Bank of England are right on the money in calling out a global recession as traders all run for the exit.
ADA has one door to exit, and everyone wants to go through it at the same time
Cardano price sees its sell-off accelerate this Friday morning during the European trading session as global markets are selling off. Equities and equity futures are deeply in the red, while all major cryptocurrency pairs are dipping lower. ADA sheds even 4% in just two minutes of trading at one point. Traders are starting to grasp the harsh reality that a soft landing is not in the cards, a snowball recession is coming, and the avalanche is coming crashing down.
ADA thus printed the lowest lows in almost two years as it trades below $0.297. The only thing between now and $0.265, which is below December 24, 2017, and the monthly S1 support level, is the fact that the Relative Strength Index (RSI) is nearly touching the oversold barrier. Should the US session continue this sentiment, expect a breach of that barrier on the RSI and that sees ADA tank to $0.265 near the US closing bell.
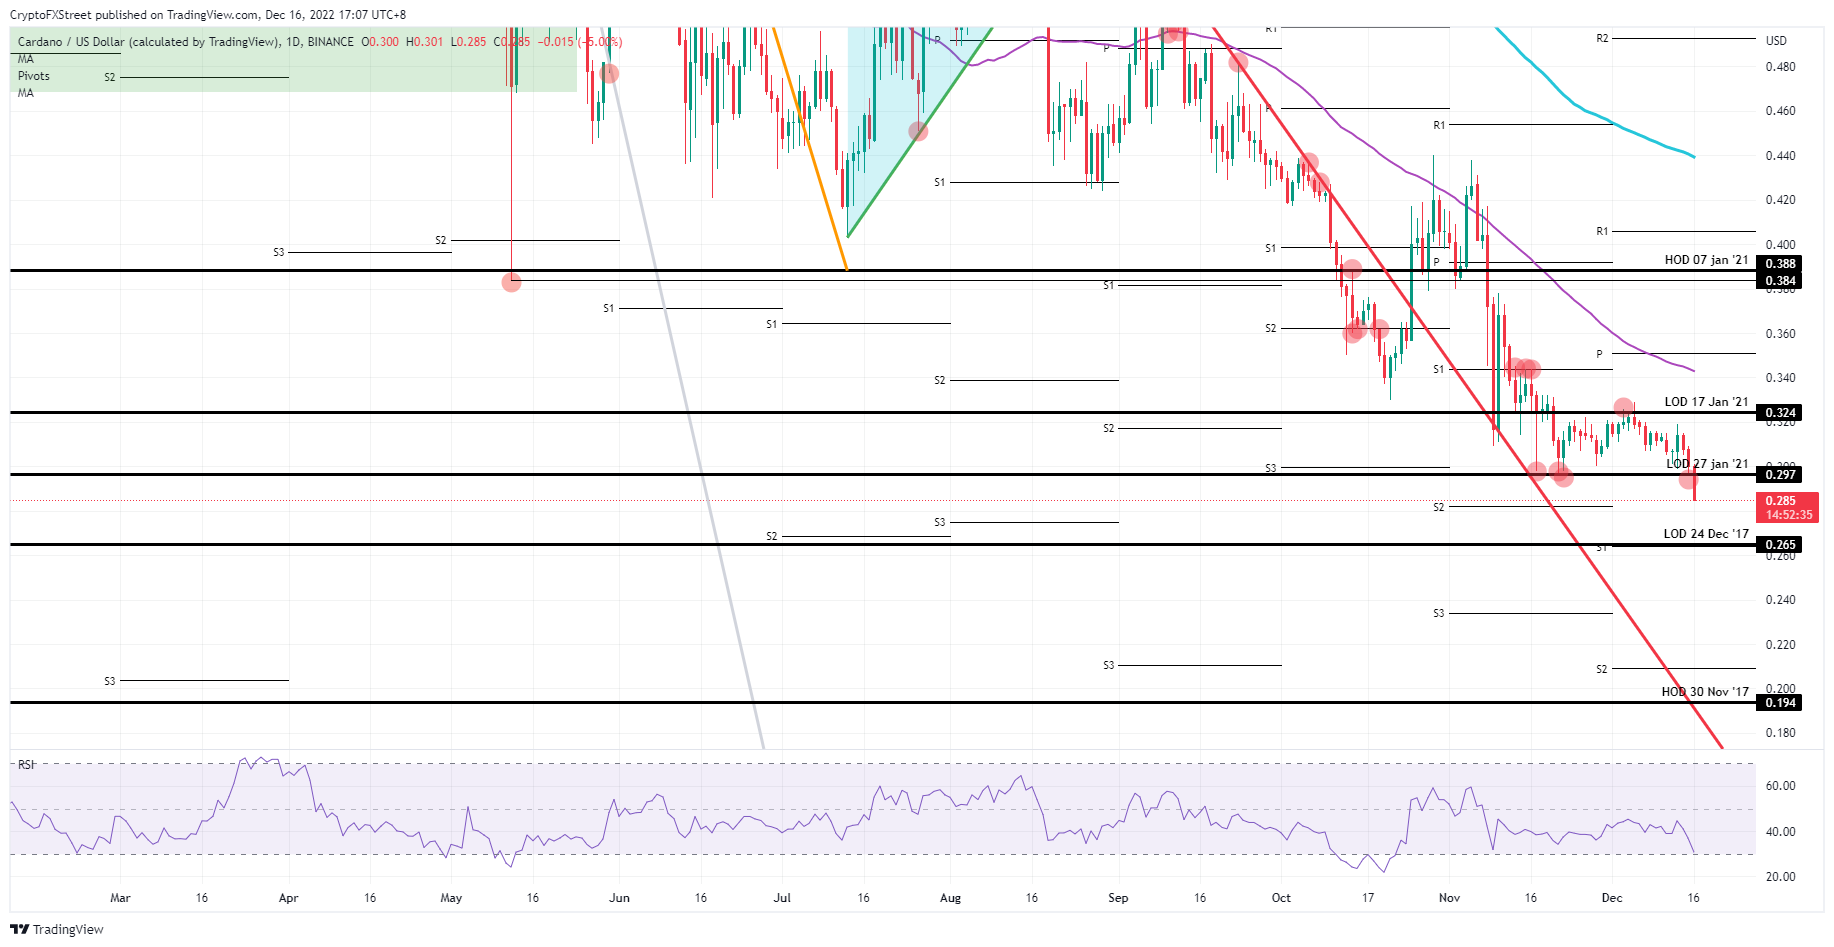
ADA/USD daily chart
Upside potential could come over the weekend once the dust settles with a return toward $0.297, pairing back some losses. As traders get more time to digest the price action and the economic data calendar starts to slow down, more upside could come as price action restores itself. Maybe even $0.324 could be in the cards by New Year if ADA bulls return to the scene next week.