
Just like Bitcoin (BTC) before its rally, the price of Ethereum (ETH) may be on the verge of a significant breakout, as a key technical signal, known as the Raging Bull indicator, has just flipped in its favour. This same indicator previously predicted Bitcoin’s explosive surge to new all-time highs, and its reappearance for Ethereum is fueling fresh optimism.
Ethereum Reactivates Rare Bullish Indicator
On July 16, crypto analyst Tony Severino announced in a post on X social media that Ethereum has just flashed the critical Raging Bull indicator—a tool previously credited for accurately forecasting Bitcoin’s parabolic rally. This development, highlighted on the monthly chart, marks the potentially strongest confirmation of bullish momentum for ETH since its last major surge.
The analyst’s chart shows Ethereum closing the most recent monthly candle at $3,177, posting a 27.81% gain. This marks the first time the Raging Bull indicator has reappeared after months of absence since ETH bottomed out during the broader market correction in late 2022 and early 2023. The indicator, visible through yellow-highlighted candles, historically appeared during periods of strong upward trend formation on high time frames.

The last time Ethereum printed a similar pattern was during its famous 2020 breakout, which ultimately led to an explosive surge toward its ATH above $4,800. That run coincided with a sustained sequence of yellow candles backed by rising momentum. Based on this trend, the reappearance of the Raging Bull indicator suggests that Ethereum may be recovering from its 2022-2023 lows, highlighting the potential start of a renewed bullish phase.
Although Severino has not provided a specific price target or projection in his analysis report, the emergence of the key bullish signal on the high-timeframe chart potentially positions Ethereum in a bullish setup similar to the one Bitcoin was in when the same indicator flashed.
Bitcoin Price Action After The Raging Bull Flashed
According to a previous post, Severino revealed that Bitcoin’s Raging Bull indicator had reappeared earlier in May 2025, signaling for the first time since its last confirmed signal at the end of 2024. This technical development was marked on the weekly chart after a decisive candle close around the $97,452 level, marking a 3.91% gain.
The Raging Bull indicator first appeared during Bitcoin’s breakout in late 2023, with the momentum extending through the first half of 2024. After temporarily going dormant, the chart indicator flipped back on again around November 2024, preceding a major price rally. Its recent 2025 reappearance follows a recovery from local lows, forerunning an explosive surge in the BTC price.
Given its consistent activation during periods of uptrends, the Raging Bull signal has become a key indicator for a potential price expansion. Despite its claimed accuracy, Severino acknowledges that, like all trading systems, it is not perfect and can sometimes generate false signals.
Featured image from iStock, chart from Tradingview.com
Editorial Process for bitcoinist is centered on delivering thoroughly researched, accurate, and unbiased content. We uphold strict sourcing standards, and each page undergoes diligent review by our team of top technology experts and seasoned editors. This process ensures the integrity, relevance, and value of our content for our readers.
Reason to trust
![]()
Strict editorial policy that focuses on accuracy, relevance, and impartiality
Created by industry experts and meticulously reviewed
The highest standards in reporting and publishing
Strict editorial policy that focuses on accuracy, relevance, and impartiality
Morbi pretium leo et nisl aliquam mollis. Quisque arcu lorem, ultricies quis pellentesque nec, ullamcorper eu odio.
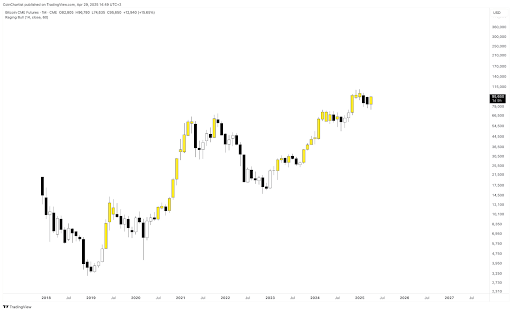
Bitcoin continues to show signs of resilience at the $95,000 region, pushing higher from recent lows and attempting to reclaim its bullish structure after a volatile April. The monthly candlestick for April on the CME Futures chart currently presents a strong bullish engulfing formation, which, if sustained into the weekly close, could provide the market with bullish momentum to close May with another bullish candle.
The potential of this bullish close is enough to sway the sentiment among bearish proponents, according to crypto analyst Tony “The Bull” Severino.
Raging Bull Tool Flashes Signal On CME Futures
Bitcoin’s price action over the past two weeks has been positive and has seen an otherwise waning bullish sentiment slowly creeping back among crypto traders. Interestingly, this price action has even seen Bitcoin’s net taker volume turn positive for the first time in a while. Although the trend is still in its early stages, the renewed strength is already beginning to soften some of the more bearish outlooks, especially as key indicators start to turn.
Related Reading
Tony “The Bull” Severino, a well-followed crypto analyst, recently revealed on social media platform X that his proprietary “Raging Bull” indicator has turned back on. However, this indicator has turned back on only on the Bitcoin CME Futures chart, not the spot BTC/USD chart.
The divergence between CME Futures and the spot chart, with only the former flashing this bullish signal, has added complexity to Bitcoin’s current outlook. The Raging Bull tool, which uses weekly price data, is designed to identify early stages of powerful upward movements. According to Severino, the appearance of this signal, despite his bearish stance, suggests a meaningful shift in market structure may be developing. However, he was quick to add that a confirmed weekly close is still necessary before any firm conclusions can be drawn.
Breaking Above This Level Is Key
Examining the monthly chart shared by the analyst, the bullish engulfing candlestick is clearly visible following a sharp rebound from April’s lows below $83,000. Bitcoin began the month of April at around $83,000, but a swift downturn in the first few days pushed the price downward until it bottomed out at around $75,000. However, the current April candle not only erases March’s losses but also indicates increased interest in Bitcoin from institutional traders on the CME platform.
Related Reading
Still, despite the encouraging candlestick formation, Bitcoin must decisively break above the $96,000 to $100,000 region, where previous uptrends have stalled. This level is acting as a ceiling that could determine whether the recent bullish momentum continues or stalls. A failure to close above this range, either on the weekly or monthly timeframe, could invalidate the Raging Bull signal.
Additionally, the Raging Bull indicator needs to turn back on the spot BTCUSD chart to confirm a strong bullish outlook. This can only be done if Bitcoin manages to break substantially above $96,000.
At the time of writing, Bitcoin is trading at $94,934.
Featured image from Pixabay, chart from Tradingview.com
Dogecoin Holders Are RAGING! New ICO is Stealing the Show With 100x Gains NewsBTC
Source link ]]>
Shiba Inu (SHIB) threatens to top DOGE: This crypto battle is raging! Cointribune EN
Source link ]]>

Kadena price rebound accelerated on Monday as demand for the token continued rising. The KDA token jumped to a high of $2.42, which was the highest point since May 25th this year. It has risen by over 76% above the lowest point this year, bringing its total market cap to over $445 million.
KDA demand continues
Kadena is an upcoming blockchain project that seeks to become the best platform for developers to create decentralized applications. It was launched by a team of developers who helped to launch JP Morgan’s internal cryptocurrency.
Kadena is different from most other Ethereum rivals. For one, it is a proof-of-work blockchain, means that new coins are produced via mining. Kadena developers have created a situation where mining does not necessarily lead to more carbon emissions.
At the same time, Kadena is one of the fastest layer-1 blockchains in the world. According to its developers, Kadena can handle over 450,000 transactions per second (TPS). This is a notable figure since Visa and Mastercard handle less than 10,000 tps each. Solana handles 2,500 tps while Ethereum can process less than 25 tps.
Still, a major challenge for Kadena is that its ecosystem is still significantly tiny than that of its peers. According to DeFi Llama, the platform has just five DeFi applications that have a combined total value locked (TVL) of over $7.7 million.
The main reason why Kadena price is rising is that Kaddex, a new DEX launched in its platform has grown its TVL to over $4.4 million. This is a strong number considering that it was launched last week. Other Kadena DeFi apps with over $1 million in TVL are Babena and KDSwap.
The ecosystem will likely continue growing following the recent grants by Kadena Eco. Some of the top apps that received funding by Kadena are Electron Labs, Hypercent, and KDLaunch.
Kadena price prediction
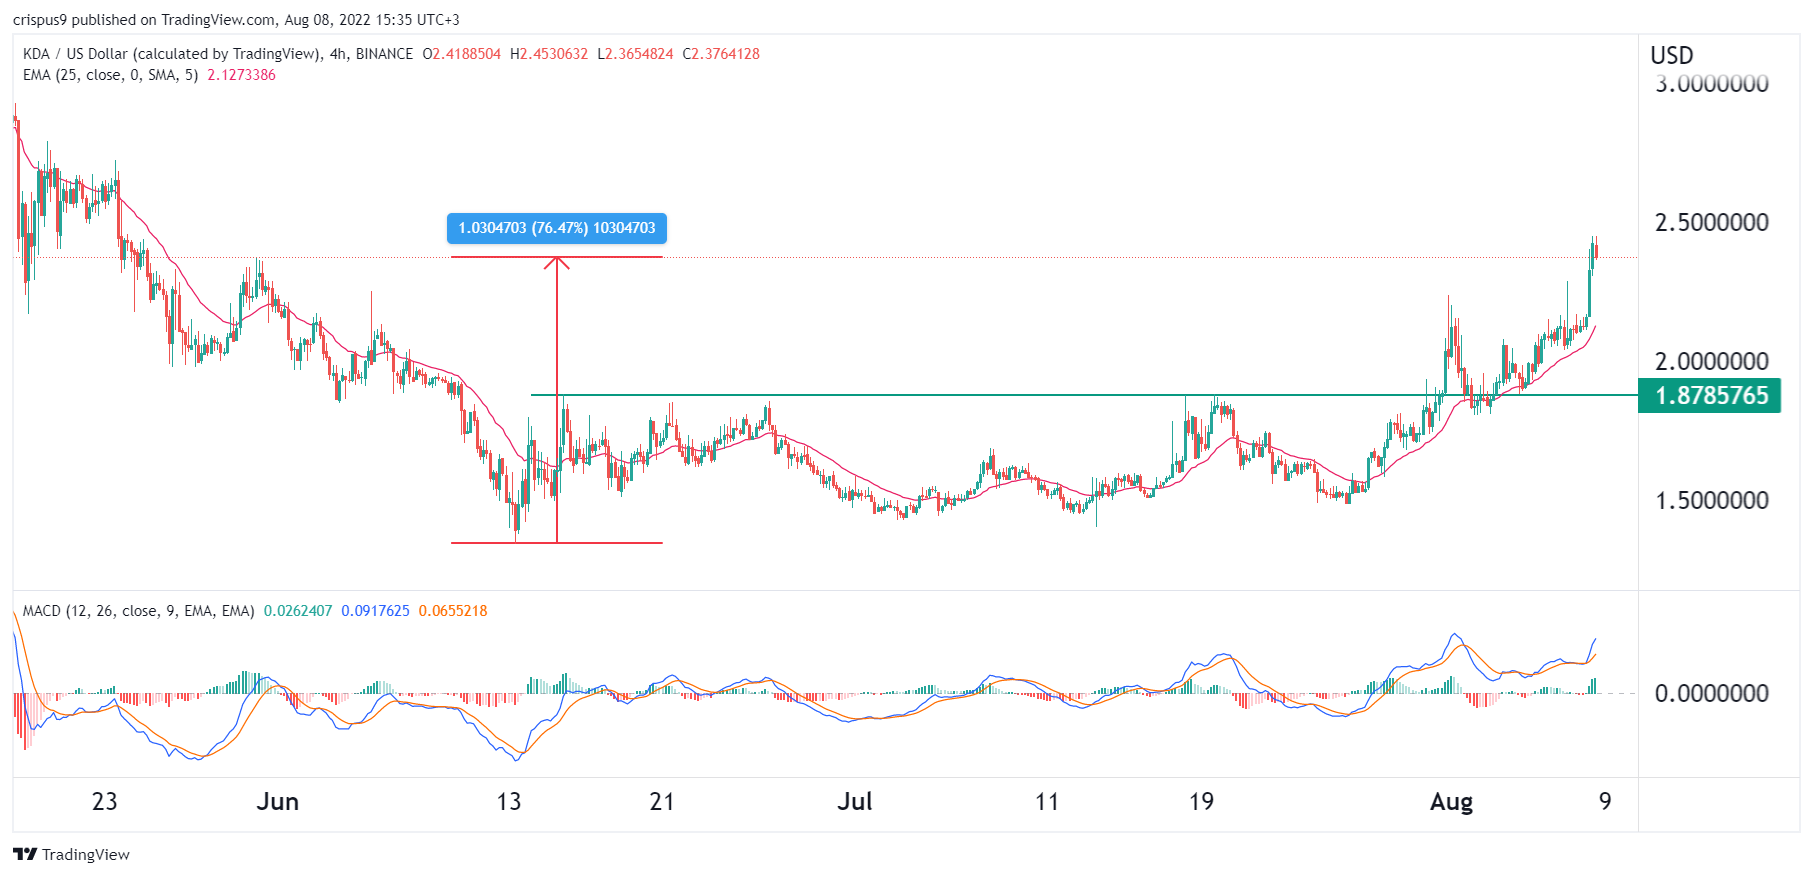
The four-hour chart shows that the KDA price has been in a strong bullish trend in the past few weeks. As it climbed, it managed to move above the important resistance at $1.8785, which was the highest point on July 19th.
The coin has moved above the 25-day and 50-day moving averages while the MACD has moved above the neutral point. Therefore, the coin will likely keep rising as bulls target the next key resistance point at $2.75, which is about 16% above the current level.
The post Kadena price prediction: Is this the return of the raging bull? appeared first on CoinJournal.
]]>