Crypto analyst Kabuki has explained why the Bitcoin rainbow chart shows that the price range is above $60,000. The analyst noted that BTC is mirroring past cycles and suggested that a base may be forming soon for the leading crypto.
Bitcoin Rainbow Chart Shows Why Price Is Ranging
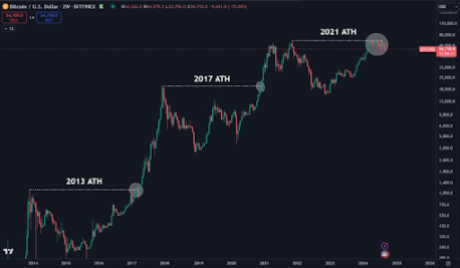
In an X post, Kabuki said that Bitcoin is stuck between $65,000 and $68,000 for a reason and that this isn’t random but simply BTC repeating history. He noted that in 2017, a base formed, which led to a parabolic expansion. The same happened in 2021, which again led to a parabolic expansion.
Related Reading
Kabuki stated that the same structure is playing out again for Bitcoin this time around and that this range is an accumulation phase before the breakout. His accompanying chart showed that the leading crypto is likely to rally as high as $400,000 in the next bull cycle, with a top likely in 2029. Meanwhile, the chart also confirmed that a bottom may be forming soon, with the current range a good buy zone.

However, Kabuki suggested that there is still the possibility of Bitcoin dropping to $42,000. In another X post, he said that BTC is perfectly following a descending channel pattern with the drop from its all-time high (ATH) around $125,000. The analyst predicted that the leading crypto could drop from $69,000 to $42,000 as this bearish pattern continues to play out. He added that lower highs plus more lower highs will lead to the last shakeout before the rally to $200,000.
BTC Back Inside The Bear Flag
In an X post, crypto analyst Colin stated that Bitcoin is back inside the bear flag, providing optimism about a bullish reversal. However, he warned that the highest the market may see is a short-term BTC rally to $80,000 if the U.S.-Iran war actually ends. The analyst added that Bitcoin will have to prove itself by first breaking above the resistance levels immediately ahead.
Related Reading
Colin reiterated that any short-term pump in Bitcoin will eventually be sold off and that the downtrend will resume in time. As such, he opined that any pump will be a chance to offload heavy positions rather than as a shot at new ATHs.
The analyst also agreed with another analyst’s view, noting that the broader trendline is looming despite Bitcoin’s return within the channel. The analyst stated that there will be a true change in structure only if BTC breaks this trendline. He added that this could happen at lower levels, but that it is hard to say this was the bottom range.
At the time of writing, the Bitcoin price is trading at around $68,700, down in the last 24 hours, according to data from CoinMarketCap.
Featured image from Pixabay, chart from Tradingview.com
Crypto analyst Daan Crypto has highlighted a Bitcoin Rainbow Chart, which has provided insights into the crypto’s current price action. The analyst also suggested that Bitcoin needs to hold above $60,000 to make a bullish reversal.
Bitcoin Needs To Break Above $60,000
In an X (formerly Twitter) post, Daan Crypto suggested that Bitcoin needs to break above $60,000 to enjoy a bullish reversal and possibly reach new highs in this market cycle. The crypto analyst noted that Bitcoin was still trading in the dark green region on the accompanying Rainbow chart as it struggles to hold on to the $60,000 range.
Related Reading
Meanwhile, as Bitcoin struggles to break above $60,000, Daan Crypto raised the possibility of the leading crypto dropping below $51,000, the blue area on the Rainbow chart. The crypto analyst suggested it would present an excellent buying opportunity, stating that the blue area has historically been a good accumulation area in higher timeframes.
Bitcoin’s price action has remained tepid since hitting a new all-time high (ATH) of $73,000 in March earlier this year. This has raised concerns that the bull market might be over and that the crypto market is slowly entering a bear market. However, Daan Crypto has provided some reassurance that the best is still yet to come for Bitcoin.
In another X post, the crypto analyst stated that he doesn’t feel like the past six months are that odd despite Bitcoin’s price action. He noted that this cycle is like no other, as he provided insights into a plausible reason why the leading crypto’s price has remained stagnant since March. Bitcoin hit a new ATH before the halving event in April, which has never happened before.
In line with this, Daan Crypto stated that Bitcoin is technically still ahead of where it would have been in previous cycles. This suggests that the crypto has stalled to consolidate and resynchronize with previous halving cycles. Crypto analyst Rekt Capital once echoed a similar sentiment while warning that Bitcoin’s failure to consolidate would lead to an accelerated cycle.
More Liquidity Will Soon Flow Into BTC
Arthur Hayes, the co-founder of the BitMEX crypto exchange, recently stated that he anticipates more liquidity to flow into Bitcoin. As such, he predicts that Bitcoin “might” rise if things continue to play out the way he expects. Hayes’ bullish prediction stems from his outlook on the macroeconomic side.
Related Reading
He noted that Janet Yellen, the US Treasury Secretary, released a statement over the weekend in which she maintained that the US economy is heading towards a soft landing despite the recent weak job reports. Therefore, the crypto market is expected to recover if Yellen and the US Federal Reserve work towards quantitative easing (QE).
At the time of writing, Bitcoin is trading at around $54,800, up over 1% in the last 24 hours, according to data from CoinMarketCap.
Featured image created with Dall.E, chart from Tradingview.com
Bitcoin, the undisputed king of cryptocurrencies, faces a challenge as it approaches a critical moment. After a stellar run in the first half of 2024, breaking past the crucial $71,000 barrier, the digital gold has retreated, currently hovering around the crucial $61,000 support zone. This recent dip has sparked a debate amongst analysts, with some clinging to bullish long-term outlooks and others cautioning of potential headwinds.
Related Reading
Rainbow Whispers: A Golden Buying Opportunity Or Fool’s Gold?
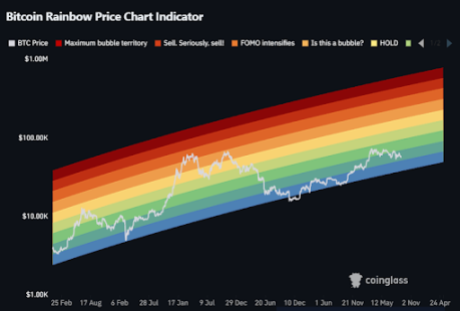
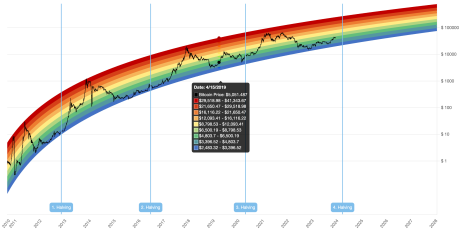
One factor keeping some bulls optimistic is the Bitcoin Rainbow Chart, a popular tool that analyzes price movements on a logarithmic scale. This chart currently positions Bitcoin in the “Buy” zone, suggesting there’s ample room for growth before reaching a peak.
Additionally, historical price cycles, specifically those following halving events (where the number of Bitcoins rewarded to miners is halved), point towards a potential maximum price point around September-October 2025. This optimistic timeline translates to a potential price target of $260,000 or even higher, according to some analysts.
However, not everyone is swayed by the Rainbow’s charm. Critics point out that the chart is a historical indicator, and past performance doesn’t guarantee future results. The recent decline in the “Coinbase Premium Index” throws a bucket of cold water on the optimist’s parade.
This index reflects the difference in price between Bitcoin traded on US exchange Coinbase and international markets. A negative index, as seen currently, suggests waning interest from US investors, a significant market segment.
Investor Jitters And Declining Open Interest
Another cause for concern is the palpable fear and caution gripping investors. The recent price drops have shaken confidence, with many adopting a wait-and-see approach. This sentiment is reflected in the sharp decline of “Open Interest,” a metric that tracks the total value of outstanding futures contracts.
With investors hesitant to take long positions on Bitcoin due to the recent slump, Open Interest has dropped significantly, indicating a potential pullback in market participation.
However, some analysts see this decline as a necessary correction. They argue that an overheated futures market fueled by excessive leverage can lead to unsustainable bubbles. The current drop, they believe, is weeding out these overleveraged players, paving the way for a more stable, long-term growth trajectory for Bitcoin.
Related Reading
A Bumpy Ride Ahead For Bitcoin?
The future of Bitcoin remains shrouded in some uncertainty. While the potential for significant growth based on historical trends and the Rainbow Chart is undeniable, short-term investor sentiment and declining US market participation cannot be ignored.
The coming months will be crucial in determining whether Bitcoin can weather the current storm and resume its ascent or succumb to bearish pressures.
Featured image from Shutterstock, chart from TradingView
The Bitcoin Rainbow Chart has emerged as a universally used analytics tool that helps crypto investors and traders predict BTC’s ever-changing market trends and cycles.
Bitcoin Rainbow Chart BTC Analysis
Throughout the year, the price of Bitcoin has experienced several uptrends and downsides. Starting from the last three months of 2023, BTC’S price has experienced a major surge, hitting above $35,000 in October and surging past $44,000 in December.
With the market moving up rapidly, many crypto investors and market watchers look for various crypto analytics tools to enhance their understanding of the Bitcoin market trends.
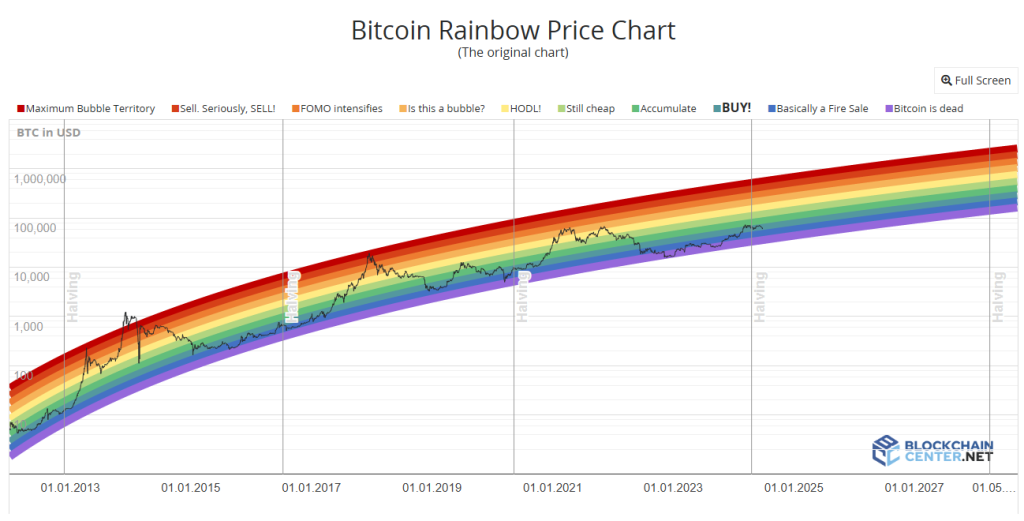
The Bitcoin Rainbow Chart is one of the many analytics tools available for predicting the potential prices of BTC. This color-coded chart is a long-term valuation tool for BTC that uses a logarithmic growth curve to forecast the potential price of BTC.
Source: Blockchain Center
Currently, according to the rainbow chart, Bitcoin is positioned around the “Accumulate” and “Still cheap” zones. This implies that the chart is showing the best timeline to purchase BTC before the selling phase begins.
The Bitcoin Rainbow Chart simplifies BTC price predictions, helping investors identify potential BTC buying and selling opportunities. However, it’s important to note that the Bitcoin Rainbow Chart is not investment advice and does not predict the exact price of Bitcoin.
BTC price readies to retest $43,000 | Source: BTCUSD On Tradingview.com
History Of The BTC Rainbow Chart
The Bitcoin Rainbow Chart first started as a fun project created by a Reddit user, Azop to visually represent Bitcoin’s price history. However, the chart became more mainstream after a second version was developed by trader Trololo and transformed into a crypto technical analysis tool.
The chart is designed using a color coding scheme and highlights each Bitcoin halving cycle and diverse BTC price ranges. With its seven color bands, the rainbow chart identifies strategic points to buy, sell, or hold BTC.
The dark red band signals a maximum bubble territory, the red band indicates a robust selling phase, while orange and yellow signify FOMO intensification and HODL periods respectively. The Green band indicates a favorable buying and accumulation window and lastly, the blue color band represents a fire sale opportunity.
While the Bitcoin Rainbow Chart does not provide financial advice, it is a widely recognized tool used by crypto traders and investors to gain a simpler understanding of BTC market movements. Ultimately, the accuracy of the chart’s predictions depends on how it is applied and in what context.
Featured image from Crypto.com, chart from Tradingview.com
Disclaimer: The article is provided for educational purposes only. It does not represent the opinions of NewsBTC on whether to buy, sell or hold any investments and naturally investing carries risks. You are advised to conduct your own research before making any investment decisions. Use information provided on this website entirely at your own risk.
Dogecoin Worth In 2030 – Bitcoin Rainbow Chart 2022-where to get … Indie Shuffle Music News
Source link ]]>