Decentralized application (dApp) platform Near Protocol exhibited notable growth in key metrics during the first quarter (Q1) of 2024, driving its native token NEAR to reclaim a crucial key level and paving the way for a potential retest of its all-time high (ATH) from January 2022.
According to a recent report by Messari, NEAR experienced significant increases in market capitalization, revenue, active addresses, and Total Value Locked (TVL), solidifying its position among the top players in the cryptocurrency market.
NEAR Outperforms Bitcoin And Ethereum
In Q1 2024, NEAR’s circulating market cap surged to $7.2 billion, marking a 94% quarter-on-quarter (QoQ) increase. The fully diluted market cap also witnessed substantial growth, reaching $8.2 billion, representing a 91% QoQ increase. These numbers propelled NEAR to secure a spot among the top 20 cryptocurrencies by market capitalization.
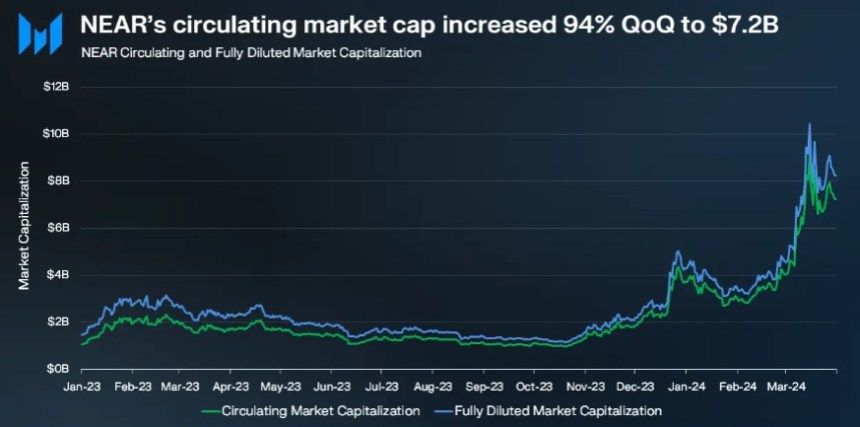
Notably, NEAR outperformed Bitcoin (BTC) and Ethereum (ETH), which recorded QoQ growth rates of 69% and 53%, respectively. Additionally, NEAR’s revenue, derived from network transaction fees, witnessed an 82% QoQ increase, reaching $1.9 million.
NEAR continued its address growth trend in Q1 2024, with average daily active addresses reaching 1.2 million, representing a robust 42% QoQ increase.
The network also witnessed a surge in daily new addresses, totaling 236,000 (a 37% QoQ increase), and surpassed the milestone of 100 million total accounts.
According to Messari, contributions from established protocols like KAIKAINOW, Sweat, and Playember and the adoption of HOT Wallet, averaging over 350,000 daily active addresses in March and nearly 3 million total wallets, drove this expansion.
Stablecoin Market Cap Soars In Q1
Per the report, the protocol experienced a sustained increase in transaction activity throughout Q1 2024, with daily transactions reaching 4.3 million, representing a 78% QoQ increase and a 538% increase over the last six months.
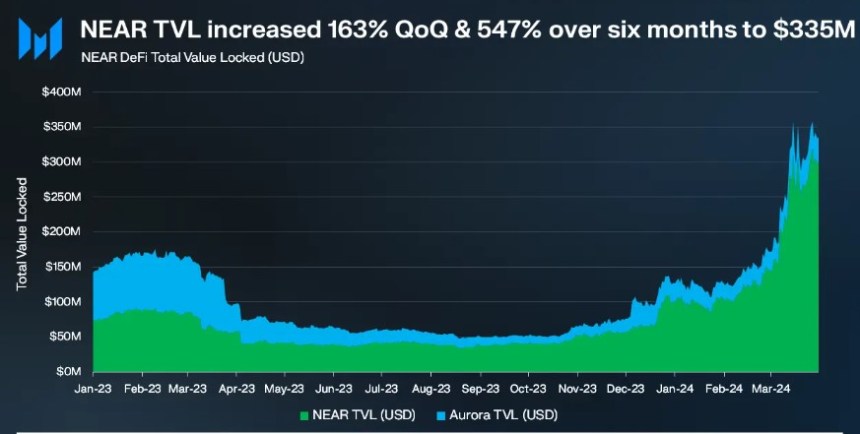
Similarly, NEAR’s TVL witnessed substantial growth, ending the quarter at $335 million, a 163% increase from the previous quarter and a 547% increase over the last six months.
Furthermore, NEAR’s decentralized exchange (DEX) volume experienced a notable surge, with an average daily volume of $8 million, representing a 95% QoQ increase. Ref Finance emerged as the leading DEX on the protocol, with $6 million daily volume, surpassing Orderly Network.
Lastly, NEAR observed a significant increase in its stablecoin market cap during Q1 2024, soaring 176% QoQ to $214 million. Notably, USDT experienced a significant surge, with its market cap increasing by 1,155% QoQ, reaching $88 million.
Outperforming Top 20 Cryptocurrencies
Regarding price action, NEAR Protocol’s native token has exhibited strong performance, surpassing the top 20 cryptocurrencies in the market with a 9.4% uptrend in the past seven days. Meanwhile, Bitcoin has experienced a minor 1.5% price correction over the past 24 hours.
This positive trend has enabled NEAR to reclaim the significant $7.40 price level, which is important for bullish investors.
Looking ahead, the $7.60 mark may present a potential resistance level for the token, serving as a crucial barrier to monitoring. It could pave the way for a retest of the $8 mark, signaling further upward momentum if successfully breached.
Conversely, the $6.80 mark has demonstrated its significance as a key support level. It was previously tested over the weekend and effectively prevented a more significant price decline.
Despite the optimistic outlook, it is important to note that the token remains down by over 64% from its all-time high of $20.4, reached in 2022.
Featured image from Shutterstock, chart from TradingView.com
Disclaimer: The article is provided for educational purposes only. It does not represent the opinions of NewsBTC on whether to buy, sell or hold any investments and naturally investing carries risks. You are advised to conduct your own research before making any investment decisions. Use information provided on this website entirely at your own risk.


Bitcoin bulls managed to shake off December’s dust, decisively pushing past $17,000 for the first time in over three weeks. The world’s most traded cryptocurrency was trading at $17,348, up over 2.41% in the past 24 hours.
Ethereum led in gains surging by over 4.55% in the same period to trade at $1,330 Monday noon. Other cryptocurrencies in the top 15 groups by market capitalization also gained steam, led by Solana and Cardano, up over 22% and 13%. Dogecoin, BNB and MATIC followed quietly, adding over 8%, 7% and 3.20% overnight. Overall, the global crypto market cap increased by 3.49% to tap $855.83B, according to data from CoinMarketCap.
Bitcoin’s surprising rebound comes after Friday’s positive nonfarm payment rolls data. While this data suggests an imbalance between labour supply and demand still exists, investors viewed cooling wages as a sign the Fed may slow its rate-hiking ambitions. Moreover, with the US inflation expected to remain stable in the coming week, economists have been pencilling in a 25 basis-point increase in the Fed’s benchmark rate, with some FED officials suggesting that a half-point hike is possible.
Fed’s monetary tightening is a big factor in Bitcoin’s price movement, contributing significantly to the cryptocurrency’s 64% decline last year. Observers have thus argued that the top crypto benefits immensely from the FED easing its monetary policy.
On January 4, the Chicago Mercantile Exchange (CME) announced that hedge funds significantly reduced their Bitcoin short positions “across the board” towards the end of 2022. Bitcoin futures open interest decreased by 1,086 from 14,124 on December 27 to 13,038 on January 4. This rate of decline suggests that investors should keep an eye on the conversion movement with long bets.
 
 
Confidence in the crypto sector has also been rekindling as authorities continue to crack down on FTX officials and other rogue actors worldwide-suggesting regulations may soon follow. According to John Reed Stark, Former Chief of SEC’s Office of Internet Enforcement, the trend is likely to continue, bringing back crypto’s shine and allure.
Onchain, Bitcoin’s sentiment indicator, has turned neutral, with exchange signals tilting to extremely bullishness, according to data from the crypto analytics platform IntoTheBlock. 53% of BTC holders are also depicted as making money at the moment, with only 37% being in the loss.
While there is still room for Bitcoin to plummet, traders expect the price to mount a mini rally towards the $18,200 resistance. According to Cryptoquant’s “Greatest_Trader”, “the end of the current bear market won’t be expected unless the price surpasses the realized price, currently at $19.7K.”
- ATOM’s price shows strength as it bounces from a downtrend range price rallied to a high of $14 with eyes set on $17.
- ATOM could rally more as the price creates more bullish bias by breaking out of a downtrend descending triangle with eyes set on rallying higher.
- ATOM’s price remains strong on the daily timeframe above the 50 Exponential Moving Average (EMA) as the price aims for more rallies.
The price action displayed by Cosmos (ATOM) has been tremendous as the price resisted the bears rallying from a region of $12.7 to a high of $14, reclaiming a vital support area it has built in the past few weeks. The crypto market is looking increasingly welcoming as many altcoins continue producing over 50% gains. The likes of DOGE have seen some great runs recently, rallying from a low of $0.055 to a high of $0.15, with many others as Cosmos (ATOM) continues to lead the charge for more price recoveries. (Data from Binance)
Cosmos (ATOM) Price Analysis On The Weekly Chart
Cosmos (ATOM) has struggled to regain its bullish momentum in recent times; despite the uncertainty that has befallen the crypto space, the price of ATOM has enjoyed a measure of relief after showing so much strength on the weekly low, rallying from a low of $12.7 to a high of $14 and recapturing this region as it forms key support for more potential to rise higher.
The past weeks have been nothing short of a boring and difficult moment for the crypto market as this affected the price of most altcoins negatively, forcing them to lose their support zone, with others battling it to stay afloat of their price.
After its weekly close of above $13.5, ATOM’s price looked stronger as the price of ATOM geared up for more upside price moves.; the price has faced a minor rejection to break higher to a region of $17.
Weekly resistance for the price of ATOM – $17.
Weekly support for the price of ATOM – $13.5.
Price Analysis Of ATOM On The Daily (1D) Chart

In the daily timeframe, the price of ATOM continued to look strong as the price broke out of its descending triangle, with good volume rallying to a high of $14 and forming good support around $13.5 below its current value of $14.1. Still, the price of ATOM faces a little rejection; the price of ATOM needs to break and hold above $14.5 for the price to become more bullish once more.
The price of ATOM faces a resistance to break and hold above 200 EMA, which corresponds to $14.5. A break and close above this region could send the price of ATOM to a region of $17 and possibly a retest of $20 region acting as a supply zone.
Daily resistance for the ATOM price – $14.5.
Daily support for the ATOM price – $13.5.
Featured Image From Blockchain News, Charts From Tradingview
- SOL’s price shows strength as it bounces from a downtrend range after losing its key Support to a region of $28.
- SOL faces a major issue to hold above Support and trend higher above $34 after the price broke out of its downtrend descending triangle price movement.
- SOL’s price remains strong on the daily timeframe below the 50 Exponential Moving Average (EMA) as the price aims for more rallies.
The price of Solana (SOL) bounced from its low at around $27.5 after losing its key Support and reclaiming this important region as the price of Solana (SOL) eyes more rallies if the market continues to look more promising. The past few days have seen the crypto market has looked more decent, with the likes of Bitcoin (BTC) and Ethereum (ETH) showing some great price movement in recent times. The SOL price rallied from $27 to a region of $31 as the price aims to perform better after looking at more of a range movement in recent times. (Data from Binance)
Solana (SOL) Price Analysis On The Weekly Chart
In recent times, Solana has struggled to regain its bullish momentum; despite the uncertainty that has befallen the crypto space, the price of SOL hasn’t enjoyed a measure of relief following the fact it has many projects building on its ecosystem and its popularity to tip Ethereum in terms of use and transaction speed.
SOL’s price had struggled to replicate its rally that took the price of SOL to an all-time high of $250 before it faced rejection to trend higher.
After trading in a range for weeks as the price continued to look untradable with little to no volume pushing price higher as the price continued to look stagnated, SOL finally showed some movement, rallying from its weekly low of $27.5 after the price of SOL lost its key Support of $30 to a high of $31 with the market showing some great recovery signs.
The price of SOL faces a difficult decision to rally to a high of $35, as this could trigger further upside movement to the $45 range.
Weekly resistance for the price of SOL – $35.
Weekly Support for the price of SOL – $30.
Price Analysis Of SOL On The Daily (1D) Chart

In the daily timeframe, the price of SOL continues to trade narrowly above the key Support at $30 after the price lost this key Support as the price traded to a region of $27.5, breaking out below from its descending triangle.
The price of SOL needs to break and hold above $35 for the price to trend higher to a region of $45-$60, which is a key supply zone for most traders.
The Fibonacci retracement (Fib) value of 23.6% indicates SOL price needs to break and hold above this region for the price to trade higher. The price of $32.5 corresponds to the Fib value of 23.6%. If the price of SOL closes above this level, we could see a rally to $35.
Daily resistance for the SOL price – $35.
Daily Support for the SOL price – $30.
Featured Image From Coinpedia, Charts From Tradingview