Featured image from Pexels, chart from TradingView.com

Trusted Editorial content, reviewed by leading industry experts and seasoned editors. Ad Disclosure
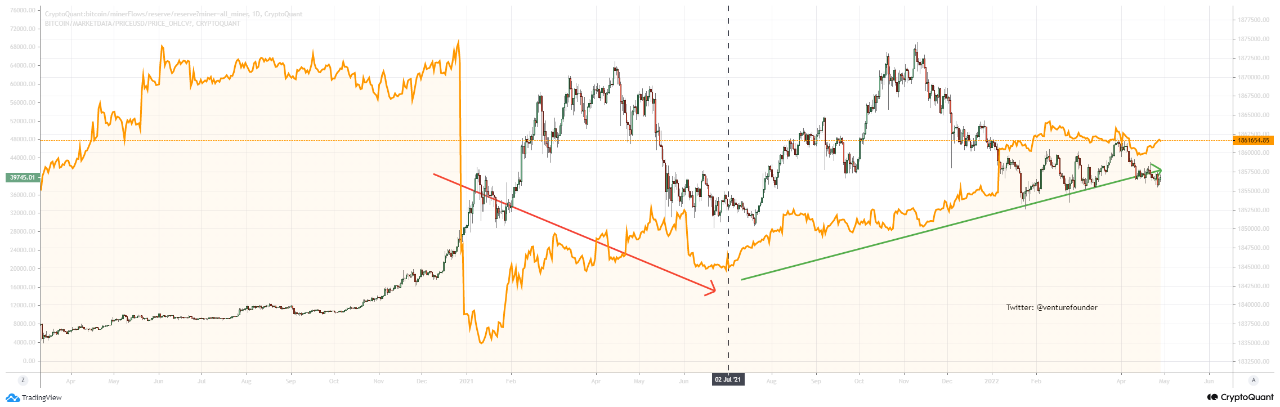
Ethereum is testing resistance as the market finds some relief. The price is at a decision point. And a CryptoQuant analyst has identified a supply structure beneath that resistance that has no precedent in the current cycle — and a clear one in the cycle that preceded it.
The analyst’s data reveals a 57% collapse in Ethereum’s exchange supply: reserves have fallen from approximately 35 million ETH to 14.9 million ETH — a reduction that leaves significantly less ETH available for immediate sale than at any comparable point during the 2020-2021 period. The coins have not disappeared. They have moved into the custody of holders who are not sending them to exchanges to sell.

The inflow data confirms the behavioral picture. Exchange inflows have increased recently — but the scale remains dramatically below the peaks of the 2021-2022 cycle top, when inflows approached the 10 to 20 million ETH range. The current clusters are a fraction of those peaks. Large-scale distribution — the kind that characterized the previous cycle’s top — is not present in the data.
Ethereum testing resistance with 57% less sellable supply than its previous cycle peak, and without the distribution behavior that accompanied that peak, is a structurally different test. The overhead exists. The ammunition to sustain it is historically thin.
Two Signals. One Conclusion
The analyst’s framework rests on the relationship between two independent data points that are currently moving in a configuration that has historically mattered. The first is what has happened to exchange reserves: a 57% collapse that has removed the majority of ETH’s immediately available sell-side supply from the market.
The second is what has not happened to exchange inflows: the extreme deposit spikes — 10 to 20 million ETH ranges — that characterized the 2021-2022 distribution phase have not returned. Holders are not flooding exchanges with ETH to take profit or cut losses at scale.

That combination — supply depleted, distribution absent — describes a market where the structural pressure for downside has been significantly reduced without the structural signal of panic that typically accompanies cycle bottoms at their most acute. The market is not experiencing forced selling at a scale that matches previous major lows. It is experiencing quiet.
The price context adds the final dimension. Ethereum is currently moving near the lows of previous correction ranges — the price levels that, in prior cycles, represented the zone where the risk-reward balance shifted in favor of patient capital rather than continued selling.
The analyst names this carefully: a constructive signal under current conditions. Not a confirmation. Not a guarantee. A structural alignment between depleted supply, absent distribution pressure, and historically significant price levels that, taken together, describes a market where the conditions for recovery are present even if the catalyst has not yet arrived.
Ethereum Reclaims Weekly Pivot as Recovery Tests Structure
Ethereum is trading near $2,350–$2,400 on the weekly timeframe, reclaiming a key pivot level that has repeatedly acted as both support and resistance throughout the current cycle. After the sharp drawdown earlier in 2026, ETH has staged a recovery from the $1,600–$1,800 region, where strong demand emerged and halted the decline.
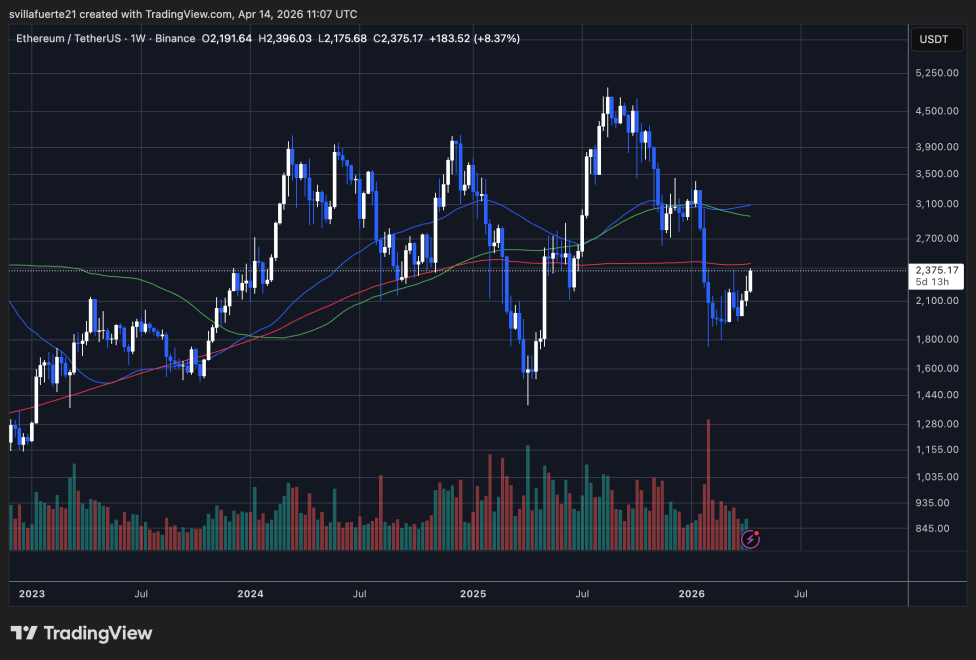
The current structure reflects a market attempting to transition back toward equilibrium. Price is now interacting with the 100-week (green) and 200-week (red) moving averages, which are converging near the $2,300 zone. This area represents a critical technical threshold: reclaiming it suggests stabilization, while failure would reinforce the broader corrective trend.
The 50-week moving average (blue) is flattening and beginning to turn upward, indicating improving short-term momentum. However, ETH has not yet established a clear higher high on the weekly timeframe, which keeps the recovery unconfirmed.
Volume patterns remain consistent with a post-capitulation environment. The spike during the sell-off indicates forced liquidations, while the subsequent normalization suggests reduced stress but not strong accumulation.
Structurally, Ethereum is at a decision point. Sustained acceptance above $2,400 would open the path toward $2,800–$3,100, while rejection would likely return price toward the $2,000 support zone.
Featured image from ChatGPT, chart from TradingView.com
Editorial Process for bitcoinist is centered on delivering thoroughly researched, accurate, and unbiased content. We uphold strict sourcing standards, and each page undergoes diligent review by our team of top technology experts and seasoned editors. This process ensures the integrity, relevance, and value of our content for our readers.
Shiba Inu (SHIB) Price Prediction: 1.56 Million Wallets Hold as 78% Refuse to Sell Below Support openPR.com
Source link ]]>
Ripple Holders Refuse to Sell, Dogecoin (DOGE) Price Risks Adding Zero, Bitcoin (BTC) Might Lose $100,000 — Crypto News Digest TradingView
Source link ]]>
Cardano Holders Refuse to Sell—Here’s What This Means for ADA Prices BeInCrypto
Source link ]]>
They say journalists never truly clock out. But for Christian, that’s not just a metaphor, it’s a lifestyle. By day, he navigates the ever-shifting tides of the cryptocurrency market, wielding words like a seasoned editor and crafting articles that decipher the jargon for the masses. When the PC goes on hibernate mode, however, his pursuits take a more mechanical (and sometimes philosophical) turn.
Christian’s journey with the written word began long before the age of Bitcoin. In the hallowed halls of academia, he honed his craft as a feature writer for his college paper. This early love for storytelling paved the way for a successful stint as an editor at a data engineering firm, where his first-month essay win funded a months-long supply of doggie and kitty treats – a testament to his dedication to his furry companions (more on that later).
Christian then roamed the world of journalism, working at newspapers in Canada and even South Korea. He finally settled down at a local news giant in his hometown in the Philippines for a decade, becoming a total news junkie. But then, something new caught his eye: cryptocurrency. It was like a treasure hunt mixed with storytelling – right up his alley!
So, he landed a killer gig at NewsBTC, where he’s one of the go-to guys for all things crypto. He breaks down this confusing stuff into bite-sized pieces, making it easy for anyone to understand (he salutes his management team for teaching him this skill).
Think Christian’s all work and no play? Not a chance! When he’s not at his computer, you’ll find him indulging his passion for motorbikes. A true gearhead, Christian loves tinkering with his bike and savoring the joy of the open road on his 320-cc Yamaha R3. Once a speed demon who hit 120mph (a feat he vowed never to repeat), he now prefers leisurely rides along the coast, enjoying the wind in his thinning hair.
Speaking of chill, Christian’s got a crew of furry friends waiting for him at home. Two cats and a dog. He swears cats are way smarter than dogs (sorry, Grizzly), but he adores them all anyway. Apparently, watching his pets just chillin’ helps him analyze and write meticulously formatted articles even better.
Here’s the thing about this guy: He works a lot, but he keeps himself fueled by enough coffee to make it through the day – and some seriously delicious (Filipino) food. He says a delectable meal is the secret ingredient to a killer article. And after a long day of crypto crusading, he unwinds with some rum (mixed with milk) while watching slapstick movies.
Looking ahead, Christian sees a bright future with NewsBTC. He says he sees himself privileged to be part of an awesome organization, sharing his expertise and passion with a community he values, and fellow editors – and bosses – he deeply respects.
So, the next time you tread into the world of cryptocurrency, remember the man behind the words – the crypto crusader, the grease monkey, and the feline philosopher, all rolled into one.
DOGE holders refuse to concede to the bear market even as Dogecoin price nears September 2022 lows FXStreet
Source link ]]>
OpenSea is a renowned marketplace similar to Esty, Amazon, and eBay. However, the only difference here is the items available for purchase. All items on the market are special digital collectibles that come as NFTs (nonfungible tokens). Market users can buy, sell, or mint these tokens.
OpenSea users carry out their transactions through self-executed smart contracts provided on the platform. This method of operation is quite significant for fair and successful trades.
The platform offers multiple trading options to users on the marketplace, such as atomic and peer-to-peer transactions.
OpenSea NFT Services Post Merge
While the marketplace proves to be a good platform for NFT transactions, OpenSea came up with new development in its services. The company recently announced that it’s not overly concerned about forked NFTs. However, it cited that its services will concentrate more on PoS NFTs.
The NFT marketplace announced on Twitter that potential forks would not reflect on its platform. Primarily, its services will be targeted at nonfungible tokens available on the upgraded blockchain network.

At the moment, OpenSea marketplace is improving its platform in wait for the upcoming Merge. The idea is to prepare the marketplace for possible hassles upon the Merge. This development is necessary to guarantee the successful transition of the network.
The marketplace encourages its users, citing that it’ll maintain uninterrupted communication until the migration process is complete. It believes that the Merge will go on smoothly without any major hitch. This is because its team is currently on the Ethereum website to check out the progress of the Merge.
Other Platforms In Watch
OpenSea is not the only company showing interest in the network transition. Chainlink is also expressing some level of commitment to the progress of the upgrade.
The Ethereum-based decentralized blockchain, Chainlink, also announced that it wouldn’t focus on Ethereum-forked NFTs. This is slated to kick off after the successful transition to the Proof of Stake system. However, Chainlink addressing its community cited that it’s doing its best to sustain the platform regardless of any hassle with the Merge.
Lex Sokolin’s Take On ETH Price
While some of ETH’s supporters believe that the Merge will impact the price of ETH positively, Lex Sokolin thinks otherwise. Sokolin, in an interview, cited that the price of ETH might be affected due to economic design changes.
He added that after the Merge, these changes might affect the supply of ETH, which will, in turn, reflect its price. Although the economist believes this could happen, he stated it’s not inevitable. Moreover, the digital currency market is the only decider of the price of Ethereum after the Merge.
In the meantime, the price of the upcoming Ethereum PoS fork’s native token trades at $100. Although it’s not available for sale yet, some exchanges already have it listed on them.
Bitcoin has been taking hit after hit from bears who want to see the price of the digital asset crumble to its lowest point. This has led to struggles on the part of bitcoin to keep up its price. However, with so many events working against the crypto industry and a large number of investors pulling out of the market, the digital asset has had a hard time maintaining its price above its last cycle high.
Bitcoin Falls Below $20,000
Bitcoin’s price has now fallen below $20,000 for the third time this year with so many hurdles in between. After struggling to maintain $22,000, the bears had once again seized control, which resulted in another dip. Bitcoin’s fall to the $19,000 level carries the same implications as it has the other times but one thing that differentiates them is where the price had peaked before it made this fall.
Related Reading | Wall Street Investors Expect Bitcoin To Hit $10,000, Is This Possible?
It is not surprising given the rate at which money is moving out of the digital asset. It is nowhere near the previous bottoms of other bear markets. However, investors have been taking heavy losses due to the fact that the crash in June was one of the worst crashes ever recorded in the history of the cryptocurrency.
Reports even show that those who have held their coins for 3-5 years, who would normally still be in some profit even during a bear market are selling their coins for a 33% loss on average. Such high loss margins speak even worse for shorter-term investors who have been recording the worst losses.
BTC loses footing above $20,000 | Source: BTCUSD on TradingView.com
Profitability Begins To Fall
For most of the market crashes, the profitability for bitcoin holders has been holding up and remained in the majority. This was due to a large number of bitcoin holders being long-term investors and the digital asset maintaining above its previous cycle peak. However, as bitcoin has dropped below $20,000, its profitability has declined drastically.
Data from IntoTheBlock puts into perspective just how much profitability has declined in the last couple of months. The number of holders in losses and profit is now at an equal percentage, with 48% on each side. The remaining 3% of holders are simply in the middle at this point.
Related Reading | Bitcoin Daily Exchange Net Flows Shows Sell-Offs Have Not Subsided
The exchange inflows highlighted on the platform speak volumes about the sell-offs that have been happening in the space. In the last seven days, there have been $4.14 billion worth of inflows, and although outflows have surpassed this with a volume of $4.27 billion, it shows that investors are still selling almost as much as they are buying.
As for bitcoin’s price, it remains below the coveted $20,000 level. Now trending at $19,800 at the time of this writing, the digital asset is more than 71% down from its all-time high.
Featured image from US News Money, charts from TradingView.com
Follow Best Owie on Twitter for market insights, updates, and the occasional funny tweet…
On-chain data shows while the price of Bitcoin has continued to struggle recently, miners have shown diamond hands.
Bitcoin Miner Reserve Holds Still Amid The Recent Price Consolidation
As pointed out by an analyst in a CrypoQuant post, BTC miners have been accumulating for some time now, and the dwindling price hasn’t scared them.
The “Bitcoin miner reserve” is an indicator that measures the total amount of coins present in wallets of all miners.
When the value of this indicator observes a decrease, it means the supply held by miners is going down. Such a trend may be a sign that miners are dumping right now as they usually withdraw coins from their reserve for selling them on an exchange. And therefore, this can be bearish for the price of the coin.
On the other hand, an uptrend in the indicator, when prolonged, can prove to be bullish for the value of Bitcoin as it may show miners are accumulating at the moment.
Related Reading | Quant Explains Similarities Between Current And Summer 2020 Bitcoin Markets
Now, here is a chart that shows the trend in the Bitcoin miner reserve over the past couple of years:
Looks like the value of the metric has been trending sideways in recent months | Source: CryptoQuant
As you can see in the above graph, the Bitcoin miner reserve was at a very high value before the start of the 2021 bull run, but as soon as it kicked off a lot of miners harvested profits.
Following the crash in May of the same year, miners held on for a while, but it wasn’t too long until they the metric saw a plunge as they dumped.
Related Reading | Bitcoin Perfectly Follows Market Cycle Comparison, What Comes Next For Crypto?
Active miners have running costs like electricity so in times of low profitability, they have to sell their coins to pay off these bills.
These holders started accumulating again in July as a new rally kicked off. This time, however, they didn’t sell off when the ATH was hit and a crash occurred.
Though, miners have also not been adding further to their Bitcoin reserves in recent months either. But nonetheless, they have held strong through the seemingly endless sideways movement the price of the crypto has shown lately.
BTC Price
At the time of writing, Bitcoin’s price floats around $38.4k, down 1% in the past week. Over the last month, the crypto has lost 17% in value.
The below chart shows the trend in the price of the coin over the last five days.

The value of the crypto seems to have slid down over the last few days | Source: BTCUSD on TradingView
Featured image from Unsplash.com, charts from TradingView.com, CryptoQuant.com
- Cardano price rebounds on Saturday but is not out of the woods yet.
- Oversold RSI cautions ADA bears, as price wavers in a bearish channel.
- $1.52 is a tough resistance while $0.93 offers strong support to ADA price.
ADA price is attempting a bounce from weekly lows so far this Saturday, snapping a two-day downtrend. The broad upswing seen across the crypto market is coming to the rescue of ADA optimists.
Cardano price is finding support from CryptoCompare’s recent Asset Report, which showed that the number of active addresses on the Cardano Network quadrupled from October to November, as on-chain activity picked up and transaction fees on the network dropped from $0.45 to $0.38 on average.
Despite the encouraging news, a convincing recovery appears elusive, as the technical setup continues to remain in favor of the bearish traders.
Cardano price could likely rebound amid oversold conditions
As observed on the daily chart, ADA price is trading at the midpoint of a one-month-long falling channel, which aligns around $1.20.
The 14-day RSI is seeing a fresh uptick while still within the oversold territory, backing that a rebound in ADA price.
The recovery momentum, however, could gain traction if ADA bulls recapture the $1.40 resistance on a sustained basis.
Buyers will then challenge the powerful upside barrier at $1.52, which is the confluence of the falling trendline resistance and the bearish 21-Daily Moving Average (DMA).
A daily closing above the latter will confirm a falling channel breakout, opening doors towards $1.85, where the 50 and 200-DMA hang around.
ADA/USD: Daily chart
However, should the bulls give in to the death cross-driven bearish momentum in play, the December 4 lows of $1.13 could cap the immediate downside.
Further south, sellers will look to test $1.00, July lows, below which the falling trendline support at $0.93 will be the last line of defense for ADA bulls.
All in all, the path of least resistance appears to the downside for ADA price, with every bounce seen as a good selling opportunity for the traders.