
Ethereum is trying to hold above $2,300 as the market navigates another stretch of volatility and uncertainty. The price action remains hesitant, caught between buyers looking for a reason to commit and sellers who have defined this cycle’s derivatives landscape more aggressively than almost any previous period. But according to top analyst Darkfost, something in that landscape just changed — and the shift is significant enough to deserve attention.
Throughout this entire cycle, Ethereum’s derivatives markets have been unusually hostile to bulls. Net taker volume — the measure of how aggressively buyers versus sellers are hitting the market — remained almost consistently negative.
The clearest example came in December 2024, when ETH was pushing toward a new all-time high above $4,000. Rather than buyers chasing the breakout, net taker volume collapsed to -$511 million. It got worse from there. When Ethereum printed its cycle high just below $5,000, the sell-side dominance reached -$568 million. Sellers were not just present at the top — they were overwhelming it.
That pattern defined the entire rally and made every move higher feel contested, expensive, and ultimately unsustainable.
Today, Darkfost notes, the dynamic looks very different. For the first time in this cycle, the picture on derivatives markets appears to be shifting — and what is replacing that persistent sell pressure is worth understanding.
The Sellers Who Defined This Cycle Just Lost the Upper Hand
Since March, the dynamic that defined Ethereum’s entire derivatives market has quietly reversed. Buy-side volumes have taken control, with net taker volume reaching +$102 million today. After months of sellers dominating at every key price level — including the all-time high — buyers are now the ones hitting the market aggressively.

The historical context Darkfost provides is what gives this shift its real weight. The last time Ethereum’s derivatives market showed buying pressure of this magnitude was in 2022 — when ETH was trading around $1,000, near the depths of the previous bear market. That was the last time buyers stepped in with this kind of conviction. What followed from that period is not lost on anyone who has watched Ethereum across multiple cycles.
The implications, if the trend holds, are material. This cycle was defined by a specific and unusual pattern: sellers dominated not just during weakness, but at every attempt at strength. Every rally was met with aggressive supply. That pressure is what made each Ethereum recovery feel fragile and short-lived.
If buyers are now consistently absorbing that supply rather than stepping aside, the structural backdrop for Ethereum is changing. It is early — one data point does not confirm a new regime. But the shift from -$568 million at the peak to +$102 million today is not a small move. It is the kind of reversal that, if sustained, tends to precede something more meaningful than a temporary bounce.
Ethereum Tests Resistance as Recovery Structure Builds
Ethereum is attempting to stabilize above the $2,300 level after recovering from the sharp February capitulation that briefly pushed price below $1,800. The rebound has been constructive in the short term, with price forming a sequence of higher lows since early March. However, the broader structure remains unresolved.

The key technical feature in the current chart is the interaction with the 200-day moving average, which is trending downward and now sits just above price. This level has acted as dynamic resistance, rejecting multiple recovery attempts. The recent move into the $2,350–$2,400 zone was again met with selling pressure, reinforcing that sellers are still defending higher levels.
Volume dynamics add nuance to the picture. The capitulation event in February was accompanied by a clear spike in volume, signaling forced selling and potential exhaustion. Since then, volume has normalized during the recovery, suggesting a more controlled, organic bid rather than aggressive momentum chasing.
Short-term momentum is improving, but Ethereum has yet to confirm a structural shift. A clean break and hold above the 200-day moving average would be required to transition from recovery to trend reversal. Until that happens, the current move appears to be a developing range with resistance overhead and cautious buyers stepping in on dips.
Featured image from ChatGPT, chart from TradingView.com
Editorial Process for bitcoinist is centered on delivering thoroughly researched, accurate, and unbiased content. We uphold strict sourcing standards, and each page undergoes diligent review by our team of top technology experts and seasoned editors. This process ensures the integrity, relevance, and value of our content for our readers.
Can Ripple (XRP) and Cardano (ADA) Regain Strength? Analysts Highlight a New Cheap Crypto openPR.com
Source link ]]>
Can Ripple (XRP) and Cardano (ADA) Regain Momentum? Analysts Highlight a New Cheap Crypto openPR.com
Source link ]]>
Based Eggman Crypto vs Top 5 Memecoins in 2026, Can Dogecoin Regain $0.25 As SHIB Coin Declines BlockchainReporter
Source link ]]>
Bitcoin price corrected gains and tested the $66,500 support. BTC is now struggling and might decline further below the $65,000 zone.
- Bitcoin is struggling to recover losses and moving lower below $67,500.
- The price is trading below $67,500 and the 100 hourly simple moving average.
- There is a declining channel forming with resistance at $68,850 on the hourly chart of the BTC/USD pair (data feed from Kraken).
- The pair might dip again if it trades below the $66,500 and $66,000 levels.
Bitcoin Price Dips Further
Bitcoin price failed to remain stable above the $68,500 zone. BTC started a fresh decline and traded below the $67,800 support zone. There was a push below $67,200.
The price dipped below the 61.8% Fib retracement level of the upward move from the $65,072 swing low to the $70,935 high. However, the bulls remained active near the $66,500 zone. Besides, there is a declining channel forming with resistance at $68,850 on the hourly chart of the BTC/USD pair.
Bitcoin is now trading below $67,500 and the 100 hourly simple moving average. If the price remains stable above $66,500, it could attempt a fresh increase. Immediate resistance is near the $68,000 level.
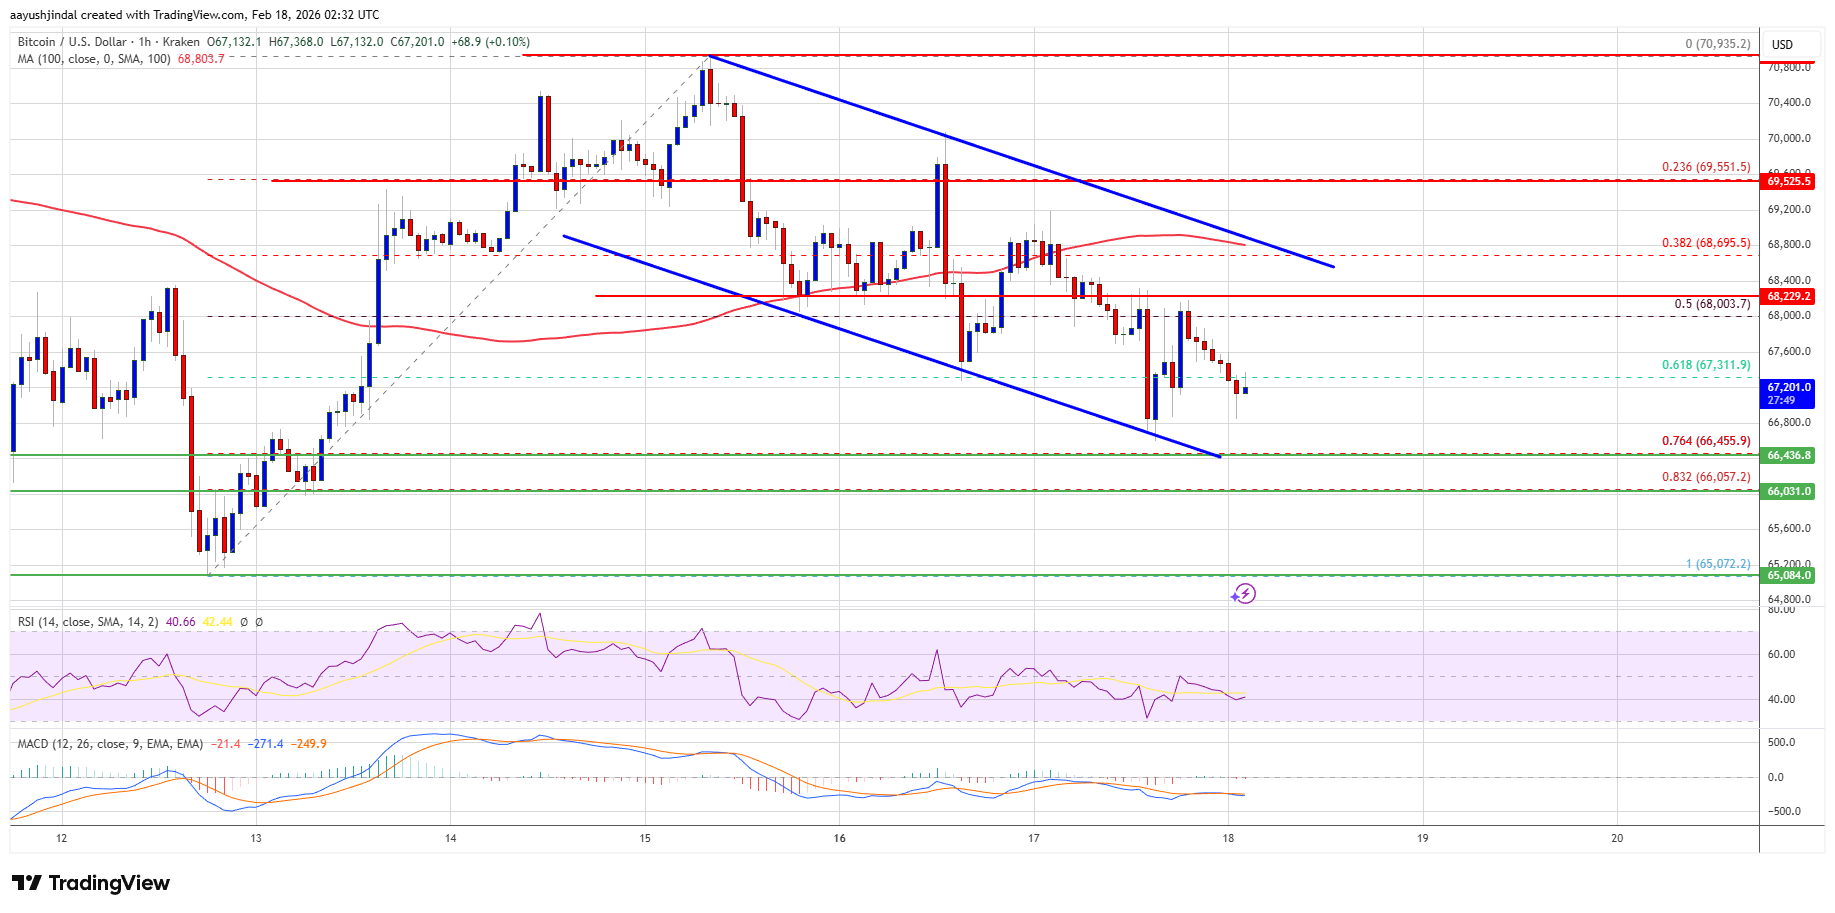
The first key resistance is near the $68,850 level. A close above the $68,850 resistance might send the price further higher. In the stated case, the price could rise and test the $69,200 resistance. Any more gains might send the price toward the $70,000 level. The next barrier for the bulls could be $7`,200 and $72,000.
Another Decline In BTC?
If Bitcoin fails to rise above the $68,850 resistance zone, it could start another decline. Immediate support is near the $66,500 level or the 76.4% Fib retracement level of the upward move from the $65,072 swing low to the $70,935 high. The first major support is near the $66,000 level.
The next support is now near the $65,000 zone. Any more losses might send the price toward the $64,200 support in the near term. The main support now sits at $63,500, below which BTC might struggle to recover in the near term.
Technical indicators:
Hourly MACD – The MACD is now gaining pace in the bullish zone.
Hourly RSI (Relative Strength Index) – The RSI for BTC/USD is now below the 50 level.
Major Support Levels – $66,500, followed by $66,000.
Major Resistance Levels – $68,000 and $68,850.
How Has X Money Helped DOGE Regain Momentum in February? BeInCrypto
Source link ]]>
Can Ripple (XRP) and Cardano (ADA) Regain Momentum? Analysts Highlight a New Cheap Crypto Blockonomi
Source link ]]>
Dogecoin corrected some gains and traded below $0.1220 against the US Dollar. DOGE is now holding the $0.120 support but might decline further.
- DOGE price started a fresh downside correction from $0.1275.
- The price is trading below the $0.1225 level and the 100-hourly simple moving average.
- There was a break below a bullish trend line with support at $0.1245 on the hourly chart of the DOGE/USD pair (data source from Kraken).
- The price could aim for a fresh increase if it remains stable above $0.1200.
Dogecoin Price Trims Gains
Dogecoin price started a downside correction after it failed to clear $0.1275, like Bitcoin and Ethereum. DOGE declined below the $0.1250 and $0.1245 levels.
There was a move below the 50% Fib retracement level of the upward move from the $0.1175 swing low to the $0.1275 high. Besides, there was a break below a bullish trend line with support at $0.1245 on the hourly chart of the DOGE/USD pair.
Dogecoin price is now trading below the $0.1225 level and the 100-hourly simple moving average. Immediate resistance on the upside is near the $0.1235 level. The first major resistance for the bulls could be near the $0.1250 level.
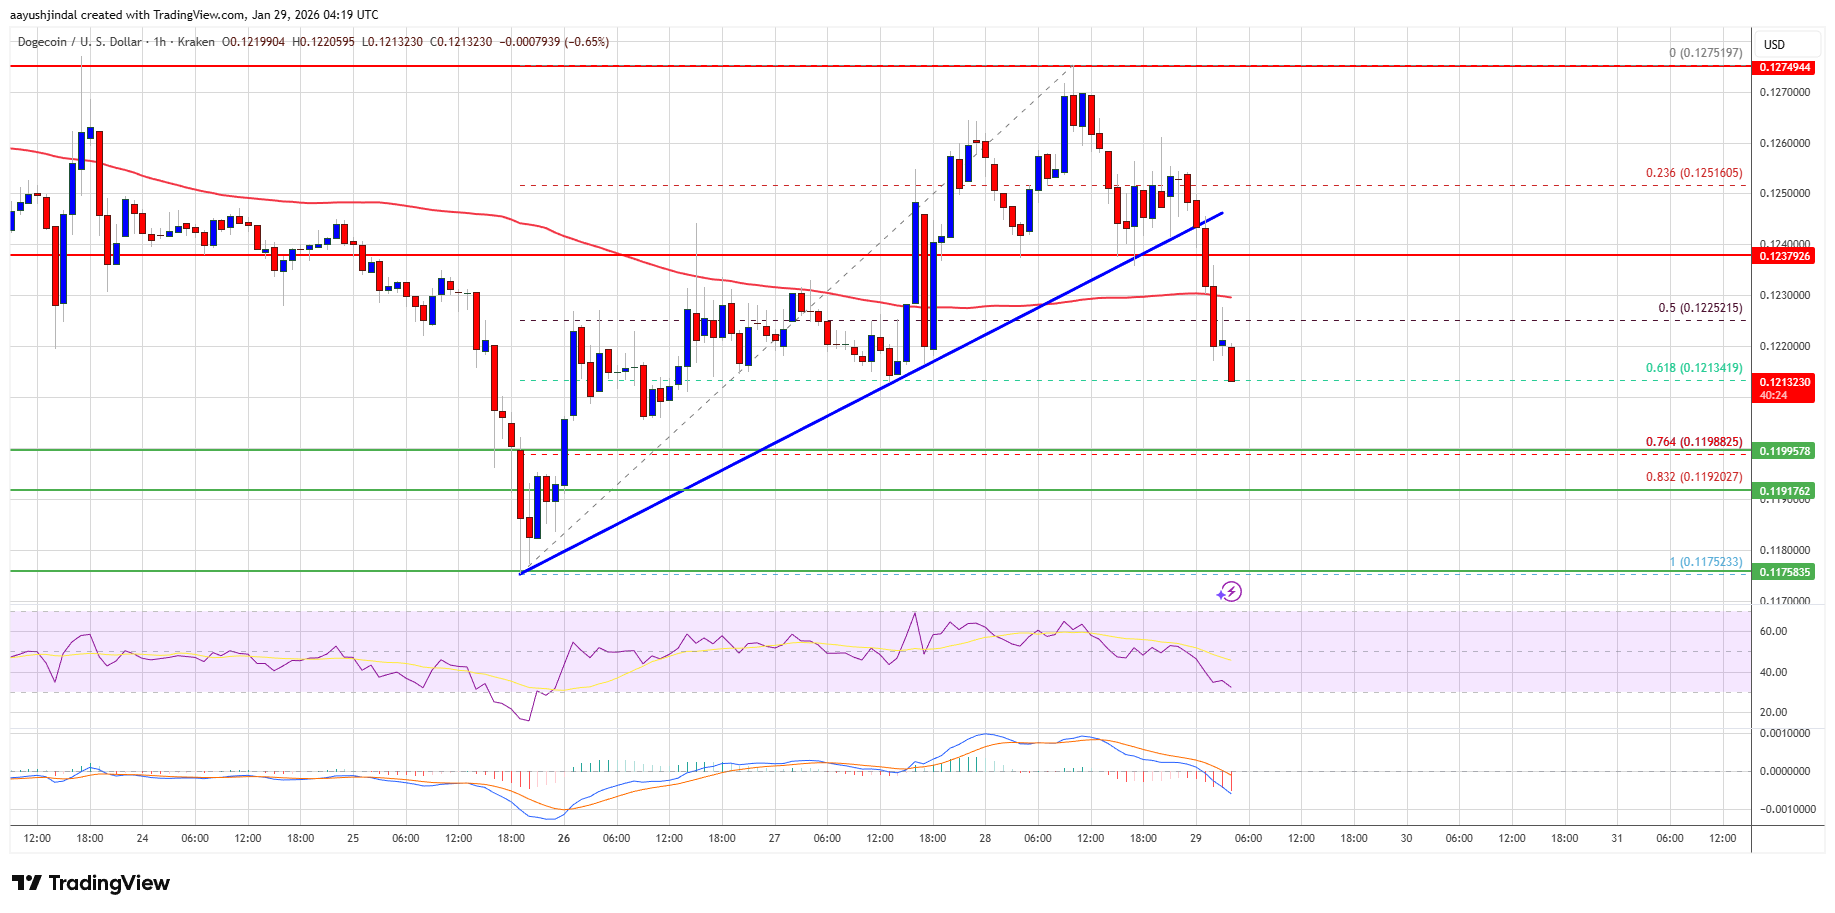
The next major resistance is near the $0.1275 level. A close above the $0.1275 resistance might send the price toward $0.1350. Any more gains might send the price toward $0.1380. The next major stop for the bulls might be $0.1420.
More Losses In DOGE?
If DOGE’s price fails to climb above the $0.1250 level, it could continue to move down. Initial support on the downside is near the $0.120 level and the 76.4% Fib retracement level of the upward move from the $0.1175 swing low to the $0.1275 high.
The next major support is near the $0.1192 level. The main support sits at $0.1150. If there is a downside break below the $0.1150 support, the price could decline further. In the stated case, the price might slide toward the $0.1080 level or even $0.1050 in the near term.
Technical Indicators
Hourly MACD – The MACD for DOGE/USD is now gaining momentum in the bearish zone.
Hourly RSI (Relative Strength Index) – The RSI for DOGE/USD is now below the 50 level.
Major Support Levels – $0.1200 and $0.1150.
Major Resistance Levels – $0.1250 and $0.1275.
]]>Dogecoin: Breakout attempts fail, short sellers regain control – What’s next? AMBCrypto
Source link ]]>
Shiba Inu price prediction: SHIB set to regain lost ground as Bitcoin whales rotate into memecoins Invezz
Source link ]]>