Crypto analyst Bobby has revealed that the XRP price is about to close a 3-minute candle above a major region. He indicated that this was very bullish for the altcoin, providing insights into how high it could rally.
XRP Price Set To Close Fourth 3M Candle Above
In an X post, Bobby revealed that the XRP price is about to close its fourth 3-minute candle above the highest 3-minute candlestick close of its prior bull cycle. He added that the altcoin is also on track to close a 3-minute candle body above the previous 3-minute candle wick high amid a highly fearful market and even without reaching a 1.618 extension.
Related Reading
Based on this, he urged market participants to “think bigger,” possibly alluding to the projections for the XRP price in this market cycle. His accompanying chart showed that XRP could rally to as high as $13, representing a gain of over 400% from its current price level. Meanwhile, Bobby highlighted the candle closes above the April 2021 high as another reason he is bullish on XRP.

His analysis comes amid a market downtrend, which has seen the XRP price drop below crucial support levels. Bobby suggested that the current downtrend was nothing to worry about. He stated that a golden pocket retest for XRP, from its latest low to its swing high, would be between $2.50 and $2.55. However, he declared that a drop to this range wouldn’t change a “single thing” about where the altcoin is heading.
Instead, the crypto analyst believes that this would help weed out paper hands, who don’t deserve to benefit from what is to come for the diamond hand holders. He added that strategy and patience are needed amid the wait for the XRP price to reach new highs.
XRP Could Reach As High As $33
Crypto analyst Egrag Crypto has predicted that the XRP price could reach as high as $33 in this market cycle. He explained that, within the 2-week timeframe of the last leg in previous cycles, XRP always touched the 21 EMA before it blasted off. In 2017, the altcoin touched the EMA and then surged 1,250% while it rallied 560% in 2021.
Related Reading
Egrag Crypto noted that if history repeats, the XRP price could rise to as high as $33 or $17, based on the gains from the previous cycle. Meanwhile, XRP could also record an average rally of 905%, which would put its price at $27. The analyst added that he doesn’t see how XRP won’t reach these targets.
At the time of writing, the XRP price is trading at around $2.85, up over 2% in the last 24 hours, according to data from CoinMarketCap.
Featured image from Getty Images, chart from Tradingview.com
Dogecoin Price Turns Bullish With 1-Day RSI In Oversold Region, Why DOGE Can Reach $0.9 NewsBTC
Source link ]]>
The price of Bitcoin saw no overall gain over the past week as the premier cryptocurrency continued to undergo a market correction. Despite multiple upward movements, Bitcoin struggled to break past the $100,000 resistance with its price performance in December continuing to deviate from earlier bullish predictions. Amidst this development, market analysts continue to roll out projections on Bitcoin’s potential price move.
Is Bitcoin Price Top In?
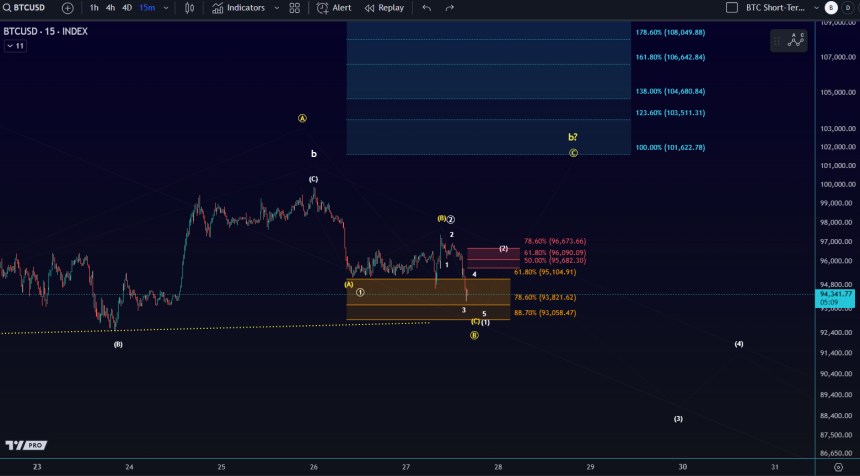
In an X post on December 27, crypto technical analysis handle More Crypto Online shared an interesting prediction on Bitcoin in its current corrective state. Using the Elliott Wave Theory, these market analysts have drafted two opposing forecasts on the BTC market named the yellow and white scenarios.
For context, the Elliott Wave Theory is a form of technical analysis that hinges on the belief that the financial market moves in repetitive fractal patterns called waves that can be used to predict future price movements. With Bitcoin presently in a corrective structure i.e. moving against the bullish market trend, the white scenario states Bitcoin has completed a B-wave in which it recorded a local price top on December 26th.
Currently, the premier cryptocurrency is moving in a C-wave headed to a potential price target in the mid to low $80,000 price zone. The original support zone to counter this bearish movement is around $95,068 – $96,670. However, as Bitcoin establishes new lows, these resistance regions will be recalibrated.
On the other hand, the yellow scenario shows that the B-wave, which is concluded in the white scenario, is still developing as part of a larger corrective structure with no price top yet recorded. However, for this yellow scenario to become valid, BTC needs to break above $96,673 signaling that an upward movement is still ongoing. Therefore, as long as this price zone remains unbroken, the white scenario remains the dominant outlook for the Bitcoin market.
BTC Price Overview
At the time of writing, Bitcoin is trading at $94,790, marking a 1.04% decline over the past 24 hours. Meanwhile, daily trading volume has risen by 10.35%, reaching $52.24 billion. After a week of near-balanced gains and losses, the leading cryptocurrency has dropped 2.00%, with its monthly performance also slipping into negative territory.
For market bulls, moving above $96,600 remains the immediate task based on the Elliott Wave theory, however, a major opposition awaits at $100,000 which has proved an effective resistance in recent times. Generally, optimism continues to remain high in the Bitcoin market, especially with the inauguration of US President-elect Donald Trump fast approaching which is expected to herald in a new era of pro-crypto policies.
]]>Bitcoin, Ethereum, Dogecoin Correct: ‘A Bounce From This Region Would Be Ideal,’ Says Trader MSN
Source link ]]>
Bitcoin, Ethereum, Dogecoin Correct: ‘A Bounce From This Region Would Be Ideal,’ Says Trader Benzinga
Source link ]]>
Shiba Inu All the Way to $0.000081 as it Finally Breaches Crucial Region The Crypto Basic
Source link ]]>
Cardano Rocks the Crypto World: The Most Popular in This Region … The Coin Republic
Source link ]]>
XRP and Cardano Support Region Under Scrutiny, Break Could Result in Price Drop Analytics Insight
Source link ]]>
The Ethereum price has been propelling itself considerably ever since Bitcoin crossed the $20,000 price mark. Over the last 24 hours, ETH has slightly moved down on its chart, depicting consolidated price action. Last week helped the Ethereum price move up by 6%.
The coin finally broke past its consolidation at the $1,500 price level and has been moving north ever since. The technical outlook of the coin has pointed towards continued bullishness on the chart. Accumulation has increased substantially ever since Ethereum breached the $1,500 price level.
The chance of a price reversal cannot be ruled out just yet, as ETH was overbought and overvalued. Currently, Ethereum has secured $1,600 as the support level. The next price correction could help traders with buying opportunities.
A price correction might not occur over the immediate trading sessions as demand for the coin remains quite high on the chart. Ethereum’s price might continue on the upside before the coin retraces. The market capitalization of Ethereum increased, which also reflected that the buying sentiment remained high.
Ethereum Price Analysis: One-Day Chart
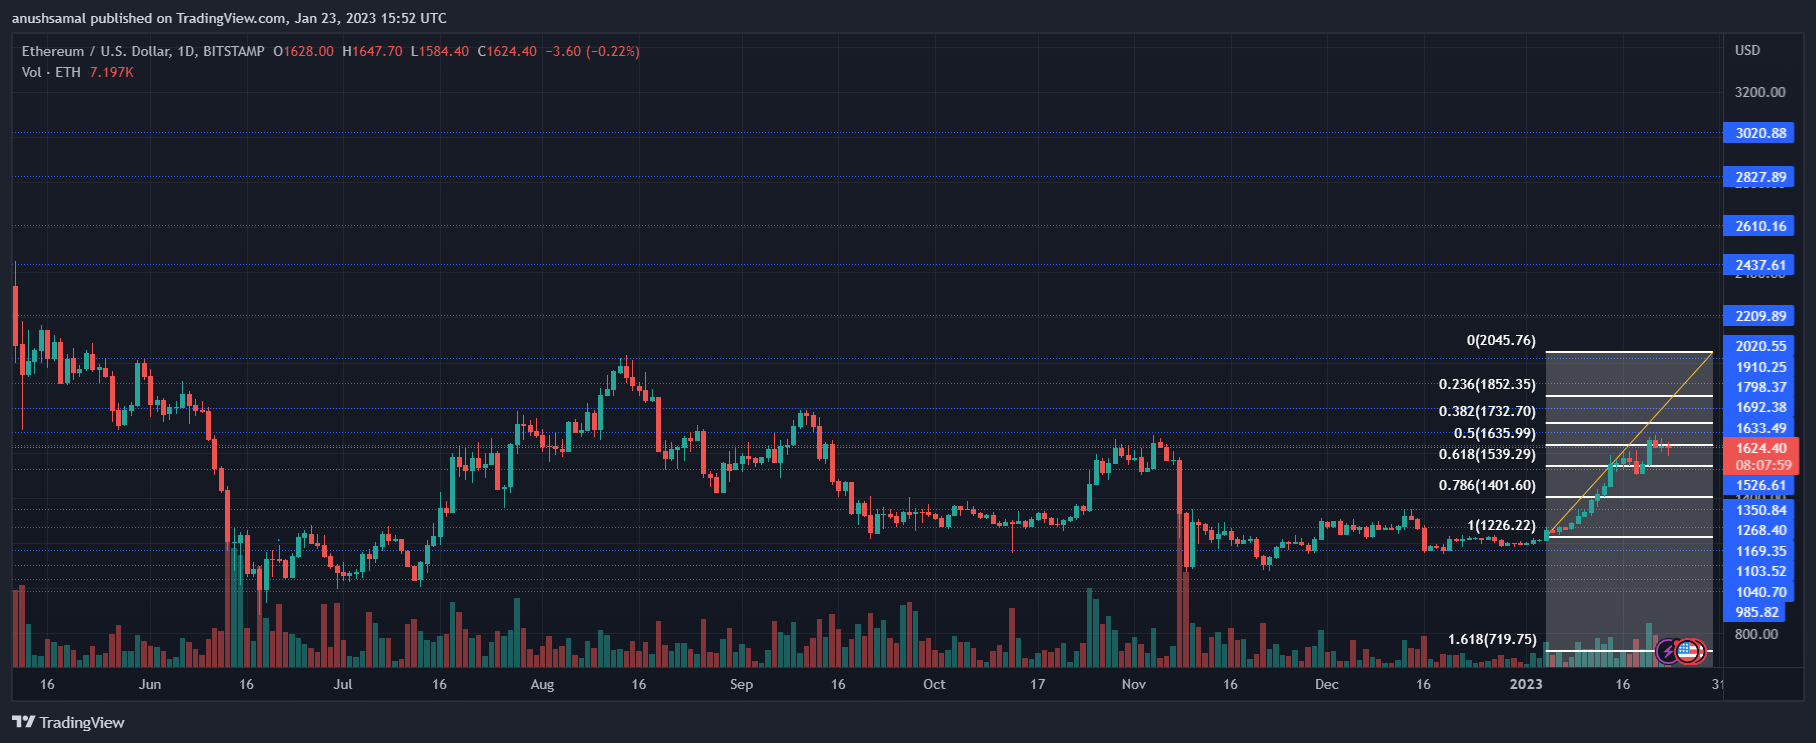
ETH was exchanging hands at $1,620 at the time of writing. Immediate resistance for the coin stood at $1,690; it even corresponds to the 50% Fibonacci retracement level. A move above $1,690 will help Ethereum touch the $1,700 price mark.
The $1,700 price mark is crucial, as touching or breaching this mark could mean continued bullish momentum for the crypto.
ETH could even soar to $2,000 if the $1,700 price mark is crossed. This region will act as a profit-take region for traders. On the flip side, if the bullish momentum slows down, the first fall would be at $1,600 and then at $1,520. The amount of Ethereum traded in the last session was red, signifying a downtick in buying.
Technical Analysis
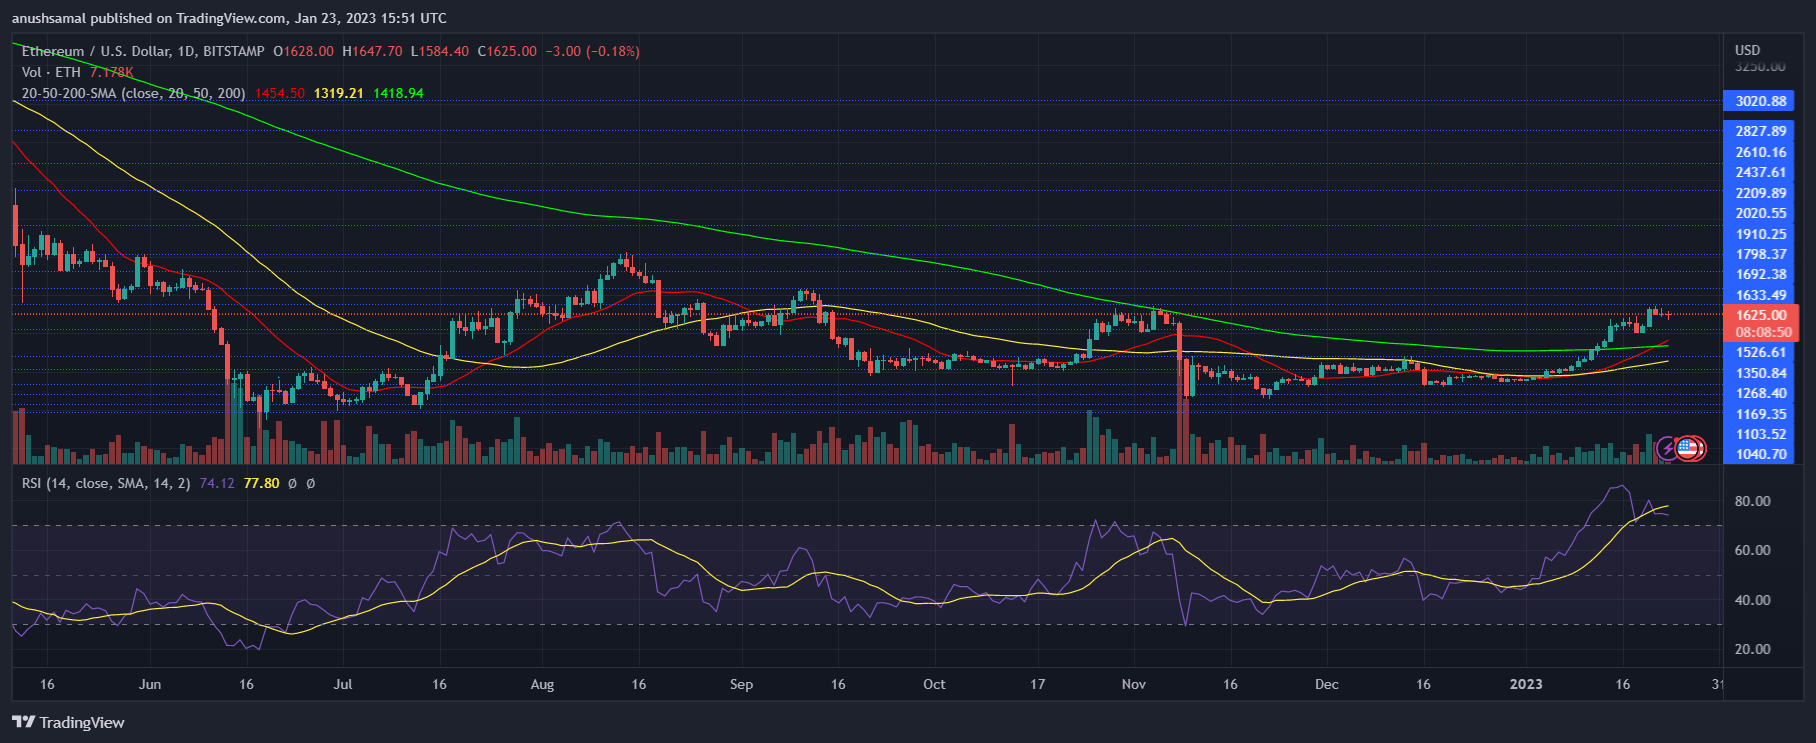
The altcoin was still in the overbought zone, which also means that Ethereum broke a multi-month record in terms of accumulation. The Relative Strength Index was parked a little below the 80-mark, which still signified heavy buying strength and bullishness.
If demand stays at this level, bullish momentum will not fade out anytime soon. ETH was also trading above the 20-Simple Moving Average line, indicating that buyers were driving the price momentum.
On the contrary, the 200-SMA line crossed the 20-SMA line, which implies that the coin might be headed for southbound price movement.
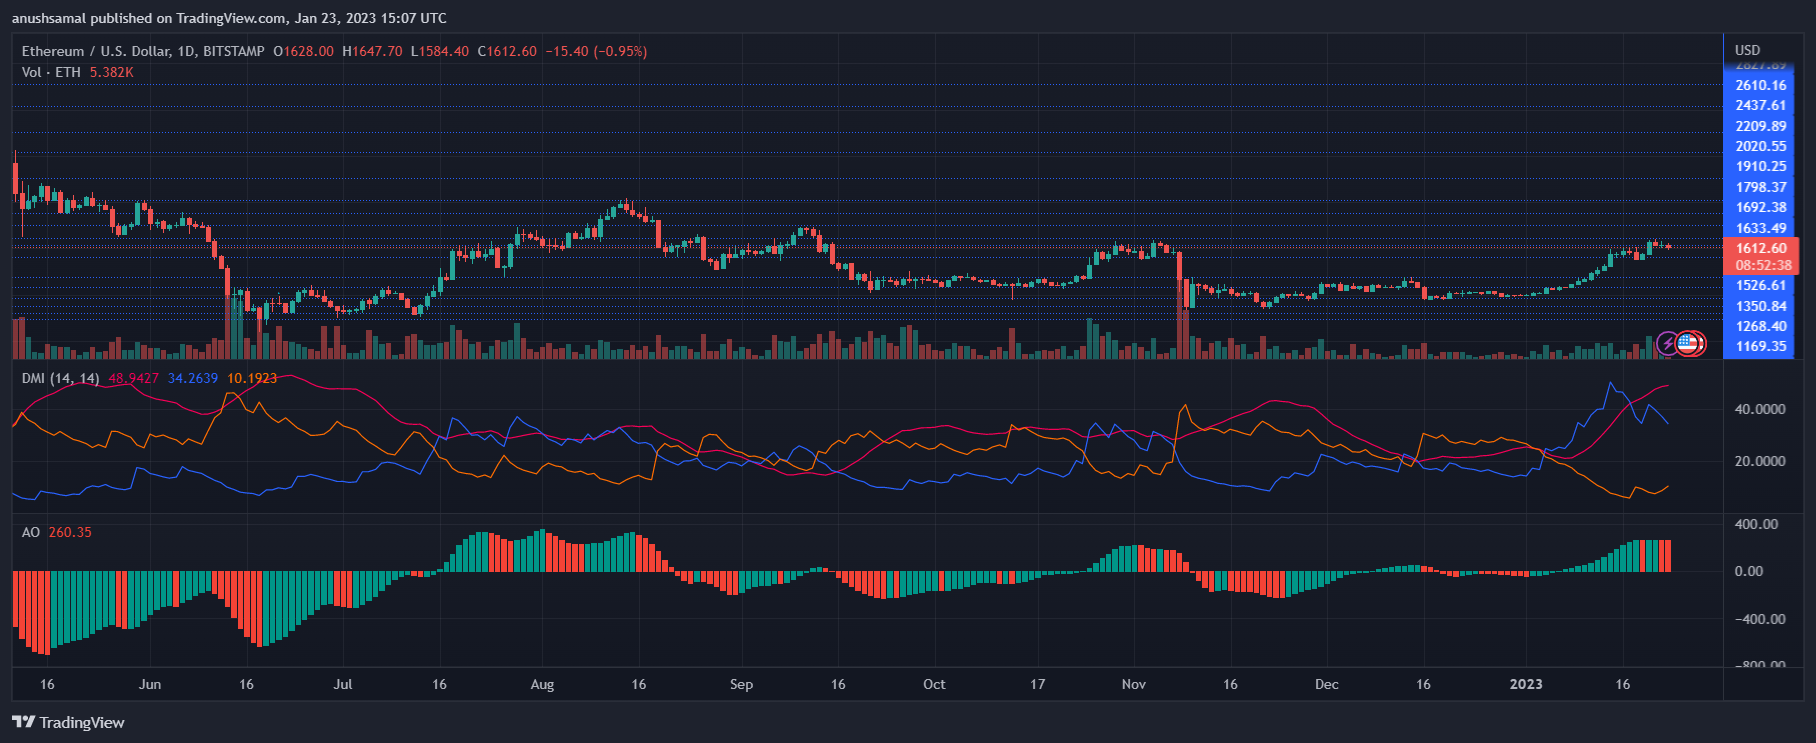
As accumulation has remained at a record high for the coin, chances of a price pullback still remain for the altcoin. The Awesome Oscillator, which signifies price direction, displayed red histograms, which meant that these were sell signals for the altcoin.
Sell signals can be accompanied by a fall in price. Ethereum may briefly fall in price before resuming its upward trend.
The Directional Movement Index was still positive, as the +DI line (blue) was above the -DI line (orange). The Average Directional Index (red) shot past 40, which suggested that price direction would gain further strength, which will push ETH to break past its nearest price ceiling of $1,700.
Featured Image From UnSplash, Charts From TradingView.com
- Cardano’s most significant agreement has been made with the Ethiopian government.
Africa has become increasingly important to the Cardano blockchain and its community, and the benefits are showing. This cryptocurrency is the most popular in the area, claims a media report.
Cardano is a more environmentally friendly cryptocurrency because of its proof-of-stake consensus method, which uses substantially less energy than other cryptocurrencies’ proof-of-work algorithms. The governance model of the coin, which encourages community involvement in decision-making is another factor in Cardano’s rise to prominence as the most popular cryptocurrency.
Owing to the coin’s distinctive architecture, transactions can be processed more quickly and effectively, and it is also possible to link to other blockchain networks. Due to this, it is a desirable choice for both private users and organizations wishing to collaborate and conduct daily business using cryptocurrency.
According to the report’s findings, Cardano is the most popular cryptocurrency in Switzerland, Puerto Rico, Kenya, Uganda, Ghana, and Tunisia. Compared to Solana, Ethereum, Avalanche, and other coins, Cardano is more prevalent in these areas.
The two cryptocurrencies that are most cherished over the globe are Ethereum and Solana. According to the report, the outcomes were influenced by their smart contract and decentralized finance (DeFi) apps. Users utilize these platforms as an alternative to conventional investments, according to statistics from the Pew Research Center.
Cardano took longer to implement its smart contract capabilities through three Hard Fork Combinator (HFC) events during its “Alonzo” era, despite having a significant presence in Africa. As a result, the majority of consumers looking for DeFi applications chose Solana and Ethereum.
Charles Hoskinson, CEO of IOG, a blockchain developer, and the founder of Cardano believes that this region has the potential to see an economic boom.
According to Hoskinson, Africa has more than $5 trillion in “illiquid” assets on hand. The systems that assist the locals in extracting their wealth will profit. Hoskinson stated: “In the coming ten years, Africa’s economic ecosystem will hold the most potential.”
This blockchain has so far made its most significant agreement with the Ethiopian government. The African country began transforming its educational system using Cardano. When the agreement was announced in 2021, millions of people were expected to use the blockchain.
Overall, the study’s results indicate that Cardano is well-established in the area and is probably going to stay a popular option going forward.

Nancy J. Allen is a crypto enthusiast and believes that cryptocurrencies inspire people to be their own banks and step aside from traditional monetary exchange systems. She is also intrigued by blockchain technology and its functioning.