XRP’s performance in the ongoing 2025 bull run has become one of the most discussed topics in crypto, as the token continues to challenge the dominance of Bitcoin, Ethereum, and BNB.
In a recent video shared on the social media platform X, crypto commentator Zach Rector described what he called the inconvenient truth of this market cycle: XRP is currently outperforming most of the top 50 cryptocurrencies in percentage growth since the last US presidential election and from the depths of the previous bear market.
Ethereum, BNB, And Bitcoin’s Performance
Rector began his comparison by pointing to Ethereum’s recovery trajectory. According to Ethereum’s price chart, investors who bought Ethereum before the most recent US presidential election have seen returns of about 89%, while long-term holders who entered during the 2022 bear market lows and are yet to sell are currently sitting on 400% gains.
Related Reading
BNB, he said, has delivered slightly better results, with 109% returns for pre-election buyers and 527% for those who accumulated during the 2022 bear market lows.
Turning to Bitcoin, Rector noted that even after breaking to multiple new all-time highs this cycle, its returns are modest compared to XRP. He pointed out that a Bitcoin purchase before the election would have yielded an 82% return, while those who entered around the bear market bottom and are yet to sell would have gained around 678% on their Bitcoin holdings.
XRP Outperforming The Market
It’s a fact that XRP’s price action this cycle is much better than its performance in the 2021 crypto market bull run, where its growth was hampered by the SEC-Ripple lawsuit. Therefore, Zach Rector’s main point focuses on XRP’s strength within the current market cycle.
Related Reading
He stated that if an investor had purchased XRP at $0.50 before the election, their position would now be up 500%. On the other hand, those who bought at the bear market bottom and are still holding would have seen an extraordinary 900% gain. As such, these numbers make XRP one of the most profitable assets among the major cryptocurrencies, outperforming Bitcoin, Ethereum, and BNB.
In his words, “The inconvenient truth about the 2025 crypto bull run, and this is why people are so upset, is that XRP is still outperforming nearly all of the top 50 cryptos.” The statement quickly gained traction within the XRP community, as shown by the comments on his video posted on X.
XRP price action in the past few days, however, has been majorly corrective. The price has been drifting lower toward a critical support level around $2.80, which is now an important level for bulls to defend. A breakdown below $2.8 could expose the next support at $2.72, while maintaining it could set the stage for another upward move.
Even with this cooling phase, many XRP enthusiasts and analysts are optimistic. Many expect the token to break above $4 in the coming months, with some predicting that it could eventually enter double-digit territory once Spot XRP ETFs are launched in the US.
Featured image from Adobe Stock, chart from Tradingview.com
A crypto analyst who accurately predicted the Bitcoin (BTC) price surge to $120,000 months ago has returned with a bold new forecast that could redefine investors’ expectations for the rest of the cycle. Using a detailed Elliott Wave structure and historical halving patterns, the expert outlines what could be Bitcoin’s final parabolic move, laying out a clear roadmap toward a new ATH target.
Bitcoin Parabolic Phase Still Ahead
Following Bitcoin’s explosive rise above $123,000 in a single day, crypto analyst XForceGlobal reaffirmed his earlier predictions and intensified his bullish outlook. He now asserts that Bitcoin is in the early stages of a much larger breakout, with the final and most parabolic phase of its rally yet to unfold.
Related Reading
The analyst Bitcoin Price Trajectory To $155,000: Why No Major Dips Are Expected From Here a detailed chart showing that Bitcoin is now trading over $40,000 above its Wave 2 bottom of the macro 5th. This indicates that the market could be transitioning into Wave 3 of a larger Elliott Wave impulse pattern. The chart also visually segments previous bull market runs into distinct macro phases, each unfolding after a halving cycle. Every phase began with a consolidation period, followed by exponential growth and eventual correction.
Bitcoin’s price history is further marked by the halving events in 2012, 2016, 2020, and 2024—all of which have consistently preceded major bullish rallies. The latest halving, which occurred in April 2024, is now expected to lead to an intermediate-term rally that may extend BTC’s price beyond $270,000 before entering another corrective phase.
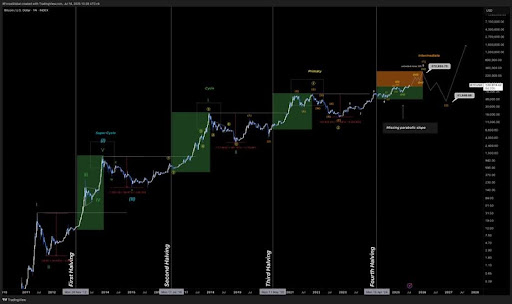
While XForceGlobal maintains a bullish long-term outlook for Bitcoin, he urges investors to be cautious and aware that the final wave may generate market euphoria before a significant decline sets in. His projected roadmap shows a steady bullish climb toward $272,832, followed by a potential retracement to around $41,646, marking a steep 85% crash from the top.
During his analysis, the market expert highlighted the difference between smart and dumb money during this bullish phase of the cycle. He claimed that smart investors have already mapped out their exit strategies, understanding that success comes from early planning rather than spontaneous decisions. He also added that with the market yet to reach a climax, there’s still time to prepare an exit before red flags emerge.
Analyst Predicts $155,000 As Bitcoin’s Next Stop
In a follow-up X post, XForceGlobal forecasted Bitcoin’s next short-term price target at $155,000. This prediction comes as BTC recently rallied past $123,000 before undergoing a pullback, now trading slightly above $116,800. According to the analyst, Bitcoin remains firmly in an extended Wave 3, which traditionally represents the most impulsive and powerful phase of the Elliott Wave sequence.
Related Reading
XForceGlobal’s chart reveals that Bitcoin recently broke out from a complex WXYXZ correction structure, which served as the launchpad for the present rally. His projection suggests that BTC is now forming a five-wave structure targeting the $140,000-$155,000 range, with macro-level corrections expected along the way.
Featured image from Pixabay, chart from Tradingview.com
This Analyst Predicted The Dogecoin Price Crash – Here’s The Rest Of The Forecast TradingView
Source link ]]>
Cardano Price Prediction: ADA Rated Least Likely To Hit New Highs Over DOGE, TRX, and Rest Of Crypto Top 10 Analytics Insight
Source link ]]>
Best Altcoin to Buy As PEPE and Shiba Inu Have Reached Their Max Capacity – One Coin Stand Above The Rest Analytics Insight
Source link ]]>
Dogecoin Price Struggles With $0.15: Machine Learning Algorithm Reveals What Is In Store For Rest Of April Mitrade
Source link ]]>
Dogecoin Price Struggles With $0.15: Machine Learning Algorithm Reveals What Is In Store For Rest Of April | Bitcoinist.com
Source link ]]>
Reason to trust
![]()
Strict editorial policy that focuses on accuracy, relevance, and impartiality
Created by industry experts and meticulously reviewed
The highest standards in reporting and publishing
Strict editorial policy that focuses on accuracy, relevance, and impartiality
Morbi pretium leo et nisl aliquam mollis. Quisque arcu lorem, ultricies quis pellentesque nec, ullamcorper eu odio.
A Bitcoin price prediction made exactly one month ago by popular crypto analyst Doctor Profit on social media platform X has unfolded with interesting accuracy. On March 21, Doctor Profit outlined a detailed price trajectory for Bitcoin, predicting specific price movements, resistance and support zones, and the influence of the M2 money supply. Fast forward to April 21, Bitcoin’s price movements have closely mirrored the analyst’s forecast, lending credibility to the remaining parts of his prediction.
How Bitcoin Followed Doctor Profit’s March Forecast
Doctor Profit’s analysis is based on Bitcoin’s response to changes in the M2 money supply, which he identified as a misunderstood indicator. He argued that although the market experienced an increase in liquidity starting in February, Bitcoin’s significant bullish rally from September 2024 onwards had already factored in this liquidity expansion, contrary to what most investors had expected.
Related Reading
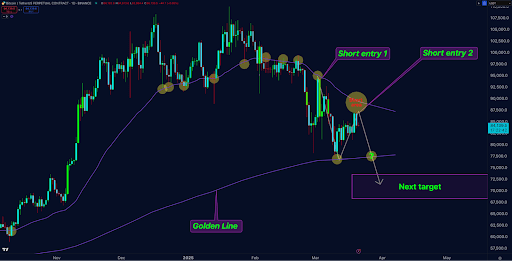
Notably, Doctor Profit had previously highlighted a key technical level, the weekly EMA 50, also known as the Golden Line, at approximately $76,000. He expected a bounce from this level, projecting a move to the $87,000 to $88,000 region before another correction.
Bitcoin followed this script almost exactly, crashing in the first few days of April before rebounding from around $76,000 on April 9. Now, Bitcoin has rallied back above $87,000, coinciding precisely with Doctor Profit’s prediction.
Next Phase: Bitcoin Heading For Support Zone At $70,000 To $74,000
Now that Bitcoin has bounced and is trading above $87,000 again, Doctor Profit’s immediate next target is a potential crash towards $74,000 to $70,000, which is slightly below the highlighted Golden Line. According to the analyst, the market’s behavior at this support zone will be decisive. It is at this zone that the Bitcoin price will reveal its next major directional bias.
Related Reading
Doctor Profit laid out two clear scenarios based on Bitcoin’s reaction within the $74,000 to $70,000 price range. If Bitcoin experiences only a temporary wick into this range and manages a strong daily or weekly close back above the Golden Line, this would signal a reversal, and it would be prudent to close short positions and begin accumulating long positions. However, if Bitcoin closes below this crucial area, it could trigger a deeper bearish move, leading its price to significantly lower levels, possibly revisiting the $50,000 region under a worst-case Black Swan scenario.
Notably, whichever bearish scenario plays out, it is expected to occur by April and likely into early May. Despite the current short-term bearish outlook, Doctor Profit maintained a bullish long-term view. He confidently predicted that the Bitcoin bull run would resume around May or June, eventually driving the price towards new all-time highs in the range of $120,000 to $140,000.
At the time of writing, Bitcoin is trading at $87,526, up by 3.28% in the past 24 hours. The bearish outlook towards $74,000 would only be invalidated if Bitcoin successfully closes a weekly candle above the $100,000 level.
Featured image from Adobe Stock, chart from Tradingview.com
Shiba Inu Price Prediction: Why SHIB Could Outperform DOGE Throughout The Rest Of 2025 Analytics Insight
Source link ]]>
Reason to trust
![]()
Strict editorial policy that focuses on accuracy, relevance, and impartiality
Created by industry experts and meticulously reviewed
The highest standards in reporting and publishing
Strict editorial policy that focuses on accuracy, relevance, and impartiality
Morbi pretium leo et nisl aliquam mollis. Quisque arcu lorem, ultricies quis pellentesque nec, ullamcorper eu odio.
A new XRP price forecast has emerged, offering insights into the cryptocurrency’s next bearish move. A crypto analyst who previously predicted XRP‘s crash below $2 has provided a more comprehensive outlook, outlining key support and resistance areas that will determine XRP’s next target.
According to TradingView crypto analyst, ‘MMBTrader,’ the XRP price is set to dump below the $2 threshold. As of writing, CoinMarketCap reports that XRP is trading at $2.2, reflecting a modest 3% increase in value in the last 24 hours.
XRP Price Projected To Crash To $1.5
Related Reading
The TradingView crypto expert has identified a Head and Shoulder pattern on the XRP daily chart, consisting of three peaks: left shoulder, head, and right shoulder. Typically, a classic Head and Shoulder pattern is considered one of the most common indicators of a potential price breakdown, with the price of a cryptocurrency expected to reverse from bullish to bearish.
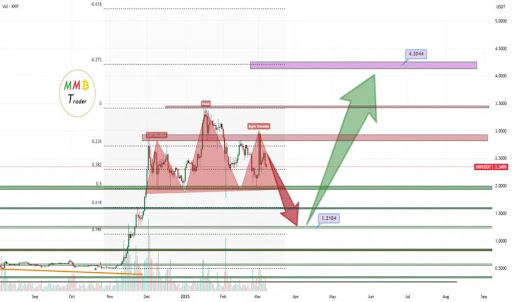
Looking at the price chart, a break below the pattern’s neckline around the $1.95 price point would confirm XRP’s bearish position. If the cryptocurrency fails to hold the $1.95 support level, a sharp drop, possibly up to 50%, is expected. This massive crash would effectively place the price around the $1.5 level or even as low as $1.2.
While he expects a possible crash to $1.5, MMBTrader also projects an alternative bullish scenario in which the XRP price initiates a strong rebound. The analyst revealed that if the cryptocurrency consolidates near $2 without breaking lower, then a bounce to new highs could follow.
Additionally, the TradingView expert believes that the asset could also experience a significant rally toward $5 after its projected 50% price crash. He highlights that if XRP can hold the support level near $1.5, then a strong reversal could occur, potentially triggering a bullish move between $4 and $4.5.
Whales Scoop Up $385 Million Amid Market Downtrend
While XRP experiences slow momentum due to the market’s recent decline, whales are seizing the opportunity to buy the dip, accumulating a significant amount of the token. According to crypto analyst Brett, an XRP whale has executed a large-scale transaction, buying over 167 million XRP, valued at $368.4 million, in a single purchase.
Related Reading
Brett revealed that this whale purchase was made as the market panicked over increasing volatility and price declines. Over the past few weeks, XRP has struggled to recover from bearish trends, joining the ranks of top cryptocurrencies like Bitcoin and Ethereum, which recorded a major price crash earlier in February.
CoinMarketCap’s data shows that the the altcoin’s price has fallen by 11.6% in just one week. This decline comes as the broader crypto market faces massive liquidations totaling hundreds of millions of dollars.
Featured image from Adobe Stock, chart from Tradingview.com