Bitcoin Price Makes A Break For $100,000 As Bull Run Restarts, Should You Buy Shiba Inu Or Dogecoin This Time? APN News
Source link ]]>
Dogecoin is rising above the $0.120 resistance zone against the US Dollar. DOGE is now showing positive signs and might clear the $0.1280 resistance.
- DOGE price started a fresh increase above the $0.1200 resistance level.
- The price is trading above the $0.1220 level and the 100-hourly simple moving average.
- There was a break above a major declining channel with resistance at $0.1170 on the hourly chart of the DOGE/USD pair (data source from Kraken).
- The price could gain bullish momentum if it clears the $0.1250 and $0.1280 resistance levels.
Dogecoin Price Regains Traction
Dogecoin price started a fresh increase above the $0.1100 resistance zone. DOGE gained traction for a move above the $0.1200 resistance zone, beating Bitcoin and Ethereum. There was also a move above the $0.1250 and $0.1265 resistance levels.
During the increase, there was a break above a major declining channel with resistance at $0.1170 on the hourly chart of the DOGE/USD pair. The pair traded as high as $0.1297 and recently saw a minor downside correction.
The price dipped below the $0.1265 level. It traded below the 23.6% Fib retracement level of the upward move from the $0.1101 swing low to the $0.1297 high. Dogecoin price is now trading above the $0.1200 level and the 100-hourly simple moving average.

Immediate resistance on the upside is near the $0.1280 level. The next major resistance is near the $0.1300 level. A close above the $0.1300 resistance might send the price toward the $0.1320 resistance. Any more gains might send the price toward the $0.1350 level. The next major stop for the bulls might be $0.1400.
Are Dips Supported In DOGE?
If DOGE’s price fails to climb above the $0.1280 level, it could start another decline. Initial support on the downside is near the $0.1235 level. The next major support is near the $0.1200 level and the 50% Fib retracement level of the upward move from the $0.1101 swing low to the $0.1297 high.
The main support sits at $0.1175. If there is a downside break below the $0.1175 support, the price could decline further. In the stated case, the price might decline toward the $0.1150 level or even $0.1120 in the near term.
Technical Indicators
Hourly MACD – The MACD for DOGE/USD is now gaining momentum in the bullish zone.
Hourly RSI (Relative Strength Index) – The RSI for DOGE/USD is now above the 50 level.
Major Support Levels – $0.1235 and $0.1200.
Major Resistance Levels – $0.1280 and $0.1300.
]]>Bitcoin price started a fresh increase above the $62,000 resistance zone. BTC is now consolidating and might aim for more upsides above $63,000.
- Bitcoin is struggling to start a fresh increase above the $63,200 zone.
- The price is trading above $61,500 and the 100 hourly Simple moving average.
- There is a short-term declining channel forming with resistance at $63,000 on the hourly chart of the BTC/USD pair (data feed from Kraken).
- The pair could regain traction if there is a close above the $63,200 resistance zone.
Bitcoin Price Holds Support
Bitcoin price formed a base and started a fresh increase above the $61,200 resistance. BTC cleared the $62,000 resistance to move into a positive zone. The price even spiked above $63,000 before the bears appeared.
A high was formed at $63,445 and the price is now consolidating gains. There was a minor decline below the $63,000 level. There was a minor move below the 23.6% Fib retracement level of the upward move from the $58,888 swing low to the $63,445 high.
Bitcoin price is now trading above $62,000 and the 100 hourly Simple moving average. On the upside, the price could face resistance near the $63,000 level. There is also a short-term declining channel forming with resistance at $63,000 on the hourly chart of the BTC/USD pair.
The first key resistance is near the $63,200 level. A clear move above the $63,200 resistance might send the price higher. The next key resistance could be $63,500.

A close above the $63,200 resistance might initiate more gains. In the stated case, the price could rise and test the $64,500 resistance level. Any more gains might send the price toward the $65,000 resistance level.
Another Decline In BTC?
If Bitcoin fails to rise above the $63,200 resistance zone, it could start another decline. Immediate support on the downside is near the $62,250 level.
The first major support is near the $62,000 level. The next support is now near the $61,150 zone or the 50% Fib retracement level of the upward move from the $58,888 swing low to the $63,445 high. Any more losses might send the price toward the $60,000 support in the near term.
Technical indicators:
Hourly MACD – The MACD is now losing pace in the bullish zone.
Hourly RSI (Relative Strength Index) – The RSI for BTC/USD is now above the 50 level.
Major Support Levels – $62,000, followed by $61,150.
Major Resistance Levels – $63,000, and $63,500.
]]>XRP price found support near the $0.5600 zone. The price is again rising and might aim for a break above the $0.60 resistance zone.
- XRP price remained supported near the $0.560 zone.
- The price is now trading above $0.5750 and the 100-hourly Simple Moving Average.
- There was a break above a connecting bearish trend line with resistance at $0.5750 on the hourly chart of the XRP/USD pair (data source from Kraken).
- The pair could gain bullish momentum if it clears the $0.590 and $0.600 resistance levels.
XRP Price Regains Strength
XRP price started a fresh decline from the $0.5985 zone like Bitcoin and Ethereum. The price declined below the $0.5750 support zone, but the bulls were active near the $0.560 zone.
A low was formed at $0.5597 and the price started a fresh upward move, beating BTC and ETH. There was a steady increase above the $0.570 and $0.5720 resistance levels. It cleared the 50% Fib retracement level of the downward move from the $0.5989 swing high to the $0.5597 low.
There was a break above a connecting bearish trend line with resistance at $0.5750 on the hourly chart of the XRP/USD pair. The price is now trading above $0.5750 and the 100-hourly Simple Moving Average.
On the upside, the price might face resistance near the $0.5890 level. It is close to the 76.4% Fib retracement level of the downward move from the $0.5989 swing high to the $0.5597 low. The first major resistance is near the $0.590 level.
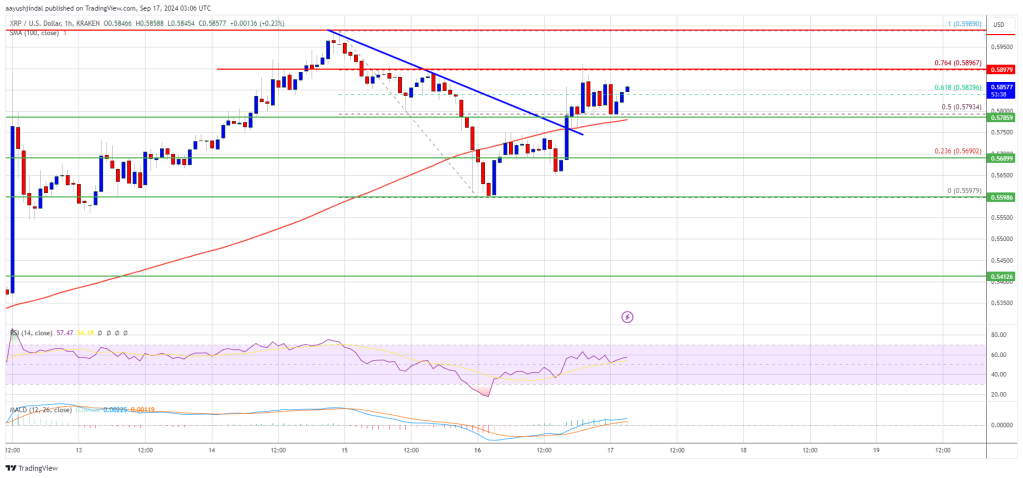
The next key resistance could be $0.600. A clear move above the $0.600 resistance might send the price toward the $0.6120 resistance. The next major resistance is near the $0.6250 level. Any more gains might send the price toward the $0.6320 resistance or even $0.6440 in the near term.
Another Decline?
If XRP fails to clear the $0.590 resistance zone, it could start another decline. Initial support on the downside is near the $0.5765 level. The next major support is $0.5750.
If there is a downside break and a close below the $0.5750 level, the price might continue to decline toward the $0.560 support in the near term. The next major support sits at $0.5420.
Technical Indicators
Hourly MACD – The MACD for XRP/USD is now gaining pace in the bullish zone.
Hourly RSI (Relative Strength Index) – The RSI for XRP/USD is now above the 50 level.
Major Support Levels – $0.5765 and $0.5600.
Major Resistance Levels – $0.5900 and $0.6000.
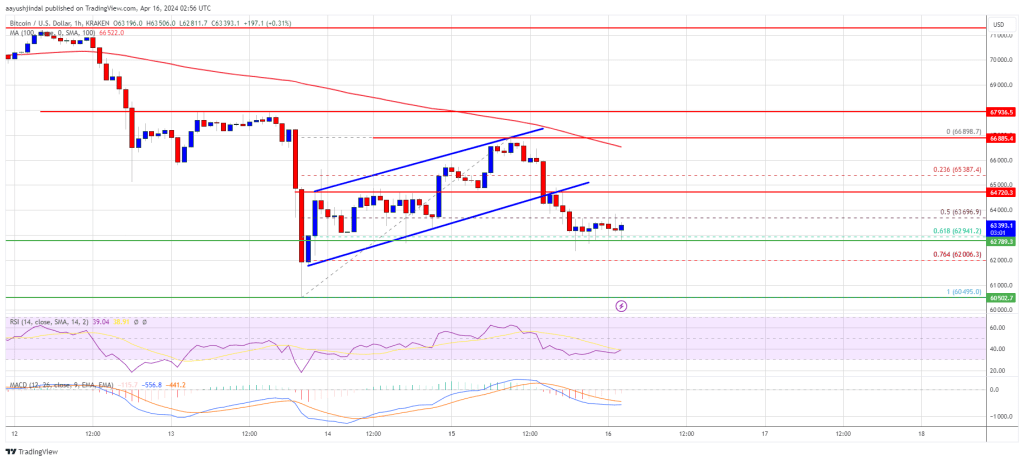
]]>Bitcoin price started another decline from the $67,000 zone. BTC is showing bearish signs and might soon revisit the $61,000 support zone.
- Bitcoin failed to clear the $67,000 resistance zone.
- The price is trading below $65,000 and the 100 hourly Simple moving average.
- There was a break below a rising channel with support at $64,900 on the hourly chart of the BTC/USD pair (data feed from Kraken).
- The pair could extend its decline unless it clears the $65,000 resistance zone.
Bitcoin Price Recovery Stalls
Bitcoin price attempted a recovery wave above the $65,000 resistance zone. BTC even climbed above $66,200, but the bears were active near the $67,000 zone.
A high was formed at $66,898 and the price started another decline amid rising tensions between Israel and Iran. There was a move below the $65,000 and $64,000 levels. The price traded below the 50% Fib retracement level of the upward move from the $60,495 swing low to the $66,898 high.
There was a break below a rising channel with support at $64,900 on the hourly chart of the BTC/USD pair. Bitcoin is now trading below $65,000 and the 100 hourly Simple moving average. The bulls are now protecting the 61.8% Fib retracement level of the upward move from the $60,495 swing low to the $66,898 high at $63,000.
Immediate resistance is near the $63,750 level. The first major resistance could be $64,700. The next resistance now sits at $65,000. If there is a clear move above the $65,000 resistance zone, the price could continue to move up. In the stated case, the price could rise toward $66,800 and the 100 hourly Simple moving average.
Source: BTCUSD on TradingView.com
The next major resistance is near the $67,200 zone. Any more gains might send Bitcoin toward the $70,000 resistance zone in the near term.
More Losses In BTC?
If Bitcoin fails to rise above the $65,000 resistance zone, it could start another decline. Immediate support on the downside is near the $63,000 level.
The first major support is $62,000. If there is a close below $62,000, the price could start to drop toward the $61,000 level. Any more losses might send the price toward the $60,500 support zone in the near term.
Technical indicators:
Hourly MACD – The MACD is now losing pace in the bearish zone.
Hourly RSI (Relative Strength Index) – The RSI for BTC/USD is now below the 50 level.
Major Support Levels – $63,000, followed by $62,000.
Major Resistance Levels – $64,700, $65,000, and $67,000.
Disclaimer: The article is provided for educational purposes only. It does not represent the opinions of NewsBTC on whether to buy, sell or hold any investments and naturally investing carries risks. You are advised to conduct your own research before making any investment decisions. Use information provided on this website entirely at your own risk.
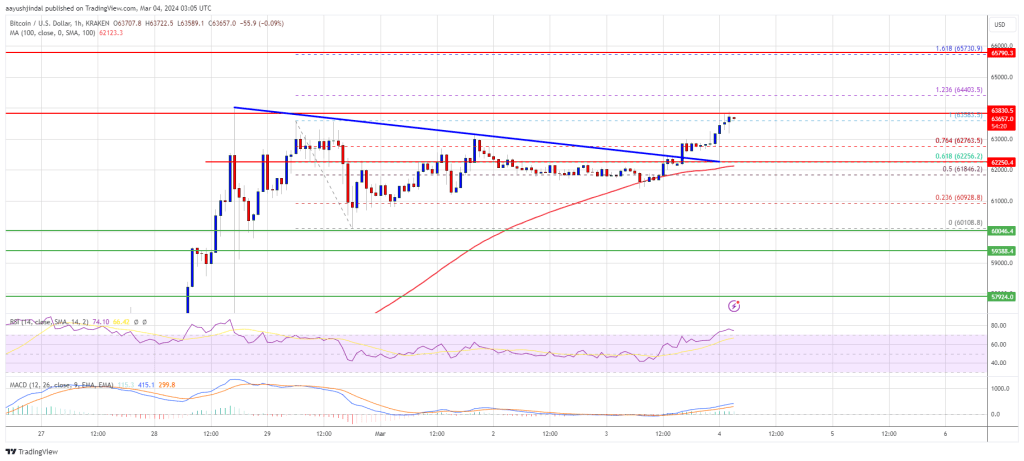
Bitcoin price is gaining momentum above the $62,000 resistance. BTC is signaling an upside break and might surge toward the $65,000 resistance.
- Bitcoin price is moving higher from the $61,200 support zone.
- The price is trading above $62,500 and the 100 hourly Simple moving average.
- There was a break above a key bearish trend line with resistance at $62,300 on the hourly chart of the BTC/USD pair (data feed from Kraken).
- The pair could accelerate higher toward the $65,000 resistance or even $65,730.
Bitcoin Price Regains Strength
Bitcoin price remained well-bid above the $60,000 support zone. A base was formed, and the price started a fresh increase above the $62,000 resistance.
There was a break above a key bearish trend line with resistance at $62,300 on the hourly chart of the BTC/USD pair. The pair even cleared the 76.4% Fib retracement level of the downward move from the $63,583 swing high to the $60,108 low.
Bitcoin is now trading above $62,500 and the 100 hourly Simple moving average. Immediate resistance is near the $63,800 level. The next key resistance could be $64,500, above which the price could rise toward the $65,000 resistance zone.
Source: BTCUSD on TradingView.com
If the bulls remain in action, the price could even surpass $65,000 and test $65,500. Any more gains might send the price toward the 1.618 Fib extension level of the downward move from the $63,583 swing high to the $60,108 low at $65,730.
Are Dips Supported In BTC?
If Bitcoin fails to rise above the $64,000 resistance zone, it could start another downside correction. Immediate support on the downside is near the $62,750 level.
The first major support is $62,250 or the 100 hourly SMA. If there is a close below $62,250, the price could start a decent pullback toward the $61,000 zone. Any more losses might send the price toward the $60,000 support zone.
Technical indicators:
Hourly MACD – The MACD is now gaining pace in the bullish zone.
Hourly RSI (Relative Strength Index) – The RSI for BTC/USD is now above the 50 level.
Major Support Levels – $62,750, followed by $62,250.
Major Resistance Levels – $63,800, $65,000, and $65,730.
Disclaimer: The article is provided for educational purposes only. It does not represent the opinions of NewsBTC on whether to buy, sell or hold any investments and naturally investing carries risks. You are advised to conduct your own research before making any investment decisions. Use information provided on this website entirely at your own risk.
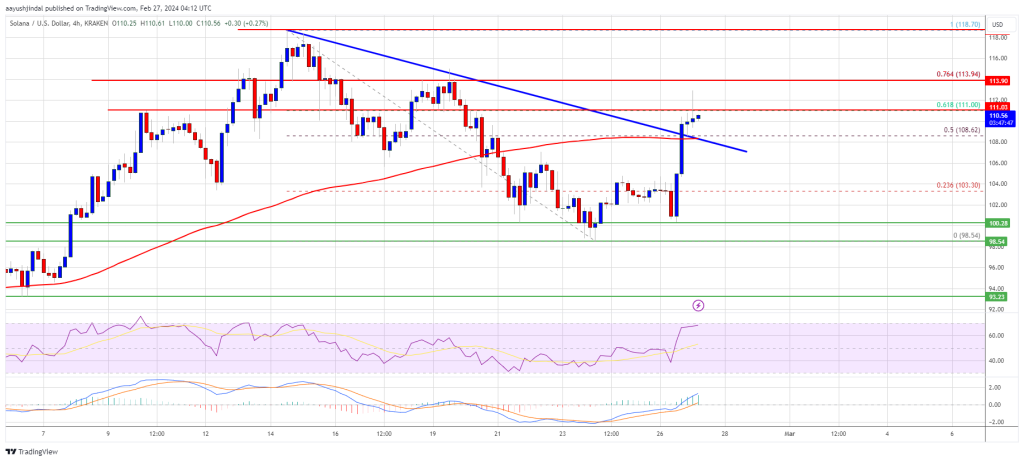
Solana is gaining bullish momentum above $108. SOL price is showing positive signs, and it could even surpass the $118 resistance in the near term.
- SOL price started a fresh increase from the $98.50 support against the US Dollar.
- The price is now trading above $108 and the 100 simple moving average (4 hours).
- There was a break above a major bearish trend line with resistance at $108.80 on the 4-hour chart of the SOL/USD pair (data source from Kraken).
- The pair could continue to rally if it clears the $115 and $118 resistance levels.
Solana Price Starts Fresh Increase
Solana price formed a base above the $98.50 support zone and recently started a fresh increase. There was a decent increase above the $102 and $105 levels.
The price is up nearly 10% and there was a move above the $108 level, like Bitcoin and Ethereum. There was a break above a major bearish trend line with resistance at $108.80 on the 4-hour chart of the SOL/USD pair. The bulls pushed the price above the 50% Fib retracement level of the downward move from the $118.70 swing high to the $98.54 low.
Solana is now trading above $110 and the 100 simple moving average (4 hours). Immediate resistance is near the $111 level. The next major resistance is near the $114 level or the 76.4% Fib retracement level of the downward move from the $118.70 swing high to the $98.54 low.
Source: SOLUSD on TradingView.com
A successful close above the $114 resistance could set the pace for another major increase. The next key resistance is near $118. Any more gains might send the price toward the $125 level.
Are Dips Limited in SOL?
If SOL fails to rally above the $114 resistance, it could start a downside correction. Initial support on the downside is near the $108.50 level or the 100 simple moving average (4 hours).
The first major support is near the $105.00 level, below which the price could test $98.50. If there is a close below the $98.50 support, the price could decline toward the $92 support in the near term.
Technical Indicators
4-Hours MACD – The MACD for SOL/USD is gaining pace in the bullish zone.
4-Hours RSI (Relative Strength Index) – The RSI for SOL/USD is above the 50 level.
Major Support Levels – $108.50, and $105.00.
Major Resistance Levels – $114, $118, and $125.
Disclaimer: The article is provided for educational purposes only. It does not represent the opinions of NewsBTC on whether to buy, sell or hold any investments and naturally investing carries risks. You are advised to conduct your own research before making any investment decisions. Use information provided on this website entirely at your own risk.
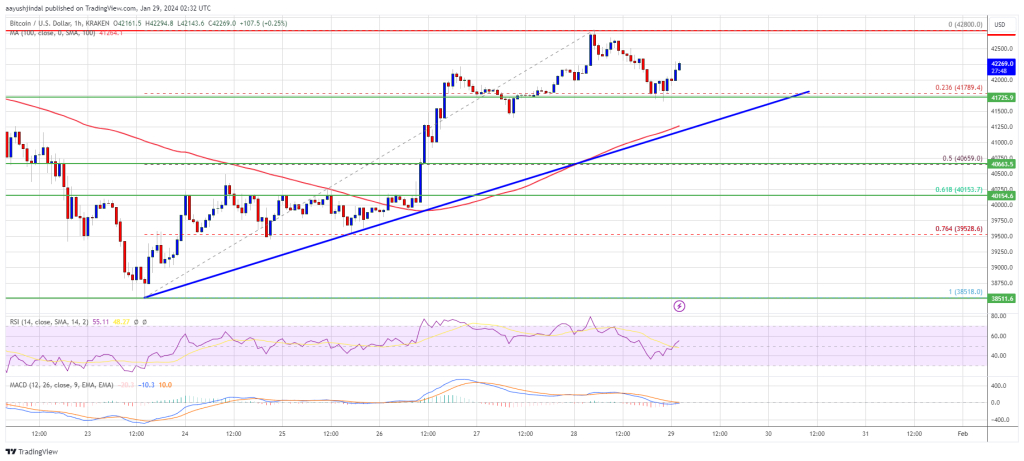
Bitcoin price is recovering higher above the $42,000 resistance. BTC must clear $42,800 and $43,500 to start an increase toward the $45,000 resistance.
- Bitcoin price is moving higher above the $42,000 resistance zone.
- The price is trading above $41,500 and the 100 hourly Simple moving average.
- There is a key bullish trend line forming with support near $41,500 on the hourly chart of the BTC/USD pair (data feed from Kraken).
- The pair could start a steady increase if it clears the $42,800 and $43,500 resistance levels.
Bitcoin Price Aims Higher
Bitcoin price formed a support base above the $40,000 support zone. BTC started a decent increase above the $41,200 and $41,500 resistance levels.
It opened the doors for more gains above $42,000 and the 100 hourly Simple moving average. Finally, the price tested the $42,800 zone. A high was formed near $42,800 before there was a minor decline. The price declined below the $42,200 level.
Bitcoin tested the 23.6% Fib retracement level of the upward move from the $38,518 swing low to the $42,800 high. There is also a key bullish trend line forming with support near $41,500 on the hourly chart of the BTC/USD pair.
The price is now trading above $41,500 and the 100 hourly Simple moving average. Immediate resistance is near the $42,500 level. The next key resistance could be $42,800, above which the price could rise and test $43,500.
Source: BTCUSD on TradingView.com
A clear move above the $43,500 resistance could send the price toward the $44,250 resistance. The next resistance is now forming near the $45,000 level. A close above the $45,000 level could push the price further higher. The next major resistance sits at $46,500.
Another Drop In BTC?
If Bitcoin fails to rise above the $42,800 resistance zone, it could start another decline. Immediate support on the downside is near the $41,750 level.
The next major support is $41,500 and the trend line. If there is a close below $41,500, the price could gain bearish momentum. In the stated case, the price could dive toward the $40,650 support or the 50% Fib retracement level of the upward move from the $38,518 swing low to the $42,800 high in the near term.
Technical indicators:
Hourly MACD – The MACD is now gaining pace in the bullish zone.
Hourly RSI (Relative Strength Index) – The RSI for BTC/USD is now above the 50 level.
Major Support Levels – $41,500, followed by $40,650.
Major Resistance Levels – $42,800, $43,500, and $45,000.
Disclaimer: The article is provided for educational purposes only. It does not represent the opinions of NewsBTC on whether to buy, sell or hold any investments and naturally investing carries risks. You are advised to conduct your own research before making any investment decisions. Use information provided on this website entirely at your own risk.

-
Cryptocurrencies are in a strong uptrend ahead of Christmas.
-
There are signs that a Santa Claus rally is underway.
-
Memeinator token is nearing its target goal.
A Santa Claus rally is emerging in the crypto and stock market. Bitcoin is targeting the year-to-date high while American indices like the Dow Jones, S&P 500, and Nasdaq 100 indices are trading at their record highs.
In addition to BTC, other cryptocurrencies like Solana, Bonk, and IoTeX are also doing well. Indeed, Solana has just overtaken XRP to become the fifth biggest cryptocurrency in the world, helped by the meme coin hype.
Meanwhile, Memeinator, an upcoming cryptocurrency that aims to infuse the concept of Artificial Intelligence (AI) with meme coins is thriving. Its token sale is slowly nearing its target of $2.4 million as it nears its end.
Why are cryptocurrencies soaring?
Cryptocurrency prices are surging because of several important factors. First, the SEC, Blackrock, and Nasdaq held their second meeting to deliberate on the mechanics of a spot Bitcoin ETF. This meeting confirmed to many people that the SEC would approve these ETFs in the coming weeks or months.
They are also jumping because of monetary policy issues. On Wednesday, the Office of National Statistics (ONS) published encouraging inflation data. The data revealed that the UK inflation dropped below 4% in November.
These numbers confirmed that global inflation was falling and that central banks wll start cutting interest rates in the coming months. The Fed has hinted that it will start lowering rates in June next year. Other banks like the ECB and the Swiss National Bank (SNB) are also expected to lower rates.
Cryptocurrencies and stocks tend to do well in a period of rate cuts because it usually ushers a new era of risk-on sentiment. This explains why the US dollar index and global bond yields have pulled back in the past few weeks.
Therefore, analysts believe that the cryptocurrency bull run is just geting started. In a note, an analyst at CryptoQuant noted that Bitcoin could rise to a high of $164k in 2024. He highlighted the following factors.
“We argue that bitcoin and crypto markets could have a positive year in 2024 mostly amid the effects from: 1. The market valuation cycle, 2. Network activity, 3. The bitcoin halving, 4. The macroeconomic perspective, 5. Bitcoin spot ETF approval and 6. Growing stablecoin liquidity.”
Memeinator to benefit
Memeinator’s MMTR token will likely benefit if this forecast is accurate since most altcoins tend to do well when Bitcoin is rising. We have seen several new meme coins surge in 2023. For example, coins like Bonk and Pepe have gained a combined market cap of over $1 billion this year.
Memeinator is aiming to conquer this industry by creating a cult following among community members. Already, more than 384k people have entered its competition to win a trip to space using Virgin Galactic’s ship. Its promotion has also reached millions of users.
In addition to its meme coin tools, the network aims to take advantage of artificial intelligence, which has gone mainstream this year. Therefore, I suspect that the MMTR will join the crypto rally in 2024. You can buy the MMTR token here.
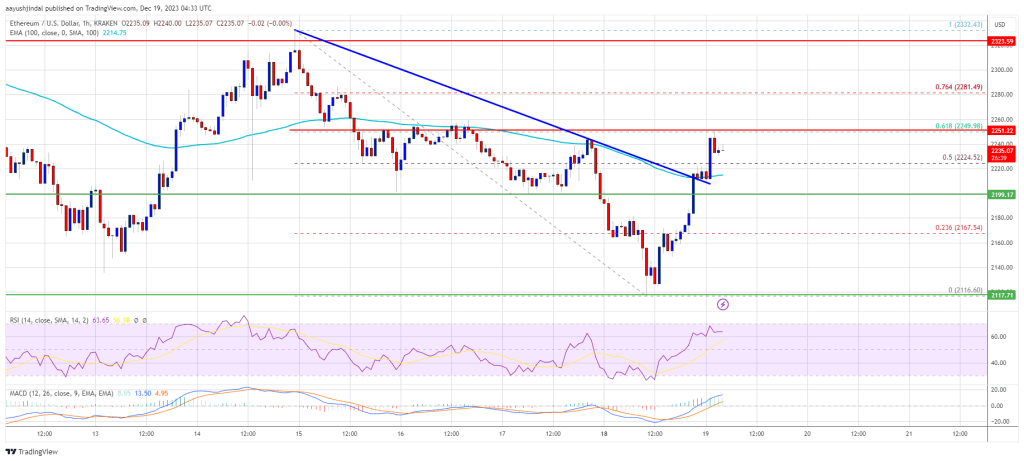
Ethereum price is recovering losses from the $2,120 support. ETH is up over 3% and the price could gain pace if it clears the $2,250 resistance.
- Ethereum is moving higher from the $2,120 support zone.
- The price is trading above $2,200 and the 100-hourly Simple Moving Average.
- There was a break above a key bearish trend line with resistance near $2,210 on the hourly chart of ETH/USD (data feed via Kraken).
- The pair could climb further higher if it clears the $2,250 resistance zone.
Ethereum Price Restarts Increase
Ethereum price extended its decline below the $2,150 level. ETH remained strong above the $2,120 level. A low was formed near $2,116 and the price started a fresh increase, like Bitcoin.
There was a move above the $2,150 and $2,200 resistance levels. The price climbed above the 50% Fib retracement level of the downward move from the $2,332 swing high to the $2,116 low. There was also a break above a key bearish trend line with resistance near $2,210 on the hourly chart of ETH/USD.
Ethereum is now trading above $2,200 and the 100-hourly Simple Moving Average. On the upside, the price is facing resistance near the $2,250 level. It is close to the 61.8% Fib retracement level of the downward move from the $2,332 swing high to the $2,116 low.
Source: ETHUSD on TradingView.com
The next key resistance is near the $2,280 level. A clear move above the $2,280 zone could send the price toward the $2,330 level. The next resistance sits at $2,400. Any more gains could start a wave toward the $2,550 level, above which Ethereum might rally and test the $2,750 zone.
Another Decline in ETH?
If Ethereum fails to clear the $2,250 resistance, it could start another decline. Initial support on the downside is near the $2,210 level or the 100 hourly SMA.
The first key support could be the $2,200 zone. A downside break and a close below $2,200 might start another major decline. In the stated case, Ether could revisit the $2,120 support. Any more losses might send the price toward the $2,000 level in the coming days.
Technical Indicators
Hourly MACD – The MACD for ETH/USD is gaining momentum in the bullish zone.
Hourly RSI – The RSI for ETH/USD is now above the 50 level.
Major Support Level – $2,200
Major Resistance Level – $2,250
Disclaimer: The article is provided for educational purposes only. It does not represent the opinions of NewsBTC on whether to buy, sell or hold any investments and naturally investing carries risks. You are advised to conduct your own research before making any investment decisions. Use information provided on this website entirely at your own risk.