Ethereum price is showing positive signs above the $2,680 zone. ETH is gaining pace and an upside break above $2,755 could trigger bullish moves.
- Ethereum is still showing positive signs above the $2,650 zone.
- The price is trading above $2,720 and the 100-hourly Simple Moving Average.
- There is following a key rising channel with support at $2,725 on the hourly chart of ETH/USD (data feed via Kraken).
- The pair could start a decent upward move if it settles above $2,755 and $2,800.
Ethereum Price Eyes Upside Break
Ethereum price remained supported above the $2,550 level and recently started a decent upward move, but it underperformed Bitcoin. ETH gained pace above the $2,650 and $2,660 resistance levels.
The price even cleared the 50% Fib retracement level of the downward wave from the $2,845 swing high to the $2,604 low. There was also a move above the $2,720 resistance level. Besides, the price is following a key rising channel with support at $2,725 on the hourly chart of ETH/USD.
Ethereum price is now trading above $2,720 and the 100-hourly Simple Moving Average. On the upside, the price seems to be facing hurdles near the $2,755 level. It is close to the 61.8% Fib retracement level of the downward wave from the $2,845 swing high to the $2,604 low.

The first major resistance is near the $2,790 level. The main resistance is now forming near $2,800 or $2,820. A clear move above the $2,820 resistance might send the price toward the $2,880 resistance. An upside break above the $2,880 resistance might call for more gains in the coming sessions. In the stated case, Ether could rise toward the $2,920 resistance zone or even $3,000 in the near term.
Another Decline In ETH?
If Ethereum fails to clear the $2,755 resistance, it could start another decline. Initial support on the downside is near the $2,720 level. The first major support sits near the $2,665 zone.
A clear move below the $2,665 support might push the price toward the $2,620 support. Any more losses might send the price toward the $2,550 support level in the near term. The next key support sits at $2,500.
Technical Indicators
Hourly MACD – The MACD for ETH/USD is gaining momentum in the bullish zone.
Hourly RSI – The RSI for ETH/USD is now above the 50 zone.
Major Support Level – $2,720
Major Resistance Level – $2,755
Bitcoin price gained pace for a move above $58,000 and $60,000. BTC is up over 10% and is signaling more upsides in the near term.
- Bitcoin started a decent increase above the $56,500 and $58,250 levels.
- The price is trading above $60,000 and the 100 hourly Simple moving average.
- There is a connecting bullish trend line forming with support at $60,000 on the hourly chart of the BTC/USD pair (data feed from Kraken).
- The pair might eye more upsides above the $62,500 resistance zone.
Bitcoin Price Could Extend Gains
Bitcoin price started a decent increase above the $55,500 resistance zone. BTC was able to clear the $56,500 and $58,250 resistance levels to move into a positive zone.
The bulls even pumped the price above the $60,000 resistance. The price is up over 10% and the recent high was formed at $62,700. The price is now consolidating gains near the 23.6% Fib retracement level of the upward move from the $54,556 swing low to the $62,700 high.
Bitcoin price is now trading above $60,000 and the 100 hourly Simple moving average. There is also a connecting bullish trend line forming with support at $60,000 on the hourly chart of the BTC/USD pair.
On the upside, the price could face resistance near the $62,000 level. The first key resistance is near the $62,500 level. A clear move above the $62,500 resistance might send the price further higher in the coming sessions. The next key resistance could be $63,500.

The next major hurdle sits at $65,000. A close above the $65,000 resistance might spark bullish moves. In the stated case, the price could rise and test the $67,000 resistance.
Are Dips Limited In BTC?
If Bitcoin fails to rise above the $62,500 resistance zone, it could start a downside correction. Immediate support on the downside is near the $60,700 level.
The first major support is $60,000 and the trend line. The next support is now near $57,750 or the 61.8% Fib retracement level of the upward move from the $54,556 swing low to the $62,700 high. Any more losses might send the price toward the $55,000 support zone in the near term.
Technical indicators:
Hourly MACD – The MACD is now gaining pace in the bullish zone.
Hourly RSI (Relative Strength Index) – The RSI for BTC/USD is now above the 50 level.
Major Support Levels – $60,700, followed by $60,000.
Major Resistance Levels – $62,000, and $62,500.
- Dogecoin price consolidates after a technical indicator flashed a local top signal.
- The Relative Strength Index (RSI) also indicates that DOGE may be slightly overbought.
- However, a close above the 27.2% Fibonacci retracement level may suggest the token could continue its rally higher.
Dogecoin price could see further consolidation before continuing its rally. A technical indicator suggests that DOGE has printed a local top, and the canine-themed token could retest critical support levels before making its next big move.
Dogecoin price slightly overbought
Dogecoin price appears to have broken out of a symmetrical triangle pattern to the upside, suggesting a bullish outlook.
On the 12-hour chart, Dogecoin price sliced above the upper boundary of the governing chart pattern on August 6, which resulted in a surge of 31%. The prevailing symmetrical triangle pattern suggests that DOGE could rally 45%, reaching an upper target of $0.314, near the 200 twelve-hour Simple Moving Average (SMA).
However, the Momentum Reversal Indicator (MRI) printed an MRI top signal, hinting that Dogecoin price could see a trend reversal and retest crucial support levels in the near term.
Adding credence to the correction thesis is the Relative Strength Index (RSI), which suggests that Dogecoin price was slightly overbought.
Dogecoin price may find immediate support at the 27.2% Fibonacci retracement level at $0.249. Should DOGE be able to close above this line of defense, the token may see a higher chance of continuing its rally.
The next line of defense for Dogecoin price is at the 38.2% Fibonacci retracement level at $0.236.
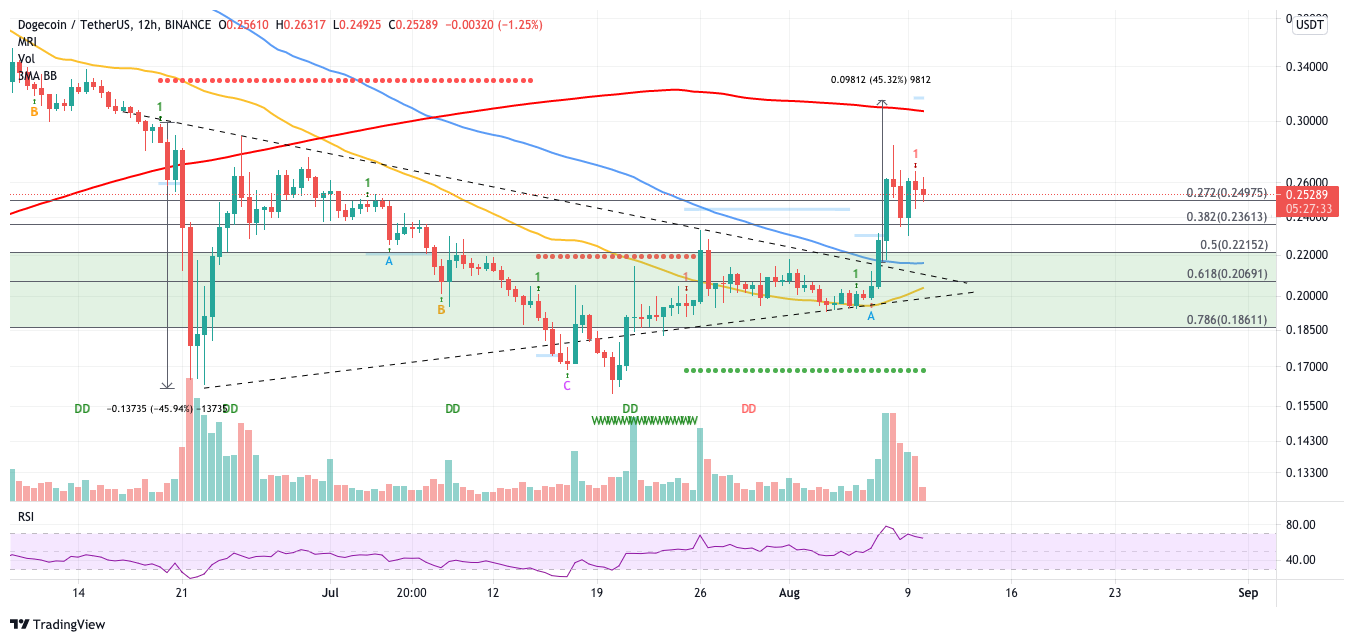
DOGE/USDT 12-hour chart
Further selling pressure may see DOGE collapse into the start of the demand barrier, at the 50% Fibonacci retracement level at $0.221 before testing the 100 twelve-hour SMA and the topside trend line of the symmetrical triangle.
Dogecoin price may identify further support at the 61.8% Fibonacci retracement level, coinciding with the 50 twelve-hour SMA at $0.206, should the buyers continue to struggle with lifting prices against the overpowering distribution of the sellers.
If buying pressure prevails and sees DOGE price close above the 27.2% Fibonacci retracement level at $0.249, Dogecoin price could aim for a rally of 25% to $0.314, effecting the target given by the symmetrical triangle pattern.