Cardano Price Prediction: ADA And ETH Bulls Face Tech Shift As DeepSnitch AI Rips Toward 100X January Launch BlockchainReporter
Source link ]]>
Bitcoin price started a fresh increase above $92,500. BTC is trading above $95,000 and attempting a close for another increase to $100k.
- Bitcoin started a decent increase above $92,000 and $94,500.
- The price is trading above $95,000 and the 100 hourly Simple moving average.
- There was a break above a contracting triangle with resistance at $92,000 on the hourly chart of the BTC/USD pair (data feed from Kraken).
- The pair might continue to move up if it stays above the $94,000 zone.
Bitcoin Price Gains Over 4%
Bitcoin price managed to stay above the $90,500 support and started a fresh increase. BTC was able to settle above $92,000 and $92,500.
There was a break above a contracting triangle with resistance at $92,000 on the hourly chart of the BTC/USD pair. The bulls were able to push the price above $93,500. Finally, the price spiked above $96,000. A high was formed at $96,476, and the price is now consolidating gains above the 23.6% Fib retracement level of the recent wave from the $89,995 swing low to the $96,476 high.
Bitcoin is now trading above $95,000 and the 100 hourly Simple moving average. If the price remains stable above $94,500, it could attempt a fresh increase. Immediate resistance is near the $96,000 level. The first key resistance is near the $96,500 level.
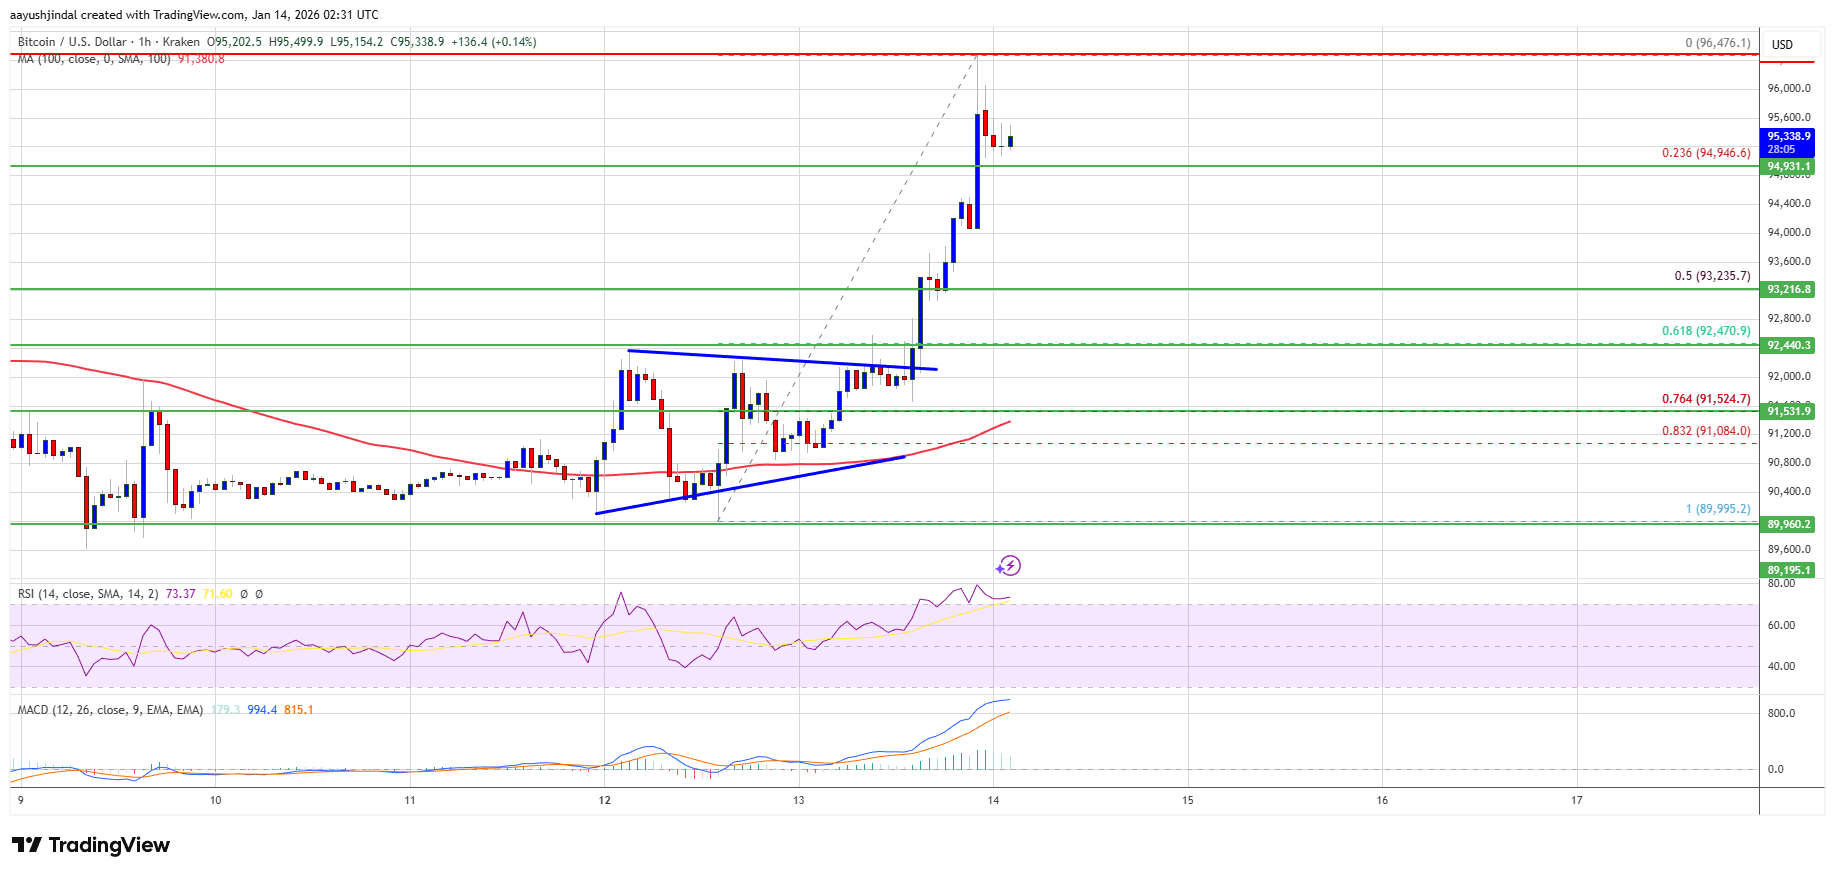
The next resistance could be $96,800. A close above the $96,800 resistance might send the price further higher. In the stated case, the price could rise and test the $98,000 resistance. Any more gains might send the price toward the $98,500 level. The next barrier for the bulls could be $99,000 and $100,000.
Another Drop In BTC?
If Bitcoin fails to rise above the $96,000 resistance zone, it could start another decline. Immediate support is near the $95,000 level. The first major support is near the $94,500 level.
The next support is now near the $93,200 zone or the 50% Fib retracement level of the recent wave from the $89,995 swing low to the $96,476 high. Any more losses might send the price toward the $92,500 support in the near term. The main support sits at $91,500, below which BTC might accelerate lower in the near term.
Technical indicators:
Hourly MACD – The MACD is now losing pace in the bullish zone.
Hourly RSI (Relative Strength Index) – The RSI for BTC/USD is now above the 50 level.
Major Support Levels – $95,000, followed by $94,500.
Major Resistance Levels – $96,000 and $96,800.
Ethereum price started a major increase above the $3,160 resistance. ETH is now consolidating gains and might dip toward the $3,250 zone.
- Ethereum started a downside correction after a major rally to $3,375.
- The price is trading above $3,300 and the 100-hourly Simple Moving Average.
- There was a break above a major bearish trend line with resistance at $3,140 on the hourly chart of ETH/USD (data feed via Kraken).
- The pair could continue to move up if it stays above the $3,250 zone.
Ethereum Price Revisits $3,350
Ethereum price remained stable above $31,20 and started a fresh increase, like Bitcoin. ETH price rallied above the $3,160 and $3,200 resistance levels.
There was a break above a major bearish trend line with resistance at $3,140 on the hourly chart of ETH/USD. The bulls even pumped the price above $3,300. A high was formed at $3,374, and the price is now correcting some gains.
Ethereum price is now trading above $3,300 and the 100-hourly Simple Moving Average. If the bulls can protect more losses below $3,300 or the 23.6% Fib retracement level of the recent wave from the $3,061 swing low to the $3,374 high, the price could attempt another increase.
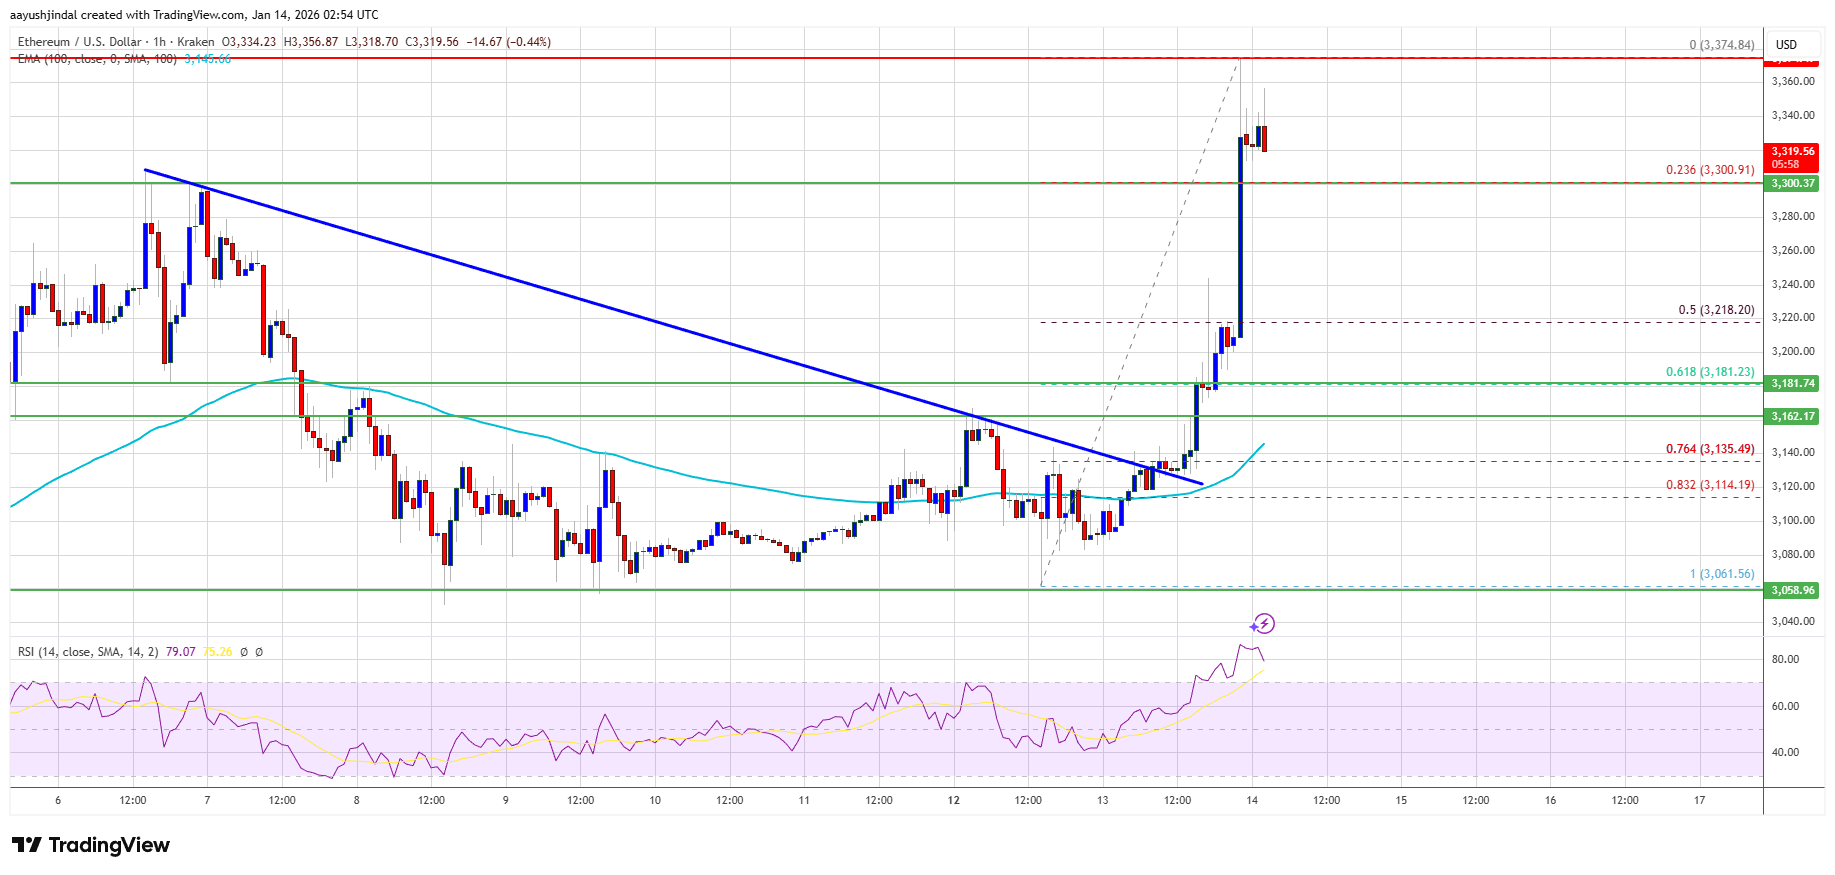
Immediate resistance is seen near the $3,340 level. The first key resistance is near the $3,380 level. The next major resistance is near the $3,420 level. A clear move above the $3,420 resistance might send the price toward the $3,500 resistance. An upside break above the $3,500 region might call for more gains in the coming days. In the stated case, Ether could rise toward the $3,550 resistance zone or even $3,650 in the near term.
Downside Correction In ETH?
If Ethereum fails to clear the $3,340 resistance, it could start a fresh decline. Initial support on the downside is near the $3,300 level. The first major support sits near the $3,250 zone.
A clear move below the $3,250 support might push the price toward the $3,220 support and the 50% Fib retracement level of the recent wave from the $3,061 swing low to the $3,374 high. Any more losses might send the price toward the $3,180 region.
Technical Indicators
Hourly MACD – The MACD for ETH/USD is losing momentum in the bullish zone.
Hourly RSI – The RSI for ETH/USD is now above the 50 zone.
Major Support Level – $3,250
Major Resistance Level – $3,340
Aayush Jindal, a luminary in the world of financial markets, whose expertise spans over 15 illustrious years in the realms of Forex and cryptocurrency trading. Renowned for his unparalleled proficiency in providing technical analysis, Aayush is a trusted advisor and senior market expert to investors worldwide, guiding them through the intricate landscapes of modern finance with his keen insights and astute chart analysis.
From a young age, Aayush exhibited a natural aptitude for deciphering complex systems and unraveling patterns. Fueled by an insatiable curiosity for understanding market dynamics, he embarked on a journey that would lead him to become one of the foremost authorities in the fields of Forex and crypto trading. With a meticulous eye for detail and an unwavering commitment to excellence, Aayush honed his craft over the years, mastering the art of technical analysis and chart interpretation.
As a software engineer, Aayush harnesses the power of technology to optimize trading strategies and develop innovative solutions for navigating the volatile waters of financial markets. His background in software engineering has equipped him with a unique skill set, enabling him to leverage cutting-edge tools and algorithms to gain a competitive edge in an ever-evolving landscape.
In addition to his roles in finance and technology, Aayush serves as the director of a prestigious IT company, where he spearheads initiatives aimed at driving digital innovation and transformation. Under his visionary leadership, the company has flourished, cementing its position as a leader in the tech industry and paving the way for groundbreaking advancements in software development and IT solutions.
Despite his demanding professional commitments, Aayush is a firm believer in the importance of work-life balance. An avid traveler and adventurer, he finds solace in exploring new destinations, immersing himself in different cultures, and forging lasting memories along the way. Whether he’s trekking through the Himalayas, diving in the azure waters of the Maldives, or experiencing the vibrant energy of bustling metropolises, Aayush embraces every opportunity to broaden his horizons and create unforgettable experiences.
Aayush’s journey to success is marked by a relentless pursuit of excellence and a steadfast commitment to continuous learning and growth. His academic achievements are a testament to his dedication and passion for excellence, having completed his software engineering with honors and excelling in every department.
At his core, Aayush is driven by a profound passion for analyzing markets and uncovering profitable opportunities amidst volatility. Whether he’s poring over price charts, identifying key support and resistance levels, or providing insightful analysis to his clients and followers, Aayush’s unwavering dedication to his craft sets him apart as a true industry leader and a beacon of inspiration to aspiring traders around the globe.
In a world where uncertainty reigns supreme, Aayush Jindal stands as a guiding light, illuminating the path to financial success with his unparalleled expertise, unwavering integrity, and boundless enthusiasm for the markets.
After weeks of whisper-quiet consolidation, Ethereum has finally found its voice, roaring through a historically thin price zone with conviction. Backed by heavy volume and strong weekly closes, ETH’s breakout isn’t just technical. The silence is over, and the bulls are back in charge.
Weekly Charts Tell The Story: ETH Strength vs. SOL Struggle
Cazz, in a recent update on X, highlighted a significant development on the Ethereum weekly chart. The ETH/USD pair has broken out of an 8-week tight consolidation range. This breakout came on the back of high volume and strong weekly closes near the highs. Its rapid price movement through a historically thin zone further confirms that this is classic big money behavior.
The technical structure suggests Ethereum’s bullish momentum is not only gaining traction but also aligning with broader institutional interest. This kind of breakout pattern often indicates the start of a stronger trend, especially when accompanied by elevated volume and price conviction as seen on the chart.
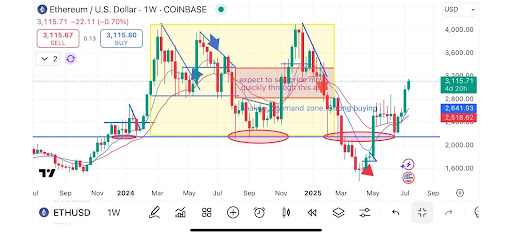
In contrast, the SOL/ETH chart is showing a completely different story. Cazz pointed out that the pair is breaking down below long-term support on the weekly timeframe. This signals relative weakness and may be a sign that market participants are shifting preference away from SOL in the short and medium term. While Solana could still deliver in isolated moves, the overall structure puts Ethereum as the stronger asset.
Cazz’s analysis suggests a shift in market leadership, with Ethereum gaining strength through “classic big money behavior” while Solana shows weakness. As ETH asserts itself as the institutional Layer 1, it could be entering a more dominant phase in the near term.
ETH Shifts Gears: From Accumulation To Acceleration
According to Cazz, after “more than a year of sideways action and base building,” which he notes “can be a sign of institutions building substantial positions,” ETH appears to be transitioning into a new leadership phase. This shift is backed by strong fundamentals (tokenized treasuries, RWAs, DeFi infra) and upcoming regulatory catalysts, all pointing toward Ethereum’s growing dominance.
Cazz highlighted that “Ethereum memes are coming back to life on big volume,” signaling a strong return in community sentiment and trader interest. This renewed energy around Ethereum memes is happening as the price breaks through key levels and narratives regain traction in the market.
In his observation, Cazz pointed out that some are already up 5-10x from local bottoms, showcasing just how quickly opportunities are unfolding in the Ethereum ecosystem. Such momentum suggests that the quiet accumulation phase may now be giving way to a more aggressive rally led by both fundamentals and capital rotation.
]]>Dogecoin (DOGE) Rival FLOKI Rips After Coinbase Announces Potential Future Listing The Daily Hodl
Source link ]]>
Dogecoin Rips, Bitcoin And Ethereum Surge Amid Strong ETF Inflows And Supportive Economic Data: King Crypto’s ‘New Uptrend’ Anticipated After Close Above $65K Benzinga
Source link ]]>
Shiba Inu (SHIB) Price Rips Chart Apart as Bulls Lock In U.Today
Source link ]]>
Ethereum price dipped sharply after it rallied toward $3,940. ETH is now consolidating near $3,850 and is eyeing more upsides in the near term.
- Ethereum started a consolidation after it rallied toward the $3,940 resistance zone.
- The price is trading above $3,720 and the 100-hourly Simple Moving Average.
- There is a key bullish trend line forming with support at $3,720 on the hourly chart of ETH/USD (data feed via Kraken).
- The pair could continue to move up unless there is a break below the $3,620 support.
Ethereum Price Eyes More Gains
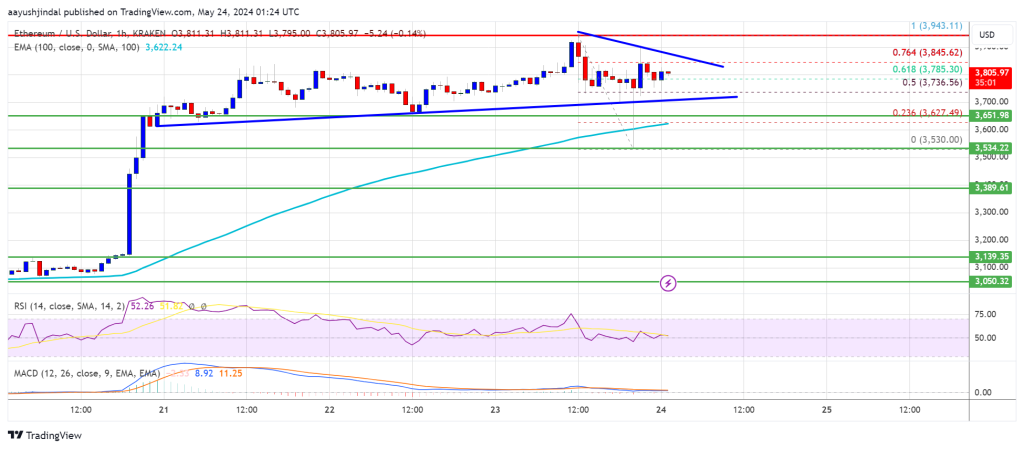
Ethereum price extended its increase above the $3,700 and $3,750 resistance levels. ETH outperformed Bitcoin and even climbed above the $3,880 level. A new weekly high was formed at $3,943 before there was a sharp decline.
The price dived below the $3,800 and $3,750 levels. A low was formed at $3,530 level and the price recovered most losses. It is back above the 50% Fib retracement level of the downward move from the $3,943 swing high to the $3,530 low.
Ethereum is now trading above $3,720 and the 100-hourly Simple Moving Average. There is also a key bullish trend line forming with support at $3,720 on the hourly chart of ETH/USD.
Immediate resistance is near the $3,845 level or the 76.4% Fib retracement level of the downward move from the $3,943 swing high to the $3,530 low. The first major resistance is near the $3,880 level. An upside break above the $3,880 resistance might send the price higher.
The next key resistance sits at $3,940, above which the price might gain traction and rise toward the $4,000 level. If there is a clear move above the $4,000 level, the price might rise and test the $4,080 resistance. Any more gains could send Ether toward the $4,200 resistance zone.
Another Decline In ETH?
If Ethereum fails to clear the $3,840 resistance, it could start another downside correction. Initial support on the downside is near the $3,720 level and the trend line.
The next major support is near the $3,620 zone. A clear move below the $3,620 support might push the price toward $3,550. Any more losses might send the price toward the $3,390 level in the near term.
Technical Indicators
Hourly MACD – The MACD for ETH/USD is gaining momentum in the bullish zone.
Hourly RSI – The RSI for ETH/USD is still above the 50 zone.
Major Support Level – $3,720
Major Resistance Level – $3,880
Venture Capitalist Rips Into Cardano, Questions Network’s Decentralization Claims Bitcoinist
Source link ]]>