U.S. President Donald Trump accused Iran of a “serious violation” during the ceasefire. Due to this unfavorable geopolitical update, Bitcoin (BTC) could be at risk of another downfall. Ad Ad Trump Says Iran Has Committed “Serious Violation” of Ceasefire The U.S. President revealed that Iran opened fire in the Strait of Hormuz, violating the conditions
The post Breaking: Trump Accuses Iran of ‘Serious Violation’ In US Ceasefire, Bitcoin At Risk? appeared first on CoinGape.
]]>Shiba Inu Price Faces Sell-Off Risk as Exchange Inflows Hit 81.5 Trillion SHIB Coinpaper
Source link ]]>

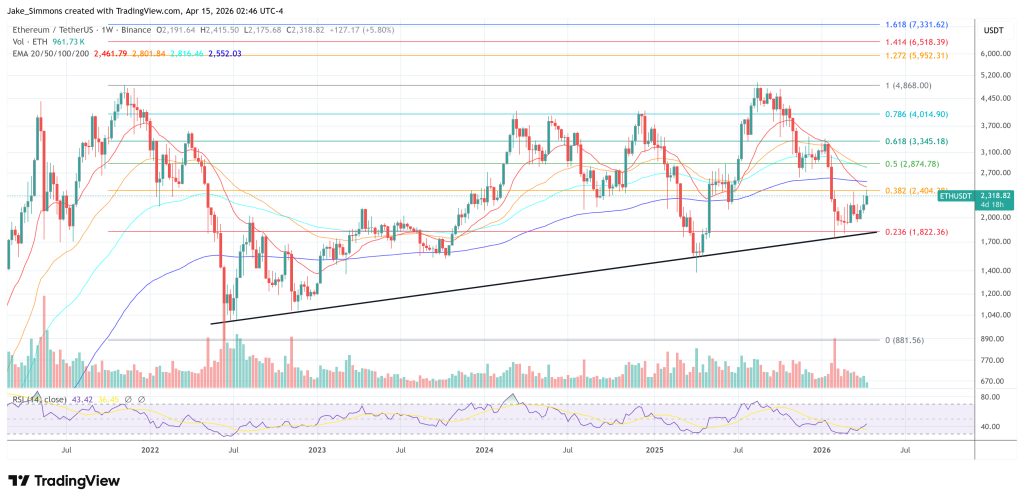
Ethereum is pushing against the $2,400 level but has not been able to close above it, caught in a market that is heating up around it, while the price action remains tentative. The broader environment is increasingly constructive, but ETH is still navigating the lingering effects of the correction that defined the first quarter of 2026. And according to an Arab Chain analysis, the data beneath the price is starting to shift — quietly, gradually, but in a direction that matters.
The Sharpe Ratio for Ethereum on Binance has moved into positive territory, registering approximately 0.07. That is a modest number, and the report does not oversell it. But the significance is less about where the ratio sits today and more about where it has been. For much of the past several months — particularly through the difficult stretch in February — the indicator was in negative territory, meaning ETH holders were absorbing risk without being adequately compensated by returns. That condition has changed.
The 30-day average return now stands at approximately 0.0027, a small but positive figure that reflects a market beginning to recover its footing. Volatility remains elevated enough to cap how quickly the ratio can improve, but the direction has shifted.
From Punishing to Recovering
To appreciate where Ethereum’s risk-adjusted returns stand today, it helps to look at where they have been. Through much of the past several months — and particularly during February, when the market was at its most stressed — the Sharpe Ratio sat in deeply negative territory. That meant holders were taking on significant risk without being compensated for it. Every session of volatility was working against them, and the math of the indicator reflected that clearly.

The gradual shift toward positive values since then is not dramatic, but it is meaningful. The Arab Chain analysis describes it as improving market efficiency — a phrase that captures something real. As Ethereum has stabilized around the $2,300 level, the relationship between risk and return has begun to normalize. Price is no longer swinging violently enough to overwhelm the modest gains that have started accumulating. That kind of equilibrium, where returns improve without being immediately erased by volatility, is typically the foundation for a sustainable trend rather than a short-lived bounce.
The honest caveat is that 0.07 is nowhere near the elevated readings associated with strong bullish momentum. Ethereum has not entered an aggressive upward phase — the data does not support that conclusion yet. What it does support is the idea that the worst is behind the risk-adjusted picture, and that the conditions for genuine recovery are quietly assembling.
If the Sharpe continues climbing in the weeks ahead, it would signal that investor confidence is returning in a durable way. For now, it is early — but the direction has changed, and in markets, direction tends to matter more than level.
Ethereum’s daily structure shows a market attempting to transition from a corrective phase into early recovery, but still facing overhead resistance. After the sharp selloff in early February—marked by a clear capitulation spike in volume that pushed price toward the $1,800 region—ETH established a base and began forming higher lows. This shift indicates that selling pressure has diminished and buyers are gradually stepping back in.

Price is now trading around the $2,300–$2,400 zone, which is technically significant. This area aligns with the 100-day moving average, currently acting as dynamic resistance. ETH has tested this level multiple times but has not yet achieved a decisive breakout, suggesting that supply remains present at these levels. Meanwhile, the 50-day moving average has turned upward beneath price, supporting the short-term recovery trend, while the 200-day moving average remains above, reinforcing the broader bearish context.
Volume has normalized following the February spike, indicating that the current move is not driven by panic but by more measured accumulation. The structure is constructive but incomplete.
A confirmed break and hold above $2,400 would likely open the path toward higher levels, potentially targeting the $2,700 region. Failure to break this resistance would keep ETH range-bound, with support near $2,100 remaining critical.
Featured image from ChatGPT, chart from TradingView.com
Editorial Process for bitcoinist is centered on delivering thoroughly researched, accurate, and unbiased content. We uphold strict sourcing standards, and each page undergoes diligent review by our team of top technology experts and seasoned editors. This process ensures the integrity, relevance, and value of our content for our readers.
Ethereum’s derivatives market on Binance is flashing a setup that could leave short sellers exposed if the recent move higher continues. According to analysis shared on X by CryptoQuant contributor Darkfost, positioning has become increasingly one-sided even as ETH has rebounded sharply from its February low, creating the conditions for further short squeezes.
Ethereum Bears Crowd In On Binance
The core of the argument is a mismatch between price action and trader conviction. Darkfost said that since February, around 350,000 ETH has been added to open interest on Binance, which now represents roughly 37% of total market share. At current prices, that amounts to more than $1 billion flowing into Binance’s ETH derivatives complex.
Related Reading
What stands out is not just the size of that increase, but the direction of positioning behind it. “What is paradoxical is that despite the recent price increase (+35% since the February low), the majority of investors appear to be positioning for a correction by shorting the market,” Darkfost wrote. “This can be observed through ETH funding rates on Binance, which have reached levels not seen since the previous bear market.”
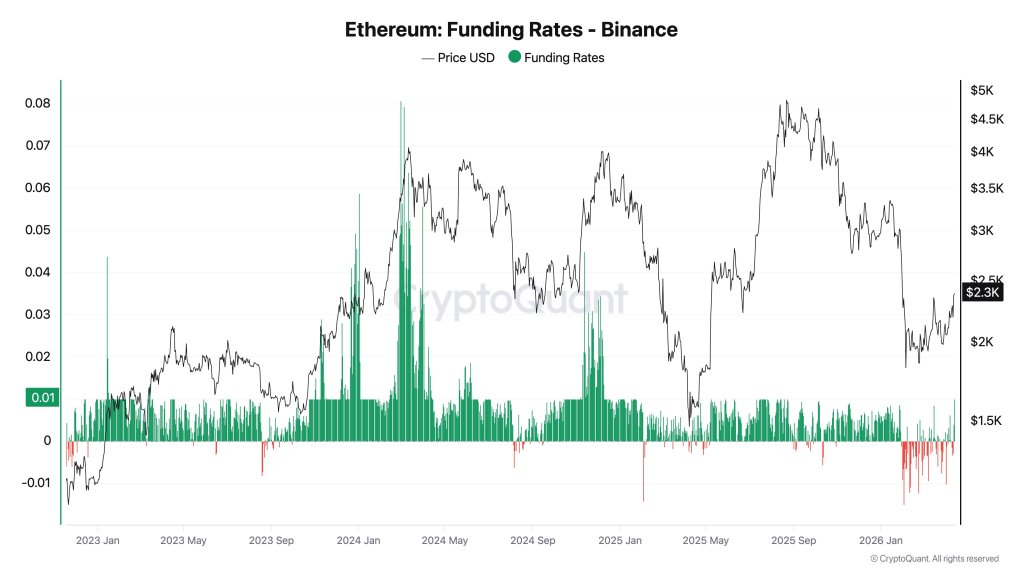
That matters because funding rates offer a read on which side of the perpetual futures market is leaning more aggressively. Darkfost said Binance funding has remained mostly negative since late January, suggesting traders have continued to pay to hold short exposure rather than chase the rebound. In other words, the move higher has not fully reset bearish conviction.
Related Reading
The post argues that this skepticism has now reached a level that is unusual even by recent standards. “Observing such negative levels, with funding rates dropping below -0.01%, is relatively rare and indicates a significant buildup of short positions while investors remain in disbelief,” Darkfost wrote. “When this level of consensus forms, it is not uncommon for the market to move against the majority, triggering liquidations of the most aggressive positions and leading to short squeeze events, like the one observed yesterday.”
That squeeze dynamic has already started to show up in the liquidation data. Darkfost noted that more than $3 million in short positions were liquidated twice within a single hour on Binance, a sign that even modest upside extensions are capable of forcing leveraged bears out of the market. In crowded setups, those forced exits can become self-reinforcing, as liquidations add incremental buy pressure and push price into the next pocket of vulnerable positions.
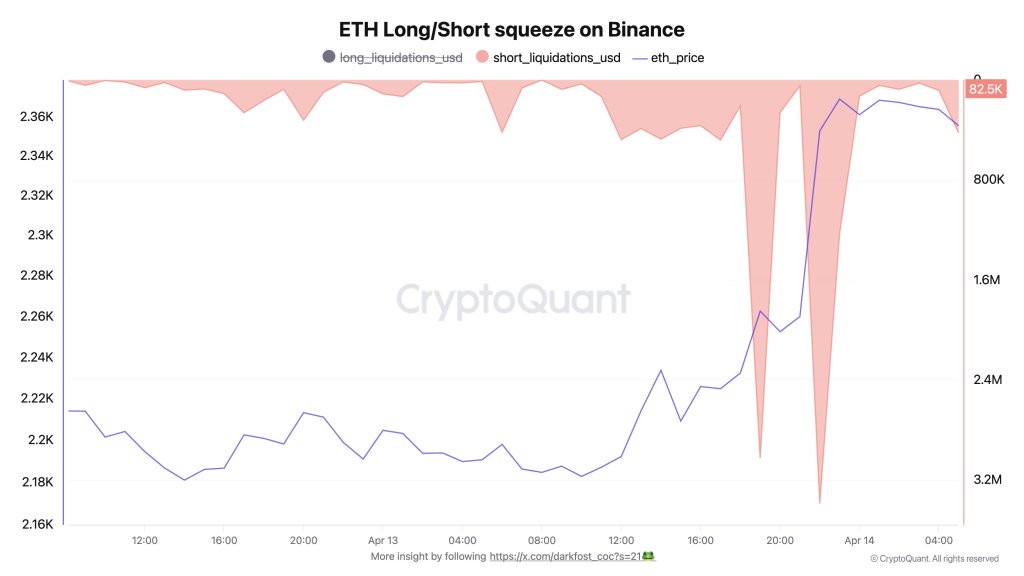
The broader implication is not necessarily that Ethereum is entering a straight-line rally, but that the derivatives structure has tilted in a way that can amplify upside if sentiment remains slow to adjust. Darkfost framed the recent rally as the “early phase of the uptrend,” arguing that months of short accumulation could continue to provide fuel if traders remain positioned for reversal rather than continuation.
There is, however, one important shift underway. Funding rates are now beginning to turn positive again, with Darkfost citing a reading around +0.01%, though the day’s data was not yet complete. If that change holds, the market structure would begin to look different: less driven by disbelief-fueled squeezes, and more by traders starting to align with the move.
For now, the message from Binance’s ETH derivatives market is fairly clear. Shorts have piled in aggressively, but the more crowded that trade becomes, the more fragile it is if Ethereum keeps grinding higher.
At press time, ETH traded at $2,318.
Featured image created with DALL.E, chart from TradingView.com
Cardano Price Forecast: On-chain data signals risk of deeper correction FXStreet
Source link ]]>
On-chain data signals risk of deeper correction for Cardano Invezz
Source link ]]>

- Ethereum price falls to $2,325 on profit-taking after rising to $2,416.
- The repeated rejection at $2,360–$2,400 resistance weakens the overall momentum.
- Breaking below the key support at $2,312 could send ETH toward $2,173.
After a rally that pushed Ethereum close to $2,416, things quickly changed, and now ETH sits around $2,325.
This sharp drop near $2,400 tells us a lot about where Ethereum’s headed next, at least for now.
Pushback at $2,416 resistance
Ethereum (ETH) initially surged about 10% in a sharp move that triggered liquidations and brought renewed attention to the token.
After reaching around $2,416, momentum slowed, and the price began to pull back.
In recent weeks, the $2,360–$2,400 range has consistently acted as a supply zone, with selling pressure emerging each time ETH approaches this level.
Broader market conditions have also softened. Data from CoinMarketCap shows that the total crypto market capitalisation has declined by about 1.12%, alongside a drop in trading volumes.
This suggests that traders who entered during the recent rally are taking profits, adding to near-term downward pressure on ETH.
Capital rotation adds pressure
Another factor weighing on Ethereum (ETH) is the ongoing shift in market positioning.
Bitcoin dominance has been trending higher, indicating that capital is rotating into Bitcoin rather than altcoins.
This typically reflects a more defensive stance among investors.
As the largest altcoin, Ethereum is often among the first to face pressure during such rotations.
Even with relatively stable fundamentals, reduced capital inflows can limit its ability to sustain upward price momentum.
This trend is also visible in the ETH/BTC ratio, which has struggled to stabilise.
A recovery in this ratio would be needed to signal renewed confidence in altcoins. Until then, Ethereum may continue to underperform Bitcoin in the near term.
$2,312 now a key battleground
Right now, $2,312 stands out as a key support level. It’s not just psychological; it’s close to the 14-day moving average and already served as the floor during the recent dip.

If the ETH price holds steady above $2,312, the door stays open for another run at $2,400.
But if $2,312 gives way, things will start to look different, and bears will pick up momentum as bulls pull back.
In that case, $2,173 will be the next spot to watch.
Dropping from $2,312 to $2,173 will be a 6% slide, which is pretty standard after a strong rally; it is not something wild or out of the ordinary. It’s a realistic scenario if support breaks.
If buyers can push the price above $2,416 and keep it there, that recent rejection fades away, and a rally starts to look more real.
The short-term picture looks a bit bearish, although we’re not seeing panic selling yet; just uncertainty.
Everything boils down to the $2,312 support level. If buyers hold it, there’s a chance for another run at resistance. If not, a 6% drop is on the table.
Key facts: Dogecoin $0.06/$0.03; thin Kumo; Google on quantum risk TradingView
Source link ]]>
Binance Forecasts Dogecoin (DOGE) at $0.218 for 2026 but Ali Martinez Warns of Triangle Breakout Risk openPR.com
Source link ]]>
Dogecoin USD Slides 1.91% as Neutral RSI Signals Consolidation Risk Meyka
Source link ]]>