Dogecoin price forms scary patterns as DOGE ETF drought continues crypto.news
Source link ]]>
A crypto analyst has called the bottom for Pepe (PEPE), the third-largest meme coin by market capitalization. According to the analyst, Pepe hit its lowest price point for this cycle after experiencing a scary market crash that wiped out most of its 2025 gains. Based on the Elliott Wave theory, Pepe’s price action shows it is entering Wave 3, which the analyst expects will be a bullish turnaround with a 594% promise.
Pepe Hits Market Bottom After Price Crash
On January 13, a crypto analyst known as ‘Slick’ announced that Pepe’s market bottom was officially in, signaling a potential turning point from a downtrend. The analyst shared a detailed chart on X (formerly Twitter), analyzing Pepe’s price movement while focusing on wave patterns and Exponential Moving Averages (EMA).
Related Reading
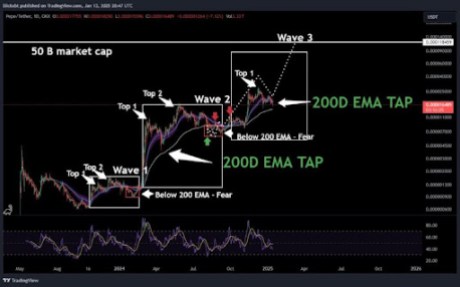
The chart divides Pepe’s price action into three waves: 1, 2, and 3. Wave 1 marks an initial rise in Pepe’s price, during which two local tops were achieved. The next phase, Wave 2, highlights two local tops and a corrective period that retraces below the 200-day EMA.
Based on Pepe’s price movements, Slick expects the meme coin to enter Wave 3 soon. He anticipates that this wave could trigger a significant move upwards. Moreover, the analyst pinpoints the 200-day EMA at a critical support level, where each time Pepe’s price corrects to this support, it is labeled as a “fear phase,” underscoring broader market uncertainty.
The two tops pinpointed in Waves 1 and 2 are peaks that mark interim resistance points before a price correction. The Top 1 signals the end of a brief price rally, while the Top 2 showcases a rise to a secondary resistance level.
Interestingly, the analyst has acknowledged that his projection of Pepe’s bottom comes with a 70% certainty. This forecast also aligns with Pepe’s recent massive price crash to new lows. According to data from CoinMarketCap, Pepe experienced a scary decline that eliminated over 26.45% of its value over the past month.
The cryptocurrency is still on a significantly bearish trend, dropping by another 16.20% in the last seven days. Pepe is currently experiencing similar volatility and bearish conditions to most meme coins in the market. Top dogs like Dogecoin and Shiba Inu have fallen by 12.5% and 11.2%, respectively, this past week.
Analyst Forecasts 594% Pepe Price Rally
While commenting on Pepe’s bearish performance and potential market bottom, Slick also presented a silver lining, predicting that a rebound could soon occur. The analyst has set a price and market cap target for Pepe, confidently projecting that the frog-themed meme coin could rise to a 50 billion market capitalization, followed by a significant surge in value.
Related Reading
The dotted lines in the price chart indicate the speculative future price action leading to Wave 3. Unlike Waves 1 and 2, which recorded two tops, Wave 3 has only experienced one local top, followed by a decline to the 200-day EMA.
Slick believes that Pepe could experience similar price movements with past waves, where it would reach two local tops before a significant price correction. The analyst has projected that the top 2 in Pepe’s Wave 3 would drive its price as high as 594% to a new bullish target of $0.000118 from its current market price of $0.000017.
Featured image created with Dall.E, chart from Tradingview.com
Cardano’s Scary September Secret: Here’s What ADA Community Should Be Ready For U.Today
Source link ]]>
Dogecoin Creator Names Investments That Are ‘Less Exciting and Scary’ Than Crypto U.Today
Source link ]]>
Data shows the Bitcoin market sentiment has remained deep in extreme fear this week as broader financial markets also get fearful.
Bitcoin Fear And Greed Index Shows A Value Of 12 This Week
As per the latest weekly report from Arcane Research, the wider financial market is at its highest level of fear since the COVID crash in 2020.
The “fear and greed index” is an indicator that tells us about the general market sentiment among Bitcoin investors right now.
The metric displays this sentiment using a numeric scale that runs from one to hundred. All values of the index above “50” imply a sentiment of greed, while all those below the cutoff indicate a fearful market.
When the indicator has values towards the end of the range, that is, above 75 or below 25, the market is in a state of extreme greed or extreme fear.
Some investors believe that it’s best to buy when the market is extremely fearful as bottoms have historically tended to happen during such periods.
Similarly, tops have formed in the past while the market has gone through extreme greed so such times may be ideal for selling.
Related Reading | Bitcoin Whale Breaks 8 Year Long Silence With $30 Million Worth Of BTC Transfer
Contrarian investing is a trading technique that follows this idea. To quote Warren Buffet, “Be fearful when others are greedy, and greedy when others are fearful.”
Now, here is a chart that shows the trend in the Bitcoin fear and greed index over the past year:
Looks like the sentiment in the market has plummeted recently | Source: Arcane Research's The Weekly Update - Week 19, 2022
As you can see in the above graph, the Bitcoin fear and greed index has a value of 12 at the moment, indicating a sentiment of extreme fear.
The crypto market isn’t the only one scared, the broader financial markets have also been in a state of extreme fear for a while now.
Related Reading | Bitcoin Marks Seven Consecutive Red Candles, Paints Gruesome Picture For Market
The market has been observing the highest extreme fear values since the crash back in 2022 due to the onset of COVID-19.
Currently, it’s unclear if the sentiment has bottomed out or if Bitcoin will bleed more in the coming days, plunging the fear and greed index further.
BTC Price
At the time of writing, Bitcoin’s price floats around $30.4k, down 3% in the last seven days. Over the past month, the crypto has lost 24% in value.
The below chart shows the trend in the price of the coin over the last five days.

It seems like the price of the coin has been moving sideways in the last few days | Source: BTCUSD on TradingView
Featured image from Unsplash.com, charts from TradingView.com, Arcane Research
**NEW CRYPTO GIVEAWAY**
We’re giving away 5 ETH when the Bitsquad community breaks 5 million total across all platforms!  https://gleam.io/QoxHy/5-eth-to-5-million-giveaway
ByBit, Market Cipher, Ledger, TokenMetrics, Crypto.com & more!
Find deals on hardware wallets, trading indicators, exchanges & more.
Find Crypto DEALS https://bitboycrypto.com/deals
Connect with Me & the BitSquad!
Join the BitSquad http://t.me/BitSquad
Join the BitBoy Lab https://discord.com/invite/bitboylab
Join BitSquad Traders http://t.me/BitSquadTraders
Join Me on Twitter https://twitter.com/Bitboy_Crypto
Join Me on Instagram https://www.instagram.com/bitboy_crypto
Join Me on TikTok https://www.tiktok.com/@BitBoyCrypto
Join Me on Twitch https://www.twitch.tv/bitboy_crypto
Join Me on Theta https://www.theta.tv/bitboycrypto
All of our videos are strictly personal opinions. Please make sure to do your own research. Never take one person’s opinion for financial guidance. There are multiple strategies and not all strategies fit all people. Our videos ARE NOT financial advice.
source