Bitcoin price started a sharp decline from well above $72,000. BTC is now consolidating and might extend losses unless there is a close above $70,000.
- Bitcoin started a sharp decline below $71,200 and $70,500.
- The price is trading below $70,500 and the 100 hourly simple moving average.
- There is a bearish trend line forming with resistance at $69,200 on the hourly chart of the BTC/USD pair (data feed from Kraken).
- The pair might continue to decline if it stays below the $69,200 and $70,000 levels.
Bitcoin Price Dips Further
Bitcoin price started a sharp decline from well above $72,000. BTC declined below $71,200 and $70,000 to enter a short-term bearish zone.
The bears even pushed the price below $69,500. There was a move toward $67,500. A low was formed at $67,343, and the pair is now consolidating losses. There was a minor upward move above $68,000, but the price stayed well below the 23.6% Fib retracement level of the downward move from the $75,999 swing high to the $67,343 low.
Bitcoin is now trading below $70,000 and the 100 hourly simple moving average. Besides, there is a bearish trend line forming with resistance at $69,200 on the hourly chart of the BTC/USD pair.
If the price remains stable above $68,000, it could attempt a fresh increase. Immediate resistance is near the $69,000 level. The first key resistance is near the $69,200 level and the trend line. A close above the $69,200 resistance might send the price further higher.
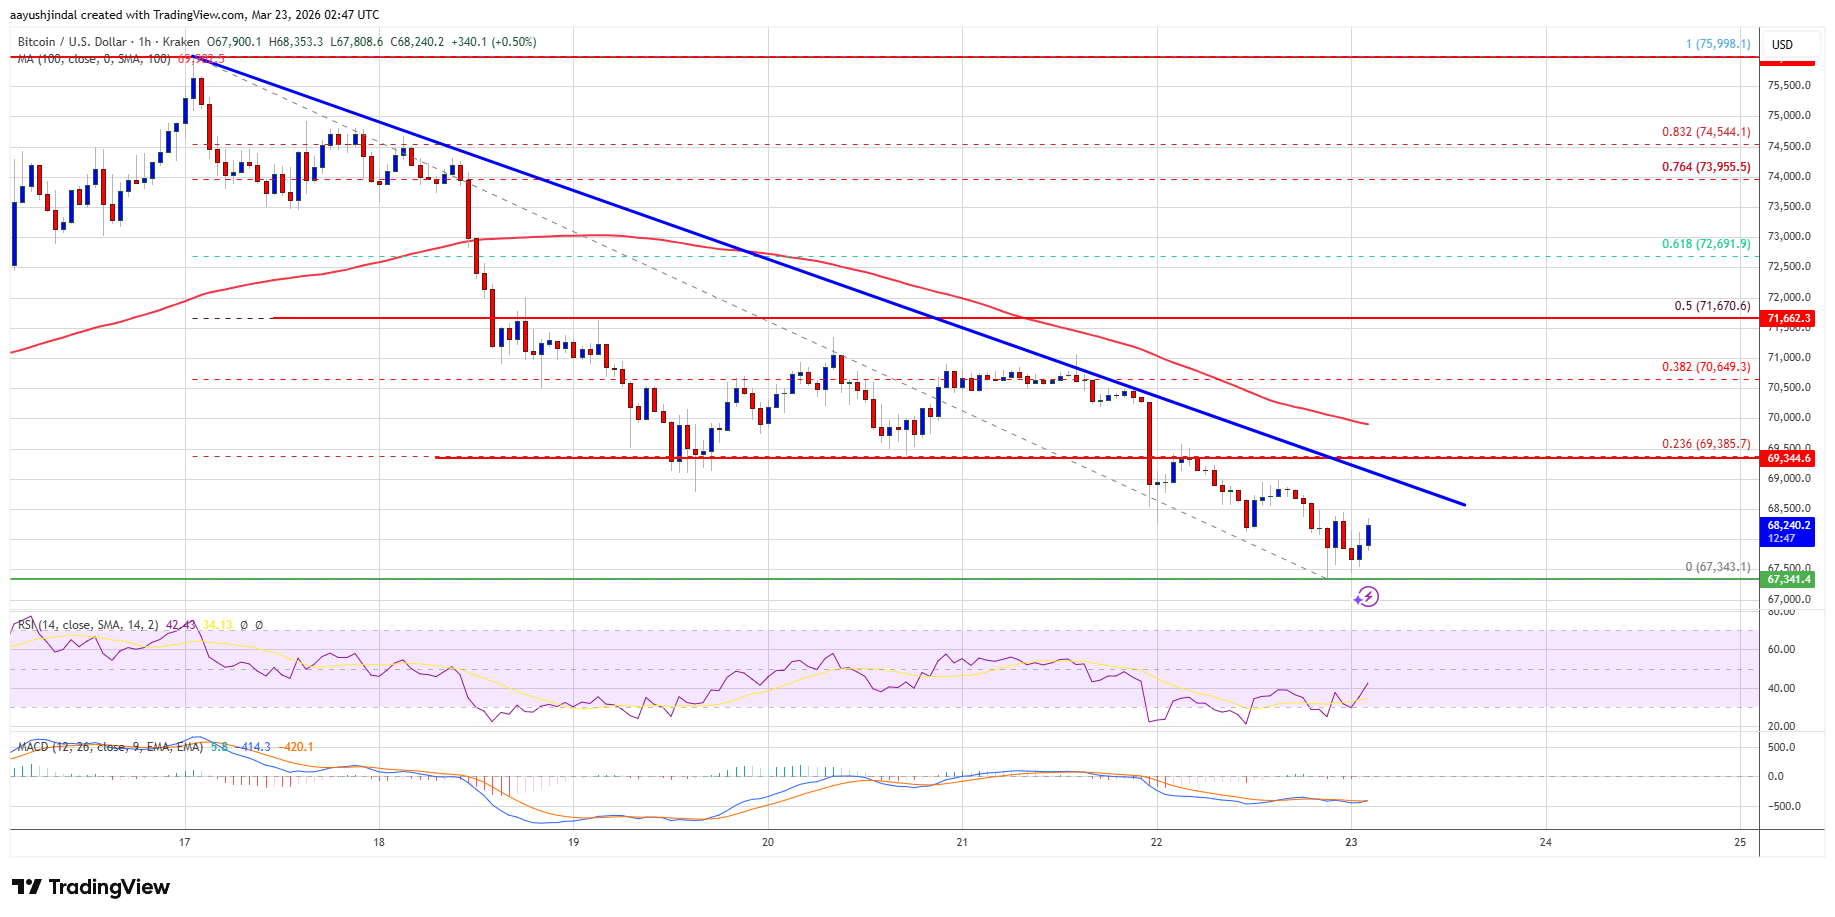
In the stated case, the price could rise and test the $70,000 resistance. Any more gains might send the price toward the $71,650 level or the 50% Fib retracement level of the downward move from the $75,999 swing high to the $67,343 low. The next barrier for the bulls could be $72,800.
Downside Extension In BTC?
If Bitcoin fails to rise above the $70,000 resistance zone, it could start another decline. Immediate support is near the $68,000 level. The first major support is near the $67,250 level.
The next support is now near the $66,500 zone. Any more losses might send the price toward the $65,000 support in the near term. The main support now sits at $63,500, below which BTC might struggle to recover in the near term.
Technical indicators:
Hourly MACD – The MACD is now gaining pace in the bearish zone.
Hourly RSI (Relative Strength Index) – The RSI for BTC/USD is now below the 50 level.
Major Support Levels – $68,000, followed by $67,250.
Major Resistance Levels – $69,200 and $70,000.
Bitcoin price started a fresh decline below $68,500 and $68,000. BTC is now consolidating and might struggle to start a recovery wave above $68,500.
- Bitcoin started a fresh decline after it settled above the $69,500 zone.
- The price is trading below $68,000 and the 100 hourly simple moving average.
- There was a break below a major bullish trend line with support at $68,900 on the hourly chart of the BTC/USD pair (data feed from Kraken).
- The pair might dip again if it trades below the $65,500 and $65,000 levels.
Bitcoin Price Starts Another Decline
Bitcoin price failed to extend its increase above the $68,500 zone. BTC started a fresh decline after it settled below the $68,000 support zone.
The bears pushed the price below $67,500 and $67,200. Besides, there was a break below a major bullish trend line with support at $68,900 on the hourly chart of the BTC/USD pair. Finally, the price tested the $65,500 zone. A low was formed at $65,646, and the price is now consolidating losses.
Bitcoin is now trading below $68,000 and the 100 hourly simple moving average. If the price remains stable above $65,500, it could attempt a fresh increase. Immediate resistance is near the $67,000 level. The first key resistance is near the $67,600 level and the 23.6% Fib retracement level of the downward move from the $74,062 swing high to the $65,646 low.
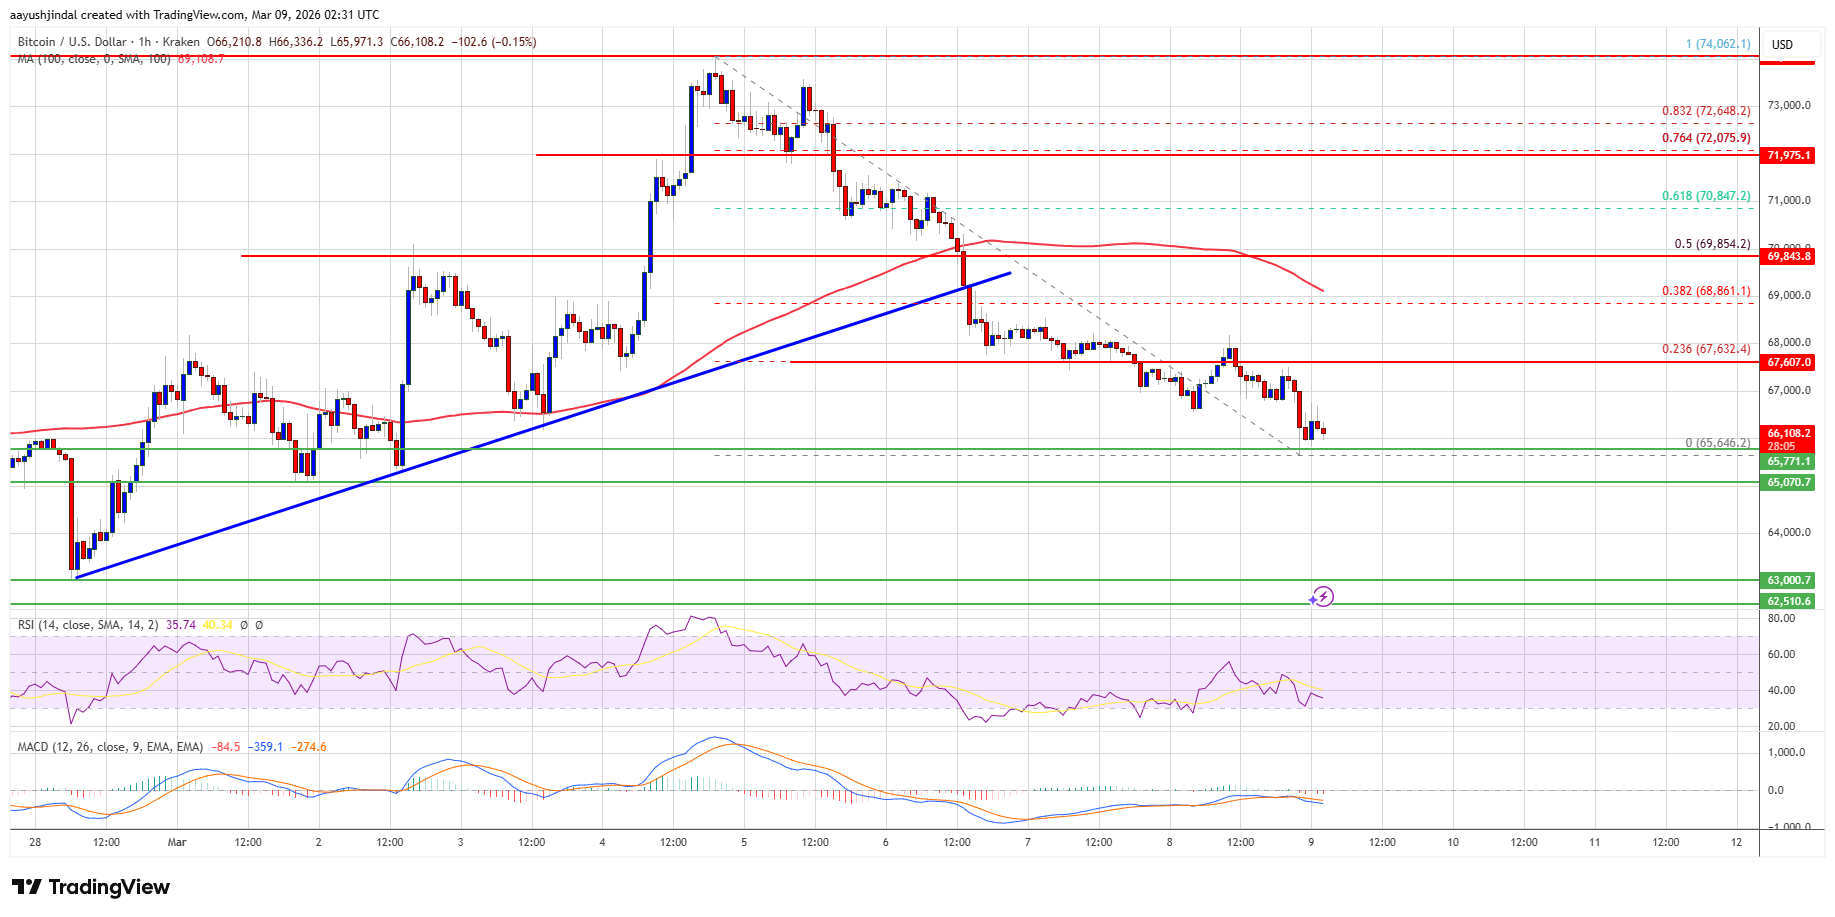
A close above the $67,600 resistance might send the price further higher. In the stated case, the price could rise and test the $68,800 resistance. Any more gains might send the price toward the $68,800 level. The next barrier for the bulls could be $69,850 or the 50% Fib retracement level of the downward move from the $74,062 swing high to the $65,646 low.
More Losses In BTC?
If Bitcoin fails to rise above the $68,000 resistance zone, it could start another decline. Immediate support is near the $65,500 level. The first major support is near the $65,000 level.
The next support is now near the $63,500 zone. Any more losses might send the price toward the $62,000 support in the near term. The main support now sits at $61,200, below which BTC might struggle to recover in the near term.
Technical indicators:
Hourly MACD – The MACD is now gaining pace in the bearish zone.
Hourly RSI (Relative Strength Index) – The RSI for BTC/USD is now below the 50 level.
Major Support Levels – $65,500, followed by $65,000.
Major Resistance Levels – $68,000 and $68,800.
The first federally chartered crypto bank in the United States, Anchorage Digital, has announced its current holdings of Strategy perpetual preferred stock STRC. This news comes as the MSTR stock continues to drop in price. Anchorage Buys Into Strategy’s STRC Stock The crypto bank announced its holdings of Strategy perpetual preferred stock on its balance
The post First Crypto Bank Anchorage Adds Strategy’s STRC Stock to Portfolio as MSTR Value Sinks appeared first on CoinGape.
]]>Bitcoin’s recent wobble has traders on edge, but the picture is not all one-way. Reports note heavy losses for late buyers, and on-chain figures show real money changing hands as positions are forced closed. Markets moved fast; the mood did too.
Related Reading
Fear And Greed Plunges To Single Digits
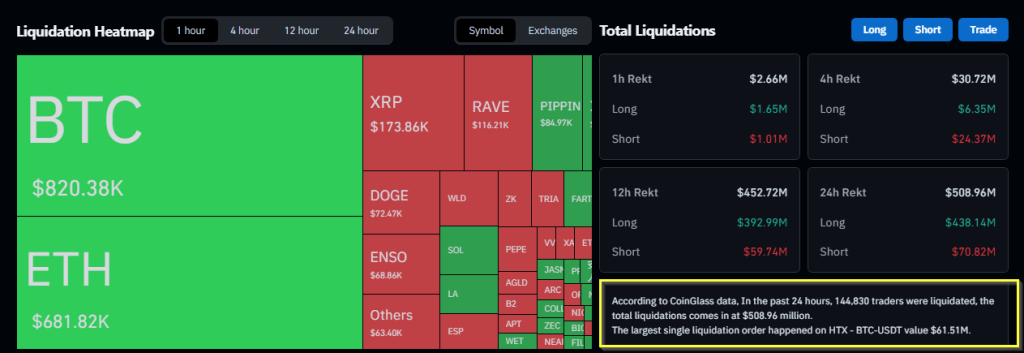
According to CoinGlass, more than 144,839 traders were liquidated in the last 24 hours, with total liquidations of over $508 million and about 92% tied to long bets.
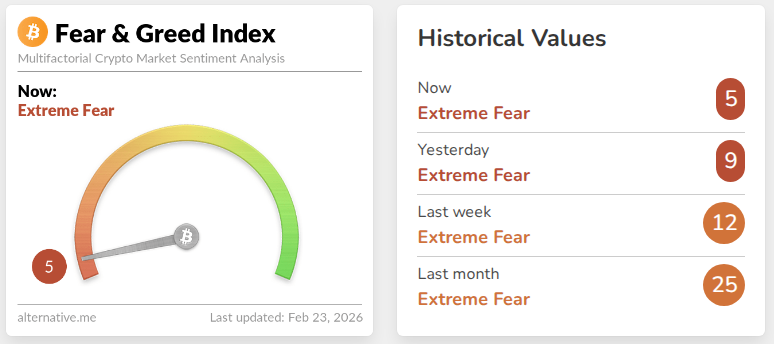
Reports from Alternative.me put the Crypto Fear and Greed Index at 5 out of 100 — a reading that has turned up only three times since 2018.
That level screams panic. Yet panic often clears out the most fragile holders and leaves room for steadier hands to step in.
Realized Losses And Capitulation Signals
Based on reports from Glassnode, recent investors are still booking losses at a high rate — the seven-day moving average for net realized losses was close to $500 million per day.
That kind of selling pressure looks brutal on a chart. At the same time, selling at scale can mark an end to a sharp phase of decline, because it reduces the number of people left to sell when prices fall further.
Bitcoin Price Action
In the middle of all this, price moves matter. Bitcoin rose to roughly $68,600 on Saturday, but it slid back and touched the mid-$64,000s after a wave of exits.
Traders are watching a range that formed after the early-February drop to about $60,000. The coin remains roughly 48% below an October high of $126,000 and about 5.5% under the 2021 peak near $69,000.
News tied to US-Iran tension and general risk-off trading pushed some traders toward safer assets, which added fuel to the pullback.
Sharpe Ratio Hits Unusual Low
Analyst Michaël van de Poppe shared a chart showing Bitcoin’s Sharpe Ratio at -38.4. That metric measures returns relative to risk; a number this low is rare.
This is a phenomenal chart.
It shows the Sharpe Ratio for #Bitcoin in the short term.
The key takeaway: the Sharpe Ratio has dropped to -38.38, which historically has marked “Low Risk” accumulation zones. The red circles highlight every time the Sharpe Ratio dipped to similar… pic.twitter.com/Nwp7SkfVP4
— Michaël van de Poppe (@CryptoMichNL) February 21, 2026
Historically, extreme negative readings have sometimes lined up with moments when buying risk felt lower, because potential downside had been squeezed out by big selloffs.
That does not guarantee a rebound, but it changes how investors view the trade-off between reward and risk.
Related Reading
Where This Could Lead
Some technical watchers warn that more tests of support could happen if uncertainty continues. Others point to the combination of heavy liquidations, deep fear readings, and large realized losses as signals that a base might be forming.
Pasts on-chain figures show that panic and steep losses often precede quieter periods where buyers return slowly.
Featured image from Unsplash, chart from TradingView
Bitcoin price failed to stay above $66,000 and dipped further. BTC is now consolidating losses and might struggle to recover above $66,000.
- Bitcoin started a fresh decline and traded below the $66,000 support.
- The price is trading below $65,500 and the 100 hourly simple moving average.
- There is a bearish trend line forming with resistance at $66,800 on the hourly chart of the BTC/USD pair (data feed from Kraken).
- The pair might dip again if it trades below the $63,500 and $63,200 levels.
Bitcoin Price Breaks Key Support
Bitcoin price failed to remain stable above the $66,500 zone. BTC started a fresh decline and traded below the $66,000 support zone. There was a push below $65,000.
The price even spiked below $64,000. A low was formed at $63,351, and the price is now correcting some losses. There was a move above $64,000, but the price is still well below the 23.6% Fib retracement level of the recent decline from the $68,652 swing high to the $63,351 low.
Bitcoin is now trading below $66,000 and the 100 hourly simple moving average. If the price remains stable above $64,000, it could attempt a fresh increase. Immediate resistance is near the $64,600 level.
The first key resistance is near the $65,250 level. A close above the $65,250 resistance might send the price further higher. In the stated case, the price could rise and test the $66,000 resistance or the 50% Fib retracement level of the recent decline from the $68,652 swing high to the $63,351 low.
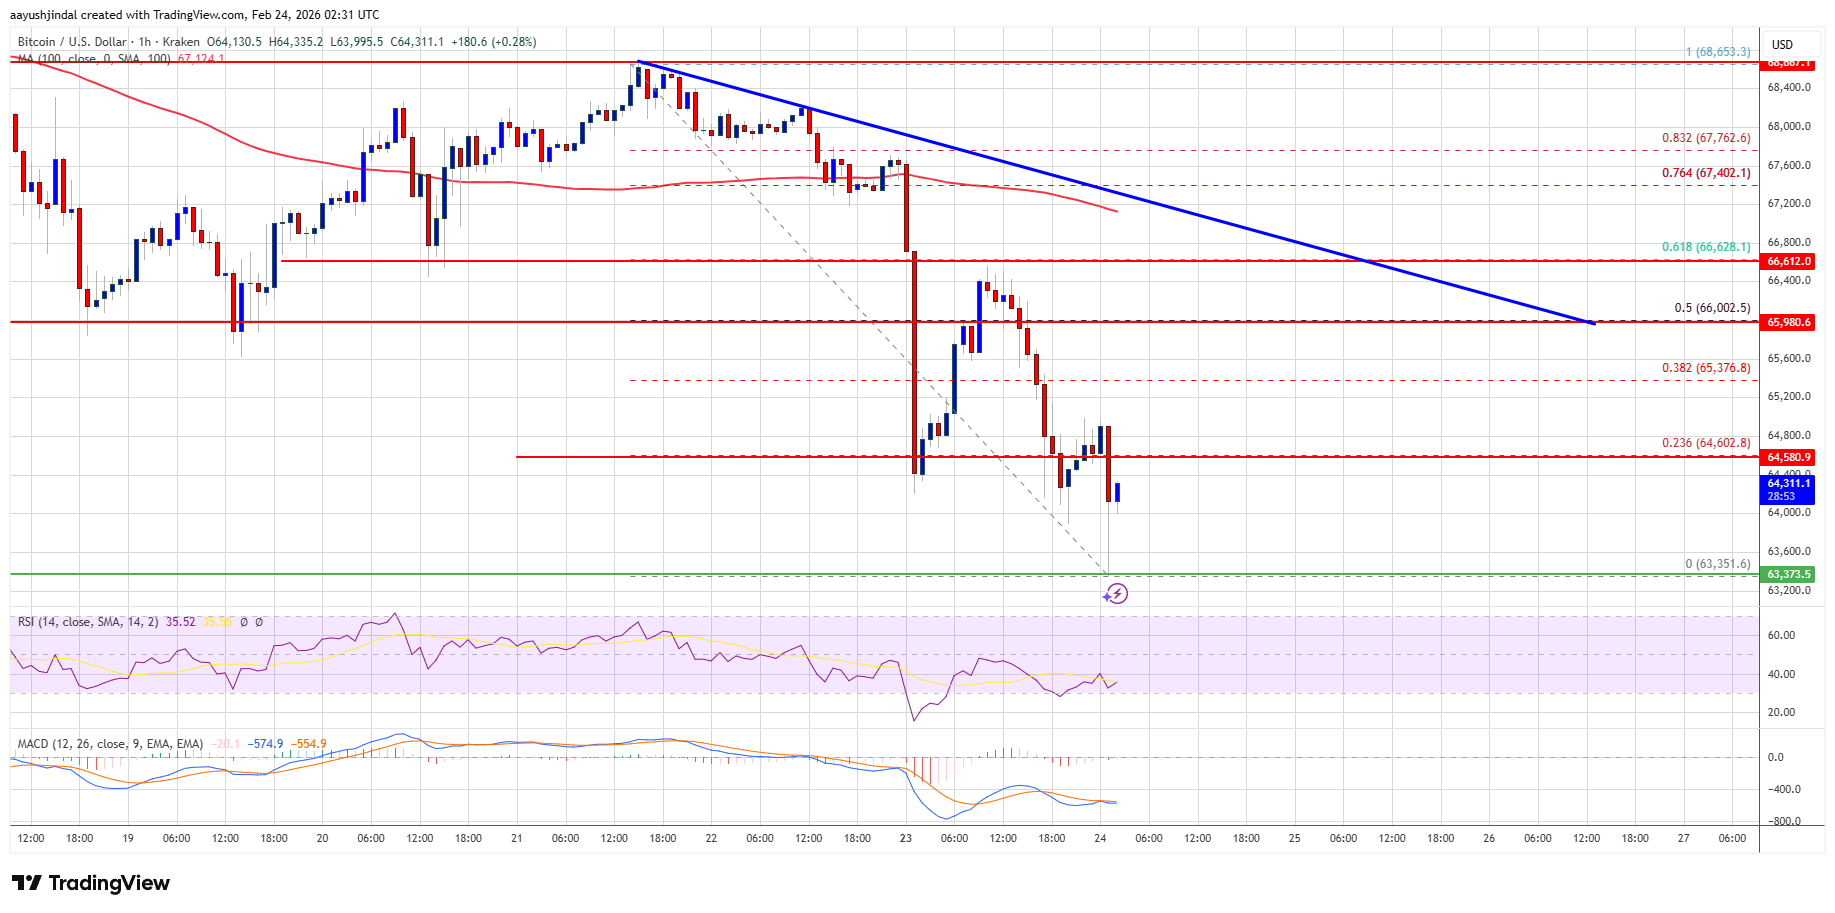
Any more gains might send the price toward the $66,800 level. There is also a bearish trend line forming with resistance at $66,800 on the hourly chart of the BTC/USD pair. The next barrier for the bulls could be $67,500 and $67,700.
Another Decline In BTC?
If Bitcoin fails to rise above the $65,250 resistance zone, it could start another decline. Immediate support is near the $64,000 level. The first major support is near the $63,500 level.
The next support is now near the $63,200 zone. Any more losses might send the price toward the $62,650 support in the near term. The main support now sits at $62,000, below which BTC might struggle to recover in the near term.
Technical indicators:
Hourly MACD – The MACD is now gaining pace in the bearish zone.
Hourly RSI (Relative Strength Index) – The RSI for BTC/USD is now below the 50 level.
Major Support Levels – $64,000, followed by $63,500.
Major Resistance Levels – $65,000 and $66,000.
Aayush Jindal, a luminary in the world of financial markets, whose expertise spans over 15 illustrious years in the realms of Forex and cryptocurrency trading. Renowned for his unparalleled proficiency in providing technical analysis, Aayush is a trusted advisor and senior market expert to investors worldwide, guiding them through the intricate landscapes of modern finance with his keen insights and astute chart analysis.
From a young age, Aayush exhibited a natural aptitude for deciphering complex systems and unraveling patterns. Fueled by an insatiable curiosity for understanding market dynamics, he embarked on a journey that would lead him to become one of the foremost authorities in the fields of Forex and crypto trading. With a meticulous eye for detail and an unwavering commitment to excellence, Aayush honed his craft over the years, mastering the art of technical analysis and chart interpretation.
As a software engineer, Aayush harnesses the power of technology to optimize trading strategies and develop innovative solutions for navigating the volatile waters of financial markets. His background in software engineering has equipped him with a unique skill set, enabling him to leverage cutting-edge tools and algorithms to gain a competitive edge in an ever-evolving landscape.
In addition to his roles in finance and technology, Aayush serves as the director of a prestigious IT company, where he spearheads initiatives aimed at driving digital innovation and transformation. Under his visionary leadership, the company has flourished, cementing its position as a leader in the tech industry and paving the way for groundbreaking advancements in software development and IT solutions.
Despite his demanding professional commitments, Aayush is a firm believer in the importance of work-life balance. An avid traveler and adventurer, he finds solace in exploring new destinations, immersing himself in different cultures, and forging lasting memories along the way. Whether he’s trekking through the Himalayas, diving in the azure waters of the Maldives, or experiencing the vibrant energy of bustling metropolises, Aayush embraces every opportunity to broaden his horizons and create unforgettable experiences.
Aayush’s journey to success is marked by a relentless pursuit of excellence and a steadfast commitment to continuous learning and growth. His academic achievements are a testament to his dedication and passion for excellence, having completed his software engineering with honors and excelling in every department.
At his core, Aayush is driven by a profound passion for analyzing markets and uncovering profitable opportunities amidst volatility. Whether he’s poring over price charts, identifying key support and resistance levels, or providing insightful analysis to his clients and followers, Aayush’s unwavering dedication to his craft sets him apart as a true industry leader and a beacon of inspiration to aspiring traders around the globe.
In a world where uncertainty reigns supreme, Aayush Jindal stands as a guiding light, illuminating the path to financial success with his unparalleled expertise, unwavering integrity, and boundless enthusiasm for the markets.
Since reaching its current all-time-high price of $126,000 in October last year, the Bitcoin market has been on a sell-off, translating into surmounting bear pressure. As a result, the flagship cryptocurrency has maintained a steady decline, falling until it recently reached $60,000 — a deviation of more than 52% from its all-time high.
Bitcoin currently seems to be seeing a rebound, but price action alone reflects that it could as well be one of its short-term recoveries. Interestingly, a recent on-chain evaluation suggests that the current upward movement may be driven by a significant underlying metric.
What The Bitcoin Sharpe Ratio Is Saying
In a Quicktake post on CryptoQuant, Darkfost reveals that the Bitcoin Sharpe Ratio is now at a zone historically relevant to the ends of bear markets.
The Sharpe Ratio is a risk-adjusted performance metric that measures how much return an asset (Bitcoin, in this case) generates for risk taken. A high ratio signals that returns are strong in relation to risks taken; a declining ratio, on the other hand, reflects weakening returns, while risk remains elevated. On the severe end of the metric, a very low or negative Sharpe Ratio is a sign that market participants are taking very high risks for poor or negative returns. It is worth noting that very low Sharpe ratios are frequently seen during deep bear markets or even capitulation phases.

According to historical data, Darkfost explains that the Sharpe Ratio is currently at a level so low as to be reminiscent of the final phases of past bear markets. This means that the Bitcoin price holds a higher practical risk, compared to returns, for current investors. Notably, the Sharpe ratio is not just at a low point, but continues in a steady state of decline. This, according to the market quant, is a sign that Bitcoin’s performance is yet to be attractive to any willing risk-taker.
However, it is this specific dynamic that sets the pace for a turnaround in Bitcoin’s price. This is because sustained poor returns typically force capitulation events, where weaker hands are flushed out; this eventually sets the stage for renewed accumulation among stronger hands.
Two Main Approaches To Consider In This Scenario: Analyst
Seeing as the current market condition is still mostly uncertain, Darkfost offers two ways to engage the current scenario. First, the analyst states that investors could begin increasing exposure gradually, and in line with the ratio’s movement towards lower risk zones.
Second, Darkfost explains that a market participant could decide to wait for clear improvements in the Sharpe Ratio before entering the market at all. This is to serve as a confirmation strategy for the purpose of investor safety.
However, Darkfost notes that the present bear phase could last a couple more months before any true reversal is seen, regardless of the signal being flashed by the Sharpe Ratio. As of this writing, Bitcoin stands at a $69,064 valuation. CoinMarketCap data reflects a 1.71% loss over the past day.
]]>Aayush Jindal, a luminary in the world of financial markets, whose expertise spans over 15 illustrious years in the realms of Forex and cryptocurrency trading. Renowned for his unparalleled proficiency in providing technical analysis, Aayush is a trusted advisor and senior market expert to investors worldwide, guiding them through the intricate landscapes of modern finance with his keen insights and astute chart analysis.
From a young age, Aayush exhibited a natural aptitude for deciphering complex systems and unraveling patterns. Fueled by an insatiable curiosity for understanding market dynamics, he embarked on a journey that would lead him to become one of the foremost authorities in the fields of Forex and crypto trading. With a meticulous eye for detail and an unwavering commitment to excellence, Aayush honed his craft over the years, mastering the art of technical analysis and chart interpretation.
As a software engineer, Aayush harnesses the power of technology to optimize trading strategies and develop innovative solutions for navigating the volatile waters of financial markets. His background in software engineering has equipped him with a unique skill set, enabling him to leverage cutting-edge tools and algorithms to gain a competitive edge in an ever-evolving landscape.
In addition to his roles in finance and technology, Aayush serves as the director of a prestigious IT company, where he spearheads initiatives aimed at driving digital innovation and transformation. Under his visionary leadership, the company has flourished, cementing its position as a leader in the tech industry and paving the way for groundbreaking advancements in software development and IT solutions.
Despite his demanding professional commitments, Aayush is a firm believer in the importance of work-life balance. An avid traveler and adventurer, he finds solace in exploring new destinations, immersing himself in different cultures, and forging lasting memories along the way. Whether he’s trekking through the Himalayas, diving in the azure waters of the Maldives, or experiencing the vibrant energy of bustling metropolises, Aayush embraces every opportunity to broaden his horizons and create unforgettable experiences.
Aayush’s journey to success is marked by a relentless pursuit of excellence and a steadfast commitment to continuous learning and growth. His academic achievements are a testament to his dedication and passion for excellence, having completed his software engineering with honors and excelling in every department.
At his core, Aayush is driven by a profound passion for analyzing markets and uncovering profitable opportunities amidst volatility. Whether he’s poring over price charts, identifying key support and resistance levels, or providing insightful analysis to his clients and followers, Aayush’s unwavering dedication to his craft sets him apart as a true industry leader and a beacon of inspiration to aspiring traders around the globe.
In a world where uncertainty reigns supreme, Aayush Jindal stands as a guiding light, illuminating the path to financial success with his unparalleled expertise, unwavering integrity, and boundless enthusiasm for the markets.
Dogecoin Sinks By 10% WoW Over Weak Altcoin Sentiment MarketForces Africa
Source link ]]>
Ethereum price extended losses and traded below the $2,865 zone. ETH is now consolidating losses and might aim for a recovery if it clears $2,920.
- Ethereum remained in a bearish zone and traded below $2,950.
- The price is trading below $2,900 and the 100-hourly Simple Moving Average.
- There is a bearish trend line forming with resistance at $2,920 on the hourly chart of ETH/USD (data feed via Kraken).
- The pair could start a fresh increase if it stays above the $2,800 zone.
Ethereum Price Dips Further
Ethereum price failed to remain stable above $2,950 and extended losses, like Bitcoin. ETH price declined below $2,880 and $2,865 to enter a bearish zone.
The bears even pushed the price below $2,840. The price finally tested $2,800 and is currently consolidating losses. There was a minor upside above the 23.6% Fib retracement level of the downward wave from the $3,067 swing high to the $2,784 swing low.
Ethereum price is now trading below $2,900 and the 100-hourly Simple Moving Average. If the bulls can protect more losses below $2,800, the price could attempt another increase.
Immediate resistance is seen near the $2,920 level. There is also a bearish trend line forming with resistance at $2,920 on the hourly chart of ETH/USD. The first key resistance is near the $2,960 level or the 61.8% Fib retracement level of the downward wave from the $3,067 swing high to the $2,784 swing low. The next major resistance is near the $3,000 level. A clear move above the $3,000 resistance might send the price toward the $3,065 resistance.
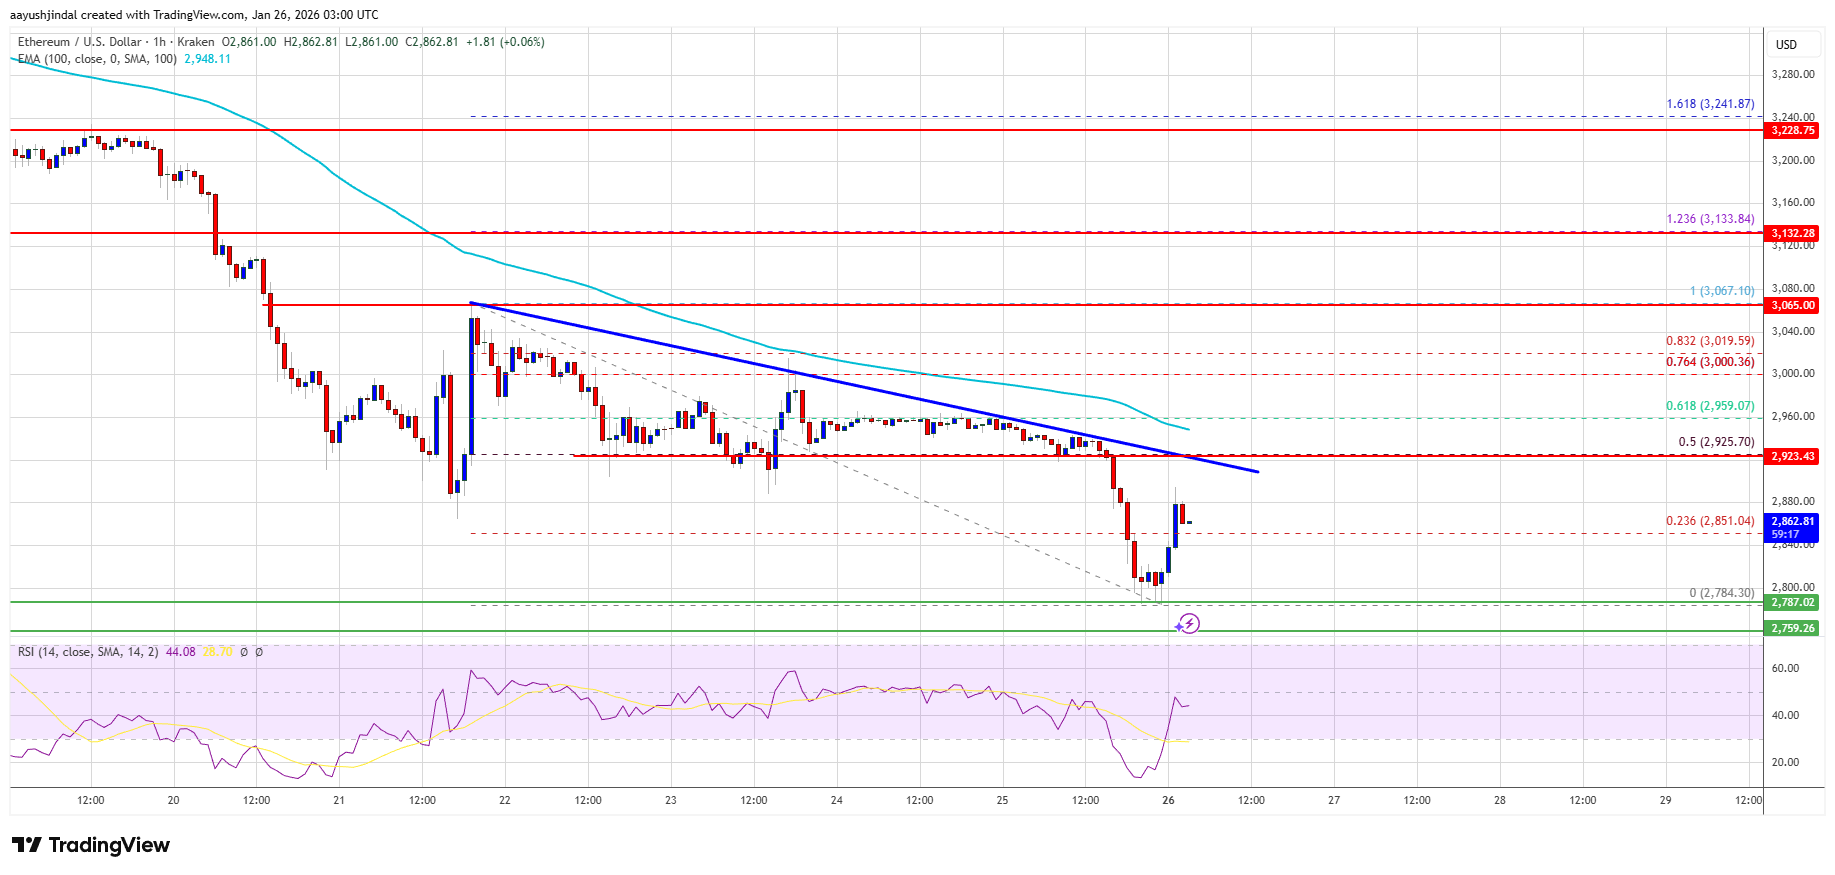
An upside break above the $3,065 region might call for more gains in the coming days. In the stated case, Ether could rise toward the $3,120 resistance zone or even $3,150 in the near term.
More Losses In ETH?
If Ethereum fails to clear the $2,920 resistance, it could start a fresh decline. Initial support on the downside is near the $2,840 level. The first major support sits near the $2,800 zone.
A clear move below the $2,800 support might push the price toward the $2,780 support. Any more losses might send the price toward the $2,720 region. The main support could be $2,650.
Technical Indicators
Hourly MACD – The MACD for ETH/USD is losing momentum in the bearish zone.
Hourly RSI – The RSI for ETH/USD is now below the 50 zone.
Major Support Level – $2,800
Major Resistance Level – $2,920