Cardano Price Prediction: ADA Stalls Even as Stablecoin Volume Smashes $1.8 Trillion Record While Pepeto Builds the Exchange That Profits From All of It CoinCentral
Source link ]]>
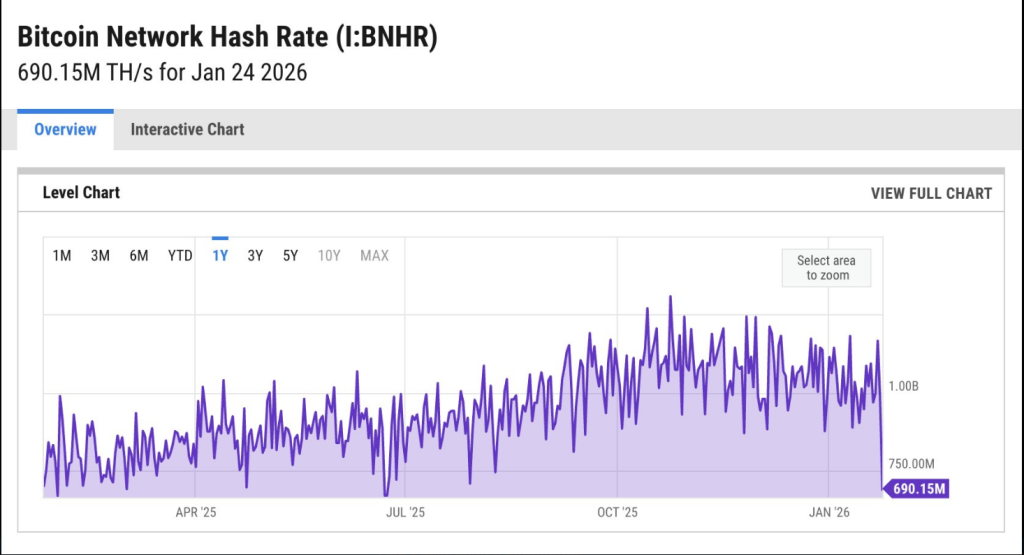
A fierce winter storm that swept much of the US over the weekend forced large parts of the Bitcoin mining fleet to cut power, leaving the network much weaker for a short time.
Related Reading
Reports say power outages and extreme weather pushed some operators to pause or slow their rigs so local grids could breathe. The result was a dramatic, though temporary, fall in the total mining power securing the blockchain.
Miners Adjust Power Use
According to mining operators on the ground, the pause was intentional. Many farms turned down machines to reduce strain on regional utilities when demand spiked and generation dropped.
Abundant Mines, a crypto mining firm headquartered in Oregon, said roughly 40% of global mining capacity went offline in a 24-hour window. That kind of quick scaling back is possible because miners can shut down and restart hardware rapidly, which in some regions acts like a big, flexible electrical load that can be trimmed when needed.
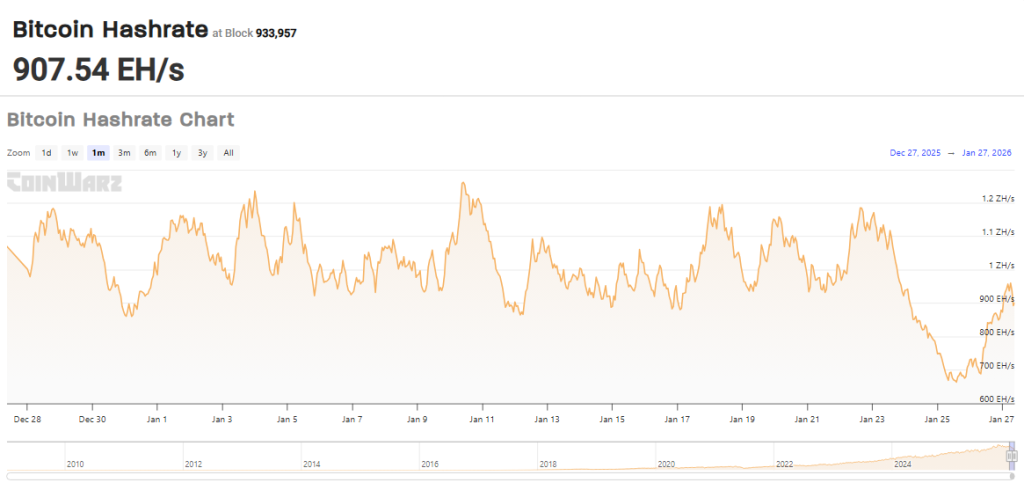
Bitcoin Hashrate Just Dropped Below 700 EH/s
The likely cause: the winter storm impacting Texas & the southeast, where a large share of US mining happens. Power outages and voluntary grid-stabilization measures have taken miners offline.
What this means:
– Fewer miners online… pic.twitter.com/j0lv7bU9JN— Abundant Mines (@AbundantMines) January 25, 2026
Hashrate Drop And Quick Recovery
Based on reports from mining trackers, network hashrate fell sharply starting Friday and hit a low not seen in seven months by Sunday, dropping to about 663 EH/s. Within a day or so, as crews worked and weather systems moved on, the figure climbed back toward 854 EH/s.
Hashrate Index estimates the US supplies nearly 38% of worldwide mining power, so disruptions in the country show up fast in global totals.
A federal Energy Information Administration report noted there are more than 130 dedicated crypto mining sites across the US, meaning storms that affect broad regions can hit mining supply in a big way.
Bitcoin Price Action
Price moved with the headlines but not in a straight line. Based on reports, Bitcoin traded around $88,300 through the volatility, with swings linked to both weather and wider geopolitical strains.
BTCUSD now trading at 87,866. Chart: TradingView
The market had earlier seen lifts up near $96,000 during episodes of geopolitical tension, while other stretches brought softer prices as macro risks grew.
Traders watched carefully; the temporary hashrate dip raised questions about short-term miner revenue, yet it did not trigger a major crash in market value.
As the winter storm hits the US, Bitcoin mining companies curtail operations to support the power grid.
Their daily Bitcoin production was hit significantly in the last few days.
CLSK: 22 bitcoin –> 12 Bitcoin
RIOT: 16 –> 3
MARA: 45 –> 7 (more volatile as it mines “solo”)… pic.twitter.com/SzgcbtgQ5V— Julio Moreno (@jjcmoreno) January 26, 2026
Big Miners Felt The Impact
Analytics firms noted output from some big US miners fell sharply. Marathon Digital’s daily production was down from 45 coins to seven in one day, and IREN moved from 18 to six, data compiled by market trackers showed.
Related Reading
CryptoQuant flagged slower daily digs from several major operators as the storm hit. In Texas, reports say miners worked with grid managers to help balance supply and demand, using their machines to soak up extra power when available and to step back when the grid was under strain.
Featured image from Pexels, chart from TradingView
Ethereum price started a fresh increase above $3,250. ETH is now consolidating gains and might aim for more gains if it clears the $3,380 resistance.
- Ethereum started a fresh increase above the $3,200 and $3,250 levels.
- The price is trading above $3,200 and the 100-hourly Simple Moving Average.
- There is a bullish trend line forming with support at $3,210 on the hourly chart of ETH/USD (data feed via Kraken).
- The pair could continue to move up if it settles above the $3,350 zone.
Ethereum Price Rallies Over 8%
Ethereum price managed to stay above $3,000 and started a fresh increase, beating Bitcoin. ETH price gained strength for a move above the $3,120 and $3,250 resistance levels.
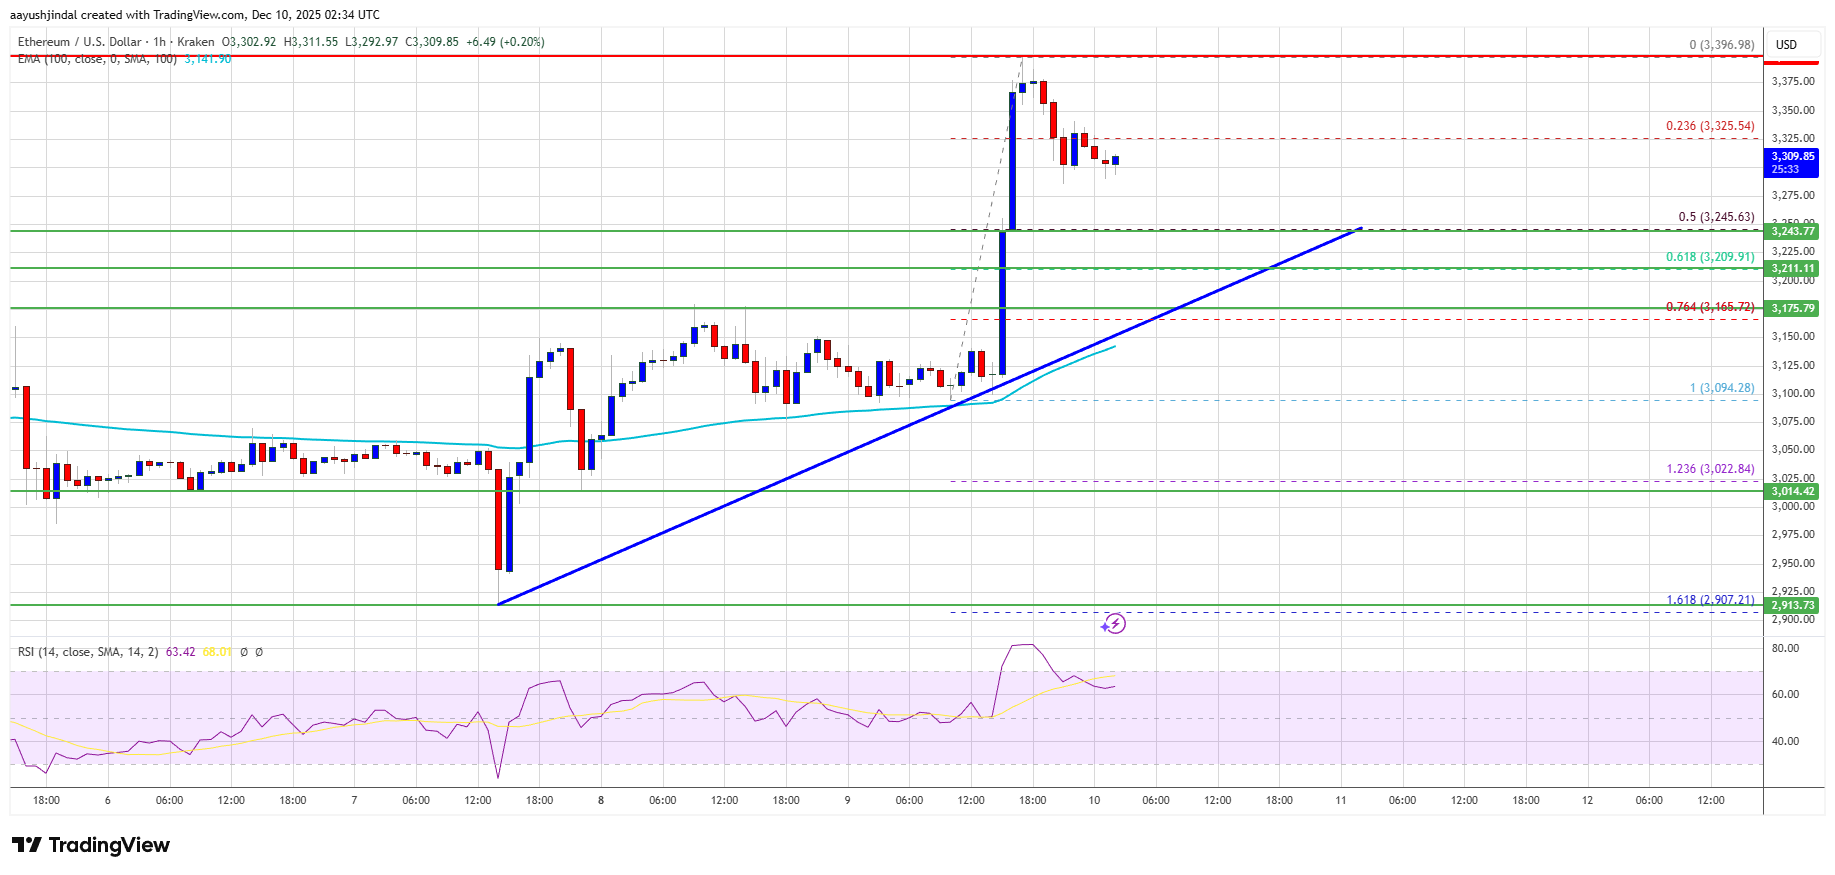
The bulls even pushed the price above $3,350. However, the bears were active below $3,400. A high was formed at $3,396 and the price is now consolidating. There was a minor drop below the 23.6% Fib retracement level of the upward wave from the $3,094 swing low to the $3,396 low.
Ethereum price is now trading above $3,200 and the 100-hourly Simple Moving Average. There is also a bullish trend line forming with support at $3,210 on the hourly chart of ETH/USD.
If there is another upward move, the price could face resistance near the $3,320 level. The next key resistance is near the $3,350 level. The first major resistance is near the $3,380 level. A clear move above the $3,380 resistance might send the price toward the $3,420 resistance. An upside break above the $3,420 region might call for more gains in the coming days. In the stated case, Ether could rise toward the $3,500 resistance zone or even $3,550 in the near term.
Pullback In ETH?
If Ethereum fails to clear the $3,380 resistance, it could start a fresh decline. Initial support on the downside is near the $3,250 level and the 50% Fib retracement level of the upward wave from the $3,094 swing low to the $3,396 low. The first major support sits near the $3,210 zone.
A clear move below the $3,210 support might push the price toward the $3,150 support. Any more losses might send the price toward the $3,050 region. The next key support sits at $3,000.
Technical Indicators
Hourly MACD – The MACD for ETH/USD is gaining momentum in the bullish zone.
Hourly RSI – The RSI for ETH/USD is now above the 50 zone.
Major Support Level – $3,210
Major Resistance Level – $3,380
Best Crypto Presale to Buy Now? MoonBull Smashes $600K as Cardano Launches Global Crypto Card and Ethereum Eyes $4K Breakout Crypto Economy
Source link ]]>
Dogecoin (DOGE) Time Might Be Up As This $0.035 Altcoin Smashes Through Presale Phase 6 MSN
Source link ]]>
Shiba Inu Price Predicton; Pepe Coin News & Remittix Altcoin Smashes $27.5 Million Barrier Crypto Economy
Source link ]]>
Bitcoin price started a strong increase and traded above $118,000. BTC is now consolidating gains and might correct some points in the short term.
- Bitcoin started a major increase above the $116,500 zone.
- The price is trading above $117,000 and the 100 hourly Simple moving average.
- There is a short-term bullish trend line forming with support at $117,000 on the hourly chart of the BTC/USD pair (data feed from Kraken).
- The pair might continue to move up if it clears the $119,500 zone.
Bitcoin Price Starts Fresh Surge
Bitcoin price managed to stay above the $115,000 zone and started a fresh increase. BTC settled above the $115,500 resistance zone to start the current move.
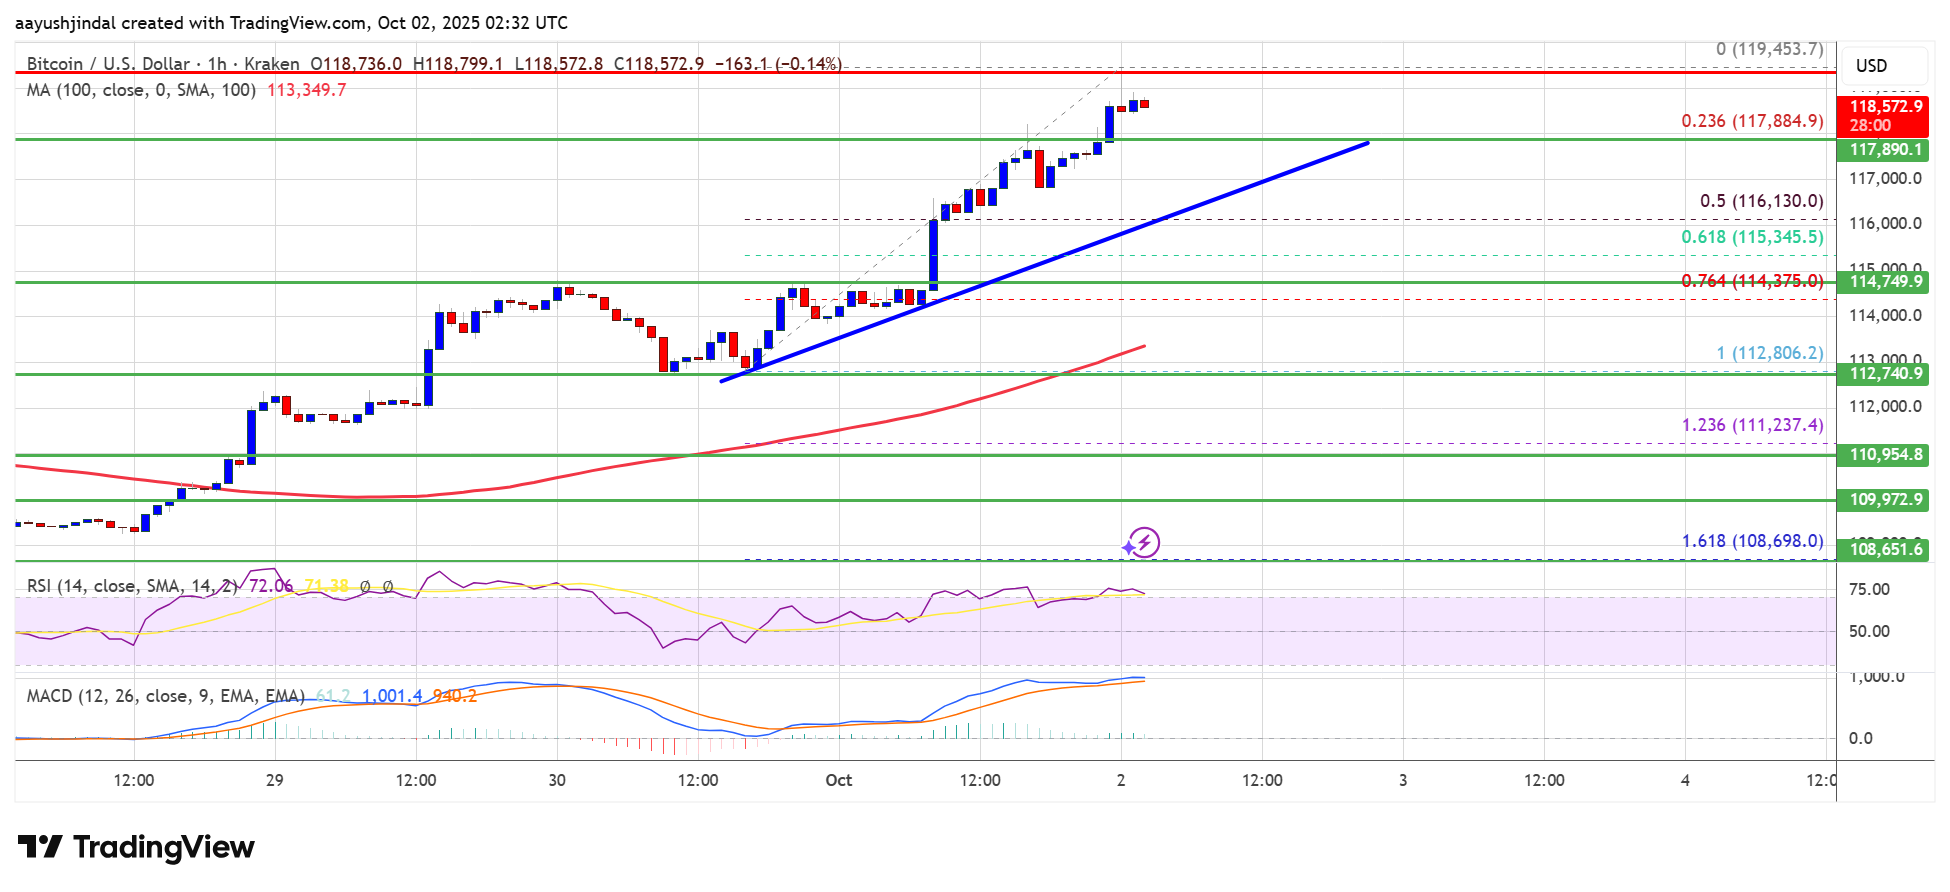
The bulls were able to pump the price above the $117,000 and $118,000 levels. The bulls even cleared the $118,800 level. A high was formed at $119,453 and the price is now consolidating gains above the 23.6% Fib retracement level of the upward move from the $112,806 swing low to the $119,453 high.
Bitcoin is now trading above $117,000 and the 100 hourly Simple moving average. Besides, there is a short-term bullish trend line forming with support at $117,000 on the hourly chart of the BTC/USD pair.
Immediate resistance on the upside is near the $119,000 level. The first key resistance is near the $119,250 level. The next resistance could be $119,500. A close above the $119,500 resistance might send the price further higher. In the stated case, the price could rise and test the $120,500 resistance. Any more gains might send the price toward the $122,500 level. The next barrier for the bulls could be $123,00.
Pullback In BTC?
If Bitcoin fails to rise above the $119,500 resistance zone, it could start a fresh decline. Immediate support is near the $117,000 level and the trend line. The first major support is near the $116,150 level.
The next support is now near the $115,500 zone. Any more losses might send the price toward the $114,000 support in the near term. The main support sits at $113,500, below which BTC might struggle to recover in the short term.
Technical indicators:
Hourly MACD – The MACD is now gaining pace in the bullish zone.
Hourly RSI (Relative Strength Index) – The RSI for BTC/USD is now above the 50 level.
Major Support Levels – $117,000, followed by $116,150.
Major Resistance Levels – $119,500 and $120,500.

The newly launched Rex-Osprey XRP exchange-traded fund has posted the strongest debut of any US ETF introduced in 2025.
On Sept. 18, Bloomberg Intelligence analyst Eric Balchunas noted that the product, trading under the ticker XRPR, recorded $37.7 million in natural volume, making it the most actively traded ETF on launch day this year.

According to Balchunas, the scale of activity was clear from the opening bell. Within 90 minutes of launch, the fund had already crossed $24 million in trades, which is five times the first-hour volume seen by any crypto futures ETF launched in 2025.
Meanwhile, Rex-Osprey’s companion product, a Dogecoin ETF with the ticker DOJE, also drew heavy interest from the market.
Balchunas stated that the investment vehicle saw nearly $6 million traded in its first hour and a closing tally of $17 million. This places it among the top five ETF debuts in 2025.
The strong early numbers reflect growing investor appetite for regulated exposure to alternative digital assets.
Balchunas said:
“[This is a] good sign for the onslaught of 33 Act ETFs coming soon.”
Unlike the spot Bitcoin and Ethereum ETFs that went live last year, Rex-Osprey’s products are structured through Cayman Islands subsidiaries and registered under the Investment Company Act of 1940.
That framework sets them apart from the 1933 Act funds used for spot BTC and ETH, signaling that issuers are experimenting with different regulatory paths to bring altcoins into the ETF market.
XRP and DOGE prices falter
The heavy ETF volumes did not translate into immediate price strength for the underlying tokens.
XRP slipped 3% over the past 24 hours to $3.02, extending a week of gradual declines that have kept the asset locked between $3 and $3.15, according to CryptoSlate data.
Dogecoin price followed a similar pattern during the reporting period.
According to CryptoSlate’s data, the token pulled back 2% to $0.2735 as of press time after briefly hitting a seven-month high of $0.2879 on the ETF’s debut.
This reversal highlights the difference between secondary-market enthusiasm for ETFs and direct spot demand for the coins themselves.
Mentioned in this article

- The DEX’s 24-hour trading volume tops $29B, the highest ever.
- The $7.7 million in daily fees indicates significant user engagement and improved liquidity.
- HYPE’s price has soared over 10% in the past day amid optimism.
Cryptocurrencies sought stability on Friday after yesterday’s hotter-than-anticipated PPI triggered a flash crash that dented most bullish setups.
Meanwhile, HYPE is leading the bounce back after soaring more than 10% in the previous 24 hours, fueled by Hyperliquid’s record-breaking trading statistics.

The decentralized exchange processed a whopping $29 billion in trading volumes and collected $7.7 million in fees within a day, hitting all-time highs in both milestones.
Hyperliquid reached new all-time highs with $29B in 24h volume and $7.7M in 24h fees. pic.twitter.com/uTs0JE5ch8
— Hyperliquid (@HyperliquidX) August 15, 2025
These figures confirm heightened activity levels and a lively user base.
For HYPE investors, such sentiments validate the DEX’s momentum and its market appeal.
The altcoin reacted to the milestone with a notable rebound.
Hyperliquid’s record-breaking figures
Trading volume is among the strongest indicators as it highlights the protocol’s health.
Hyperliquid’s $29 billion breakthrough confirms a lively market.
Intensified volumes generally highlight more traders and heightened liquidity, which increases the opportunities for fast execution and competitive pricing.
The $7.7 million in daily fees reinforces this tale.
While high charges can dent trader profitability, they also represent magnified transaction throughput and user participation.
Moreover, they fuel the native token’s economy, and most platforms tie fees into buybacks, rewards, and other user incentive mechanisms.
What’s driving the surge
The timing of Hyperliquid’s boom isn’t an accident.
The DEX has rolled out multiple upgrades to enhance performance, asset listings, and accommodate diverse traders lately.
The trading volumes and fee spikes coincide with a vital institutional development.
Two days ago, Anchorage Digital Bank added custody for Hyperliquid’s HYPE to ensure institutional-level security in HyperEVM.
The custody service allows HYPE holders to (securely) store their assets on HyperEVM.
The HYPE is real. Anchorage Digital Bank will custody @HyperliquidX‘s native HYPE token, bringing institutional-grade security to HyperEVM.
If you’re looking for custody of HYPE on HyperEVM, or are a builder looking for support launching your ERC-20 on HyperEVM, send us a DM to… pic.twitter.com/oyroDD6AtT
— Anchorage Digital
Prime is Live (@Anchorage) August 13, 2025
Also, the current broad market sentiments added to Hyperliquid’s momentum.
The digital assets space remains hot as enthusiasts brace for a possible altseason.
Individuals looking to capitalize on the anticipated rallies drive the DEX’s activity.
HYPE price outlook
The native coin soared 10.78% from an intraday low of $44.62 to $49.62.
HYPE trades at $48.26 after a 15% weekly gain.

Hyperliquid’s trading volume and fee milestone triggered the latest gains.
However, faded trading volumes signal short-lived rallies for HYPE.
Bulls should flip the broader market trajectory to the upside to support the token’s momentum.
Meanwhile, a close above $49.75 might support continued uptrends past the nearest resistance at $52 to $55 all-time highs.
On the other hand, losing the support barrier at $45 could catalyze dips to the demand zone at $42.
Buyers can use this zone as a Launchpad for significant rebounds.
Nonetheless, broad market performance remains crucial in determining HYPE’s trajectory in the near term.
Solana started a fresh increase above the $185 zone. SOL price is now correcting gains and might find bids near the $195 support zone
- SOL price started a fresh upward move above the $185 and $192 levels against the US Dollar.
- The price is now trading above $195 and the 100-hourly simple moving average.
- There is a key bullish trend line forming with support at $199 on the hourly chart of the SOL/USD pair (data source from Kraken).
- The pair could start a fresh increase if it clears the $205 resistance zone.
Solana Price Gains Momentum
Solana price started a decent increase after it cleared the $180 resistance, like Bitcoin and Ethereum. SOL climbed above the $185 level to enter a short-term positive zone.
The price even smashed the $200 resistance. A high was formed at $207 and the price is now correcting gains. There was a move below the $205 level and toward the 23.6% Fib retracement level of the upward move from the $178 swing low to the $207 high.
Solana is now trading above $195 and the 100-hourly simple moving average. There is also a key bullish trend line forming with support at $199 on the hourly chart of the SOL/USD pair.

On the upside, the price is facing resistance near the $205 level. The next major resistance is near the $208 level. The main resistance could be $215. A successful close above the $215 resistance zone could set the pace for another steady increase. The next key resistance is $232. Any more gains might send the price toward the $245 level.
Are Downsides Limited In SOL?
If SOL fails to rise above the $208 resistance, it could start another decline. Initial support on the downside is near the $199 zone and the trend line. The first major support is near the $195 level.
A break below the $195 level might send the price toward the $192 support zone or the 50% Fib retracement level of the upward move from the $178 swing low to the $207 high. If there is a close below the $192 support, the price could decline toward the $185 support in the near term.
Technical Indicators
Hourly MACD – The MACD for SOL/USD is losing pace in the bullish zone.
Hourly Hours RSI (Relative Strength Index) – The RSI for SOL/USD is above the 50 level.
Major Support Levels – $199 and $192.
Major Resistance Levels – $208 and $215.
]]>