Bitcoin price started a fresh decline from the $69,250 zone. BTC is now struggling to stay above $66,000 and might extend losses in the near term.
- Bitcoin failed to settle above $68,000 and started a fresh decline.
- The price is trading below $67,000 and the 100 hourly simple moving average.
- There is a bearish trend line forming with resistance at $67,450 on the hourly chart of the BTC/USD pair (data feed from Kraken).
- The pair might start another decline if it stays below the $67,500 and $67,800 levels.
Bitcoin Price Dips Again
Bitcoin price failed to stay above the $68,800 zone and started a fresh decline. BTC traded below $68,200 and $68,000 to enter a bearish zone.
The bears even pushed the price below $67,000. A low was formed at $65,688, and the price is now consolidating losses below the 23.6% Fib retracement level of the downward move from the $69,250 swing high to the $65,688 low.
Bitcoin is now trading below $67,000 and the 100 hourly simple moving average. If the price remains stable above $65,500, it could attempt a fresh increase. Immediate resistance is near the $67,000 level.
The first key resistance is near the $67,500 level or the 50% Fib retracement level of the downward move from the $69,250 swing high to the $65,688 low. There is also a bearish trend line forming with resistance at $67,450 on the hourly chart of the BTC/USD pair.
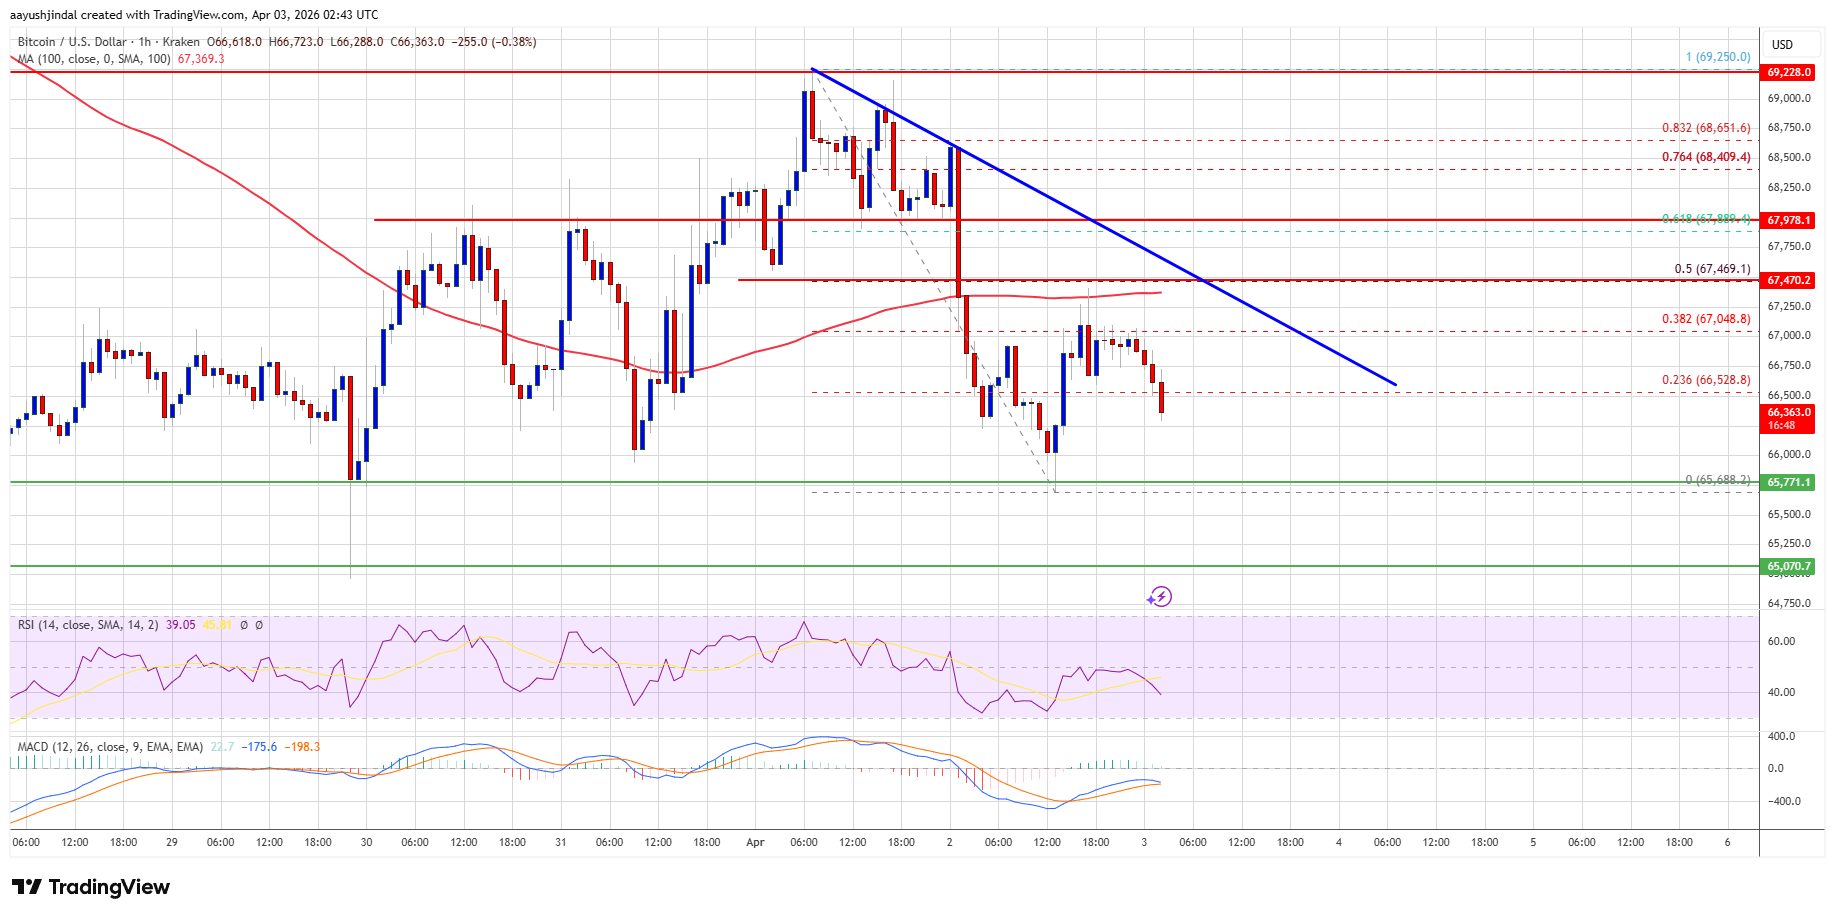
A close above the $67,500 resistance might send the price further higher. In the stated case, the price could rise and test the $68,000 resistance. Any more gains might send the price toward the $68,500 level. The next barrier for the bulls could be $68,800.
More Losses In BTC?
If Bitcoin fails to rise above the $67,500 resistance zone, it could start another decline. Immediate support is near the $66,000 level. The first major support is near the $65,500 level.
The next support is now near the $65,000 zone. Any more losses might send the price toward the $64,200 support in the near term. The main support now sits at $63,500, below which BTC might struggle to recover in the near term.
Technical indicators:
Hourly MACD – The MACD is now gaining pace in the bearish zone.
Hourly RSI (Relative Strength Index) – The RSI for BTC/USD is now below the 50 level.
Major Support Levels – $66,000, followed by $65,500.
Major Resistance Levels – $67,500 and $68,000.
XRP is entering a critical phase where short-term weakness meets a potentially explosive macro setup. With price coiling within a larger expansion pattern, the current move may be less about direction and more about building pressure for a much bigger breakout ahead.
A Coiling Within Explosive Expansion Setup
In an XRP update, EGRAG CRYPTO emphasized that the market is approaching a critical moment, describing the current setup as an “elastic coil” nearing its breaking point. The broader structure is defined by a descending broadening wedge, a formation often associated with powerful expansion phases rather than weakness.
The setup highlights a clear macro structure, with XRP maintaining a strong base around the $0.90 level while price continues to compress near the upper boundary. This tightening action signals building pressure, suggesting that the market may be preparing for a significant directional move.
From a probability standpoint, the outlook leans slightly bullish, eyeing a 55%–60% upside expansion. A confirmed breakout above $3.30 could open the door to higher targets at $5, $8, and potentially $13 or beyond. There is also a potential of a 40%–45% breakdown scenario, where the price briefly dips below $0.90.

A full bearish failure remains the least likely outcome, estimated at just 10%–15%, and would only come into play if the structure breaks down completely without any meaningful recovery. The key takeaway is that the descending broadening wedge represents controlled volatility rather than instability, with longer compression typically leading to a more explosive move.
Key levels remain clearly defined, with $3.30 acting as the primary breakout trigger and $0.90 serving as the critical support line. The overall message is straightforward: the current price action reflects a volatility expansion setup, where structure holds greater importance than short-term noise.
XRP Confirms Textbook TCT Distribution Setup
According to crypto analyst The Composite Trader, XRP confirmed a textbook TCT Model 1 distribution schematic during the New York PM session, a setup that had been developing throughout the day. The confirmation came with a clean and decisive bearish break, as the expert anticipates a bearish order flow observed across major cryptocurrencies.
Following the breakdown, price continued to move efficiently toward its projected technical target, completing the anticipated reversal overnight. This follow-through reinforced the validity of the distribution model, allowing for a partial take-profit (TP1) of 25% to be secured. The reaction highlights how structured setups, when aligned with market context, can deliver precise and measurable outcomes.
Focus now shifts to the next phase, as the analyst watches closely to see whether XRP can break below its current lows. A successful move lower from here could signal a deeper, higher-timeframe reversal. With volatility starting to increase and momentum building, Q2 is already showing signs of becoming an active and opportunity-filled period.
]]>Remittix Has Real Utility As Dogecoin & Pepe Traders Snap Up $RTX Tokens As Presale Set To End Blockonomi
Source link ]]>
Solana, XRP, Dogecoin, Cardano, PEPE & Bonk Holders Snap Up Remittix 300% Bonus Finbold
Source link ]]>
With Dogecoin Whale Activity Slumping, Will New Crypto Project Snap Its Lost Market Share? FinanceFeeds
Source link ]]>
Litecoin Can’t Snap $100, Dogecoin Fades Fast, While BlockDAG’s openPR.com
Source link ]]>
Cardano Price Prediction: Remittix Eyes $5 From $0.11 In Q4 As ADA Whales Snap Up Trending Ethereum Token openPR.com
Source link ]]>
Bitcoin, Ethereum, XRP, Dogecoin Snap Winning Run; Analyst Sees New ETH Highs Once Gold’s ‘Insanely Parabolic’ Trajectory Ends Benzinga
Source link ]]>
Dogecoin Price Prediction: DOGE Holders Snap Up $RTX After Analysts Call It The ‘Next Big Crypto’ openPR.com
Source link ]]>
Shiba Inu Price Prediction: Remittix Set For Gold As Investors Snap Up Viral Crypto Presale Cryptopolitan
Source link ]]>