Shiba Inu Price Prediction: Retail Sentiment Springboard Altcoins and Meme Coins as DeepSnitch AI Rolls Out 100x Dev Update Blockonomi
Source link ]]>
Ethereum price is holding gains above the $3,500 zone. ETH is consolidating and might soon aim for a move above the $3,600 resistance zone.
- Ethereum started a downside correction from the $3,685 zone.
- The price is trading above $3,520 and the 100-hourly Simple Moving Average.
- There is a connecting bearish trend line forming with resistance at $3,600 on the hourly chart of ETH/USD (data feed via Kraken).
- The pair could restart its increase if it clears the $3,600 zone.
Ethereum Price Eyes Fresh Surge
Ethereum price remained supported above $3,250 and started a fresh increase beating Bitcoin. ETH was able to surpass the $3,500 and $3,550 resistance levels.
The bulls pumped the price above the $3,650 level. A high was formed at $3,688 and the price recently corrected some gains. There was a minor decline below the $3,650 and $3,620 levels. The price dipped below the 23.6% Fib retracement level of the upward wave from the $3,255 swing low to the $3,688 high.
Ethereum price is now trading above $3,520 and the 100-hourly Simple Moving Average. On the upside, the price seems to be facing hurdles near the $3,600 level. There is also a connecting bearish trend line forming with resistance at $3,600 on the hourly chart of ETH/USD.

The first major resistance is near the $3,650 level. The main resistance is now forming near $3,680. A clear move above the $3,680 resistance might send the price toward the $3,750 resistance. An upside break above the $3,750 resistance might call for more gains in the coming sessions. In the stated case, Ether could rise toward the $3,880 resistance zone or even $3,920.
More Losses In ETH?
If Ethereum fails to clear the $3,650 resistance, it could start another decline. Initial support on the downside is near the $3,540 level. The first major support sits near the $3,500 zone.
A clear move below the $3,500 support might push the price toward the 50% Fib retracement level of the upward move from the $3,254 swing low to the $3,688 high at $3,470. Any more losses might send the price toward the $3,400 support level in the near term. The next key support sits at $3,350.
Technical Indicators
Hourly MACD – The MACD for ETH/USD is losing momentum in the bullish zone.
Hourly RSI – The RSI for ETH/USD is now above the 50 zone.
Major Support Level – $3,540
Major Resistance Level – $3,650
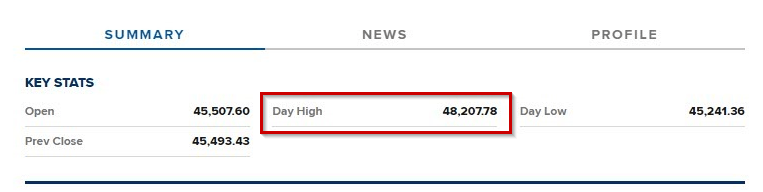
Bitcoin roared back this week, clawing its way to $48,207 – its highest point since early January. This fiery ascent follows weeks of muted trading, fueled by concerns about institutional outflows and a post-ETF price dip. But what’s sparking this sudden surge? And can the digital dragon overcome its next hurdle?
Positive Winds Fill Bitcoin’s Sails
Several factors are propelling Bitcoin’s recent rally:
- Spot ETF Momentum: The long-awaited launch of spot Bitcoin ETFs in January might be finally delivering on its promise. Potential inflows and positive sentiment surrounding these new investment vehicles are driving interest.
- Halving Horizon: The Bitcoin halving, scheduled for May 2024, looms large. Historically, this event, which reduces the rate of new Bitcoin creation, has been linked to price increases, fueling investor optimism.
- Market Synergy: The S&P 500’s recent ascent to record highs seems to be spilling over to the crypto market, creating a wave of positive momentum.
- Lunar Luck? Bitcoin often experiences gains around the Chinese New Year, and this year is no exception. The “Year of the Dragon,” with its auspicious connotations, adds another layer of bullish sentiment.
- ETF Absorption of Selling Pressure: Several ETFs have absorbed over a billion dollars worth of Bitcoin selling pressure in recent weeks, indicating underlying demand despite pre-ETF concerns.
Bitcoin currently trading at $47,335 on the daily chart: TradingView.com
But Can Bitcoin Slay The Resistance Dragon?
While the outlook seems bright, challenges remain:
- Resistance at $48,500: Bitcoin faces a crucial resistance level at $48,500. Breaking through this barrier is key for a potential new all-time high.
- Post-ETF Sell-off: Despite the recent surge, Bitcoin remains below its pre-ETF highs, sparking concerns about a potential sell-off after the initial excitement fades.
- Volatility Reigns: Crypto remains a notoriously volatile asset, and predicting future price movements is fraught with difficulty.
Experts Weigh In: Bitcoin At $52K
Sylvia Jablonski, CEO of Defiance ETFs, attributes the price appreciation to “recent inflows into the spot ETFs, the prospect of the halving, and general market momentum.” However, she cautions that breaking through resistance levels is never guaranteed, and investors should approach any investment with caution.
Meanwhile, Markus Thielen, the founder of 10x Research and head of research at Matrixport, predicted more rise in bitcoin prices using Elliott Wave theory, a technical study that makes the assumption that prices move in repeating wave patterns.
The idea states that price trends evolve in five stages, with waves 1, 3, and 5 serving as “impulse waves” that indicate the primary trend. Retracements between the impulsive price movement occur in waves two and four.
According to Thielen, BTC has begun its final, fifth impulsive stage of its uptrend, aiming to reach $52,000 by mid-March, after completing its wave 4 retracement and correcting to $38,500.
Featured image from Adobe Stock, chart from TradingView
Disclaimer: The article is provided for educational purposes only. It does not represent the opinions of NewsBTC on whether to buy, sell or hold any investments and naturally investing carries risks. You are advised to conduct your own research before making any investment decisions. Use information provided on this website entirely at your own risk.