While others argue that the Bitcoin price has already found its bottom and could be gearing up for a bullish reversal, one crypto analyst has rejected these claims, expecting further downside instead. According to Marmot, a crypto expert on X, Bitcoin has not yet reached its true price floor. He warns that the flagship cryptocurrency could crash below $45,000 before any sustainable recovery to the upside takes shape.
Bitcoin Price Action Mirrors 2022 Bear Market
In a recent X post, Marmot shared a bearish analysis of Bitcoin, comparing its current bear market to past cycles. The analyst noted that Bitcoin’s recent price action closely mirrors patterns seen in the 2022 bear market.
Related Reading
Notably, Bitcoin has already fallen more than 40% from its all-time high above $126,000 in October 2025. Since that peak, the flagship cryptocurrency has trended downward, recording brief price rallies, which Marmot has described as “fake recoveries.” These upside moves temporarily lure investors into the market before prices reverse sharply downwards, leading to losses.
To support his bearish outlook, Marmot has divided Bitcoin’s current bear market into three phases. The first phase was completed after the cryptocurrency crashed by over 54%, now trading at around above $74,000. According to him, the market is now in the second bear phase, a period characterized by repeated bull traps, fakeouts, and continued volatility designed to wipe out short-term investors.
The most recent bull trap was observed after the US-Iran ceasefire announcement, which sent Bitcoin surging briefly above $73,000. However, this rally proved short-lived as the price quickly reversed toward $71,000 before rebounding again above $74,000 at the time of writing.
As bear traps repeatedly wipe out more shorts and long positions get caught in successive bull traps, Marmot argues that Bitcoin is now entering the final phase of its bear market. He believes that this stage is where Bitcoin’s true bottom is most likely to form.
Analyst Forecasts The “Real” Bitcoin Bottom
In his chart, Marmot placed Bitcoin’s projected bottom below the $43,700 level. With the price currently hovering around $74,000, this implies a potential decline of over 40% and a drop of more than 65% from its all-time high.
Related Reading
Before reaching that low, Marmot predicts that the market could experience one final crash to shake out the remaining market participants. His price chart shows that Bitcoin experienced a bear trap and a bull trap before ultimately bottoming during the 2022 cycle. Notably, the current cycle is almost perfectly repeating the same pattern, with BTC’s bull and bear trap already complete as the market gears up for its next bottom crash.

The chart also shows that rather than a straight decline to the projected price floor, BTC could first drop to $45,500, stage a brief rebound, and then hit a bottom before recovering and climbing back above $45,000 as its new bullish phase begins.
Featured image from Pixabay, chart from Tradingview.com
Cardano braces for impact as US tariff storm brews FXStreet
Source link ]]>
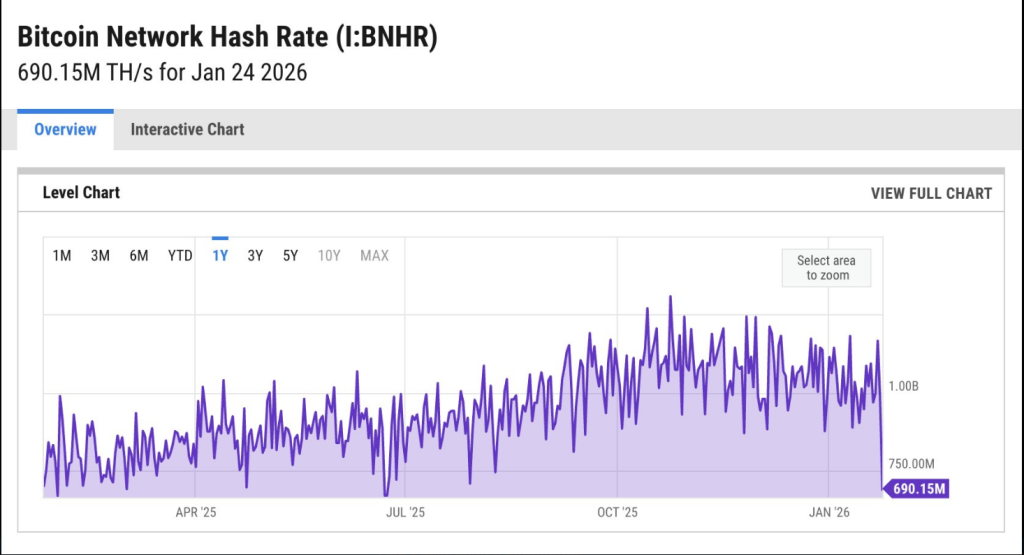
A fierce winter storm that swept much of the US over the weekend forced large parts of the Bitcoin mining fleet to cut power, leaving the network much weaker for a short time.
Related Reading
Reports say power outages and extreme weather pushed some operators to pause or slow their rigs so local grids could breathe. The result was a dramatic, though temporary, fall in the total mining power securing the blockchain.
Miners Adjust Power Use
According to mining operators on the ground, the pause was intentional. Many farms turned down machines to reduce strain on regional utilities when demand spiked and generation dropped.
Abundant Mines, a crypto mining firm headquartered in Oregon, said roughly 40% of global mining capacity went offline in a 24-hour window. That kind of quick scaling back is possible because miners can shut down and restart hardware rapidly, which in some regions acts like a big, flexible electrical load that can be trimmed when needed.
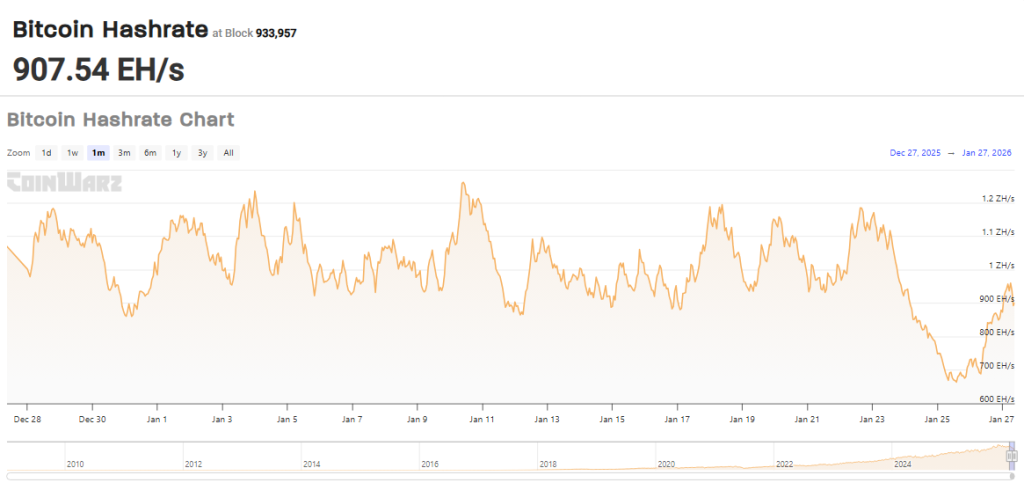
Bitcoin Hashrate Just Dropped Below 700 EH/s
The likely cause: the winter storm impacting Texas & the southeast, where a large share of US mining happens. Power outages and voluntary grid-stabilization measures have taken miners offline.
What this means:
– Fewer miners online… pic.twitter.com/j0lv7bU9JN— Abundant Mines (@AbundantMines) January 25, 2026
Hashrate Drop And Quick Recovery
Based on reports from mining trackers, network hashrate fell sharply starting Friday and hit a low not seen in seven months by Sunday, dropping to about 663 EH/s. Within a day or so, as crews worked and weather systems moved on, the figure climbed back toward 854 EH/s.
Hashrate Index estimates the US supplies nearly 38% of worldwide mining power, so disruptions in the country show up fast in global totals.
A federal Energy Information Administration report noted there are more than 130 dedicated crypto mining sites across the US, meaning storms that affect broad regions can hit mining supply in a big way.
Bitcoin Price Action
Price moved with the headlines but not in a straight line. Based on reports, Bitcoin traded around $88,300 through the volatility, with swings linked to both weather and wider geopolitical strains.
BTCUSD now trading at 87,866. Chart: TradingView
The market had earlier seen lifts up near $96,000 during episodes of geopolitical tension, while other stretches brought softer prices as macro risks grew.
Traders watched carefully; the temporary hashrate dip raised questions about short-term miner revenue, yet it did not trigger a major crash in market value.
As the winter storm hits the US, Bitcoin mining companies curtail operations to support the power grid.
Their daily Bitcoin production was hit significantly in the last few days.
CLSK: 22 bitcoin –> 12 Bitcoin
RIOT: 16 –> 3
MARA: 45 –> 7 (more volatile as it mines “solo”)… pic.twitter.com/SzgcbtgQ5V— Julio Moreno (@jjcmoreno) January 26, 2026
Big Miners Felt The Impact
Analytics firms noted output from some big US miners fell sharply. Marathon Digital’s daily production was down from 45 coins to seven in one day, and IREN moved from 18 to six, data compiled by market trackers showed.
Related Reading
CryptoQuant flagged slower daily digs from several major operators as the storm hit. In Texas, reports say miners worked with grid managers to help balance supply and demand, using their machines to soak up extra power when available and to step back when the grid was under strain.
Featured image from Pexels, chart from TradingView
‘New ADA’ Goes Parabolic With 357% Ratio, Cardano Creator Teases Storm Incoming TradingView — Track All Markets
Source link ]]>
Storm Clouds Over Cardano Amid Massive Transfer OneSafe
Source link ]]>
Bitcoin is approaching a critical tipping point as two powerful bullish patterns, the Cup & Handle and the Inverse Head and Shoulders, align to signal a potential breakout storm. With momentum building and key resistance levels now within reach, the market is bracing for what could be a major explosive move.
BTC Climbs Above 93,160 As Cup & Handle Targets 104,000
Charting BTC on the 4-hour timeframe, analyst Kamile Uray revealed that the price is currently moving above the $93,160 level. Uray is closely monitoring the price, as a successful close above this level would confirm the breakout of a recently formed cup and handle pattern. According to this classic pattern, a confirmed breakout targets the $104,000 level.
If BTC reaches the $104,000 target without forming a wicking reversal, it would also decisively break the falling blue trendline. Breaking both this trendline and the pattern target would provide strong evidence for the continuation of the overall uptrend. The analyst highlighted that the next major resistances are located at the $98,200 and $107,500 levels. A break above $107,500 and the falling blue trend on the daily chart will serve as the ultimate sign that the long-term uptrend is fully resumed.

Uray suggests that retests after the breakout of the pink box ( the handle resistance area) can be evaluated as potential trade entries. The mandatory stop-loss for these trades should be placed at a daily close below the pink box, maintaining strict risk management.
Conversely, should the price fail to hold the pink box, the immediate support zone to watch is the $83,822 – $82,477 region below. A bearish scenario is confirmed by a daily close below $82,477, signaling a continuation of the downtrend. In this case, the market would likely seek the next support zone at $74,496 – $71,237, which represents the previous top broken in November 2024. If this zone holds, a major uptrend reversal could be expected again.
IH&S Pattern Confirms Reversal Momentum
According to a recent update by Crypto VIP Signal, Bitcoin’s recent price action has confirmed a significant bullish reversal. The asset has successfully surpassed the $87,500 mark and has also broken through the key level of $90,000. This upward movement confirms that the Inverse Head and Shoulders (IH&S) pattern has acted as expected, triggering a strong trend reversal signal.
The analyst noted that the current market structure appears strong because the price increase is being supported by healthy trading volume. With the reversal confirmed, Crypto VIP Signal noted that the next technical benchmark for the market is $95,000, and it will be interesting to see how the price behaves when it tests this resistance point.
]]>Shiba Inu News; Dogecoin Price Prediction & Why PayFi Remittix Could Storm Into The Lead In Q4 livebitcoinnews.com
Source link ]]>
ADA Holders Fear Another Dip Below $0.50 As A New Cardano Rival Takes The Market By Storm Crypto Economy
Source link ]]>
Whales Move $157M in Cardano as ETF Odds Hit 75%: Analysts See Bullish Storm Brewing | Bitcoinist.com Bitcoinist.com
Source link ]]>
Dogecoin Price Prediction: Bullish Setup = Perfect Storm for 10x Cryptonews
Source link ]]>