Cardano Leadership Structure Comes Under Scrutiny, Clouding Its Future – See Why MEXC
Source link ]]>
Bitcoin price started a fresh decline from the $78,400 zone. BTC is consolidating and might struggle to stay above the $73,500 support.
- Bitcoin failed to stay above $76,500 and corrected gains.
- The price is trading below $75,500 and the 100 hourly simple moving average.
- There is a connecting bearish trend line forming with resistance at $75,600 on the hourly chart of the BTC/USD pair (data feed from Kraken).
- The pair might extend losses if it stays below the $75,500 and $76,000 levels.
Bitcoin Price Dips Again
Bitcoin price failed to stay above the $77,500 resistance zone. BTC formed a top near $78,350 and started a fresh decline. There was a move below the $76,500 level.
The price dipped below the $75,500 and $75,000 levels. A low was formed at $73,637 and the price is now consolidating losses below the 23.6% Fib retracement level of the downward move from the $78,343 swing high to the $73,637 low.
Bitcoin is now trading below $76,000 and the 100 hourly simple moving average. If the price remains stable above $73,500, it could attempt a fresh increase. Immediate resistance is near the $74,750 level.
The first key resistance is near the $75,500 level. There is also a connecting bearish trend line forming with resistance at $75,600 on the hourly chart of the BTC/USD pair. A close above the $75,500 resistance might send the price further higher.
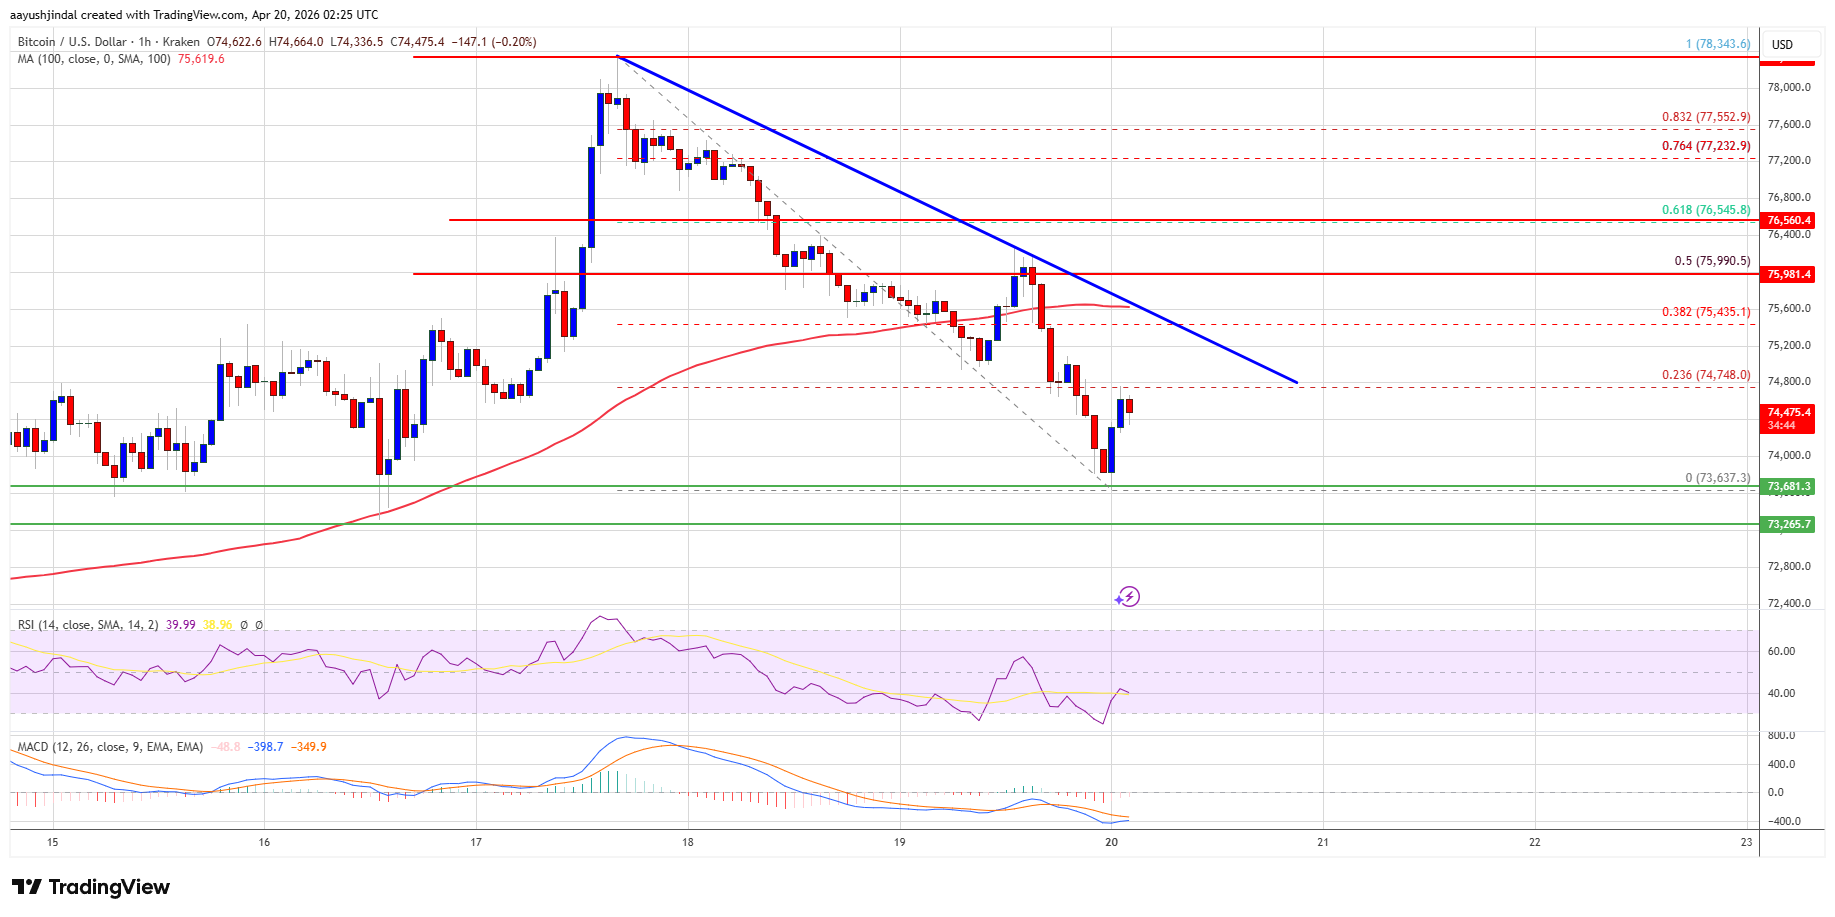
In the stated case, the price could rise and test the $76,000 resistance and the 50% Fib retracement level of the downward move from the $78,343 swing high to the $73,637 low. Any more gains might send the price toward the $77,200 level. The next barrier for the bulls could be $78,000.
Downside Continuation In BTC?
If Bitcoin fails to rise above the $75,500 resistance zone, it could start another decline. Immediate support is near the $74,000 level.
The first major support is near the $73,500 level. The next support is now near the $72,500 zone. Any more losses might send the price toward the $71,200 support in the near term. The main support now sits at $70,000, below which BTC might struggle to recover in the near term.
Technical indicators:
Hourly MACD – The MACD is now gaining pace in the bearish zone.
Hourly RSI (Relative Strength Index) – The RSI for BTC/USD is now below the 50 level.
Major Support Levels – $74,000, followed by $73,500.
Major Resistance Levels – $75,500 and $76,000.
Shiba Inu (SHIB) Price Prediction: BTC Clears $78,000 as SHIB Holds $0.0000103 Breakout Structure openPR.com
Source link ]]>
XRP’s recent move is raising an important question: is this a genuine shift in trend or just another fake pump within a broader bearish structure? While short-term candles may look promising, price has yet to confirm a new high, and resistance continues to hold firm, suggesting underlying weakness.
Short-Term Bounce Sparks False Bullish Sentiment
Don’t get trapped in the noise. XRP’s structure still points lower, CasiTrades cautioned in a recent update on X, which comes as short-term movements begin to spark renewed optimism among traders.
A series of bullish candles over the past day has already started to shift sentiment, with many turning optimistic once again. In reality, these brief rallies, which tend to draw traders in prematurely, can simply be part of a larger corrective phase rather than the start of a sustained uptrend.

Price has yet to break into a new high and instead completed a clean 5-wave push directly into resistance. Bearish divergence is also appearing, with signals that point to exhaustion rather than strength. Until a confirmed breakout occurs, the overall structure remains intact, and the current price action is likely just noise within the broader pattern.
Zooming Out Reveals A Clear Bearish XRP Roadmap
CasiTrades went on to stress that taking a step back makes the outlook much clearer, with price currently caught between well-defined support and resistance zones. From a higher timeframe perspective, multiple structures continue to align to the downside, reinforcing the idea that the broader trend has not shifted.
The projected path begins with a move lower toward the $1.13 region, marking the first leg of the decline. A small relief bounce is expected to follow, but not enough to change the overall direction. From there, continuation toward the $1.08 level comes into focus, aligning with the macro 0.786 support.
Further along, more choppy price action or brief relief rallies may appear, but the broader expectation remains a continuation to the downside. The final leg of the move points toward the $0.87 region, which corresponds with the macro 0.854 support. Rather than a straight drop, the structure suggests a staged decline, with pauses and minor recoveries along the way.
CasiTrades emphasizes the importance of staying detached from emotional reactions and avoiding the urge to trade every fluctuation. The strategy remains centered on key levels, looking for buying opportunities at major supports like the 0.786 and 0.854, or waiting for a confirmed breakout above resistance that flips into support around the 0.618. Price action between these zones is largely viewed as noise, often driven by liquidity hunts designed to shake out impatient participants.
]]>Ethereum price extended gains above $2,150 before it faced sellers. ETH is now correcting gains and might find bids near the $2,080 zone.
- Ethereum started a decent upward move above the $2,120 zone.
- The price is trading above $2,100 and the 100-hourly Simple Moving Average.
- There was a break below a rising channel with support at $2,140 on the hourly chart of ETH/USD (data feed via Kraken).
- The pair could start a fresh increase if it stays above the $2,080 resistance.
Ethereum Price Aims Higher
Ethereum price remained stable above $2,050 and started a decent upward move, like Bitcoin. ETH price climbed above the $2,080 and $2,120 resistance levels.
The bulls pumped the price above $2,150. A high was formed at $2,174 before the price started a downside correction. There was a move below the 38.2% Fib retracement level of the upward move from the $2,021 swing low to the $2,174 high.
Besides, there was a break below a rising channel with support at $2,140 on the hourly chart of ETH/USD. Ethereum price is now trading above $2,080 and the 100-hourly Simple Moving Average. If the bulls remain in action above $2,080, the price could attempt another increase.
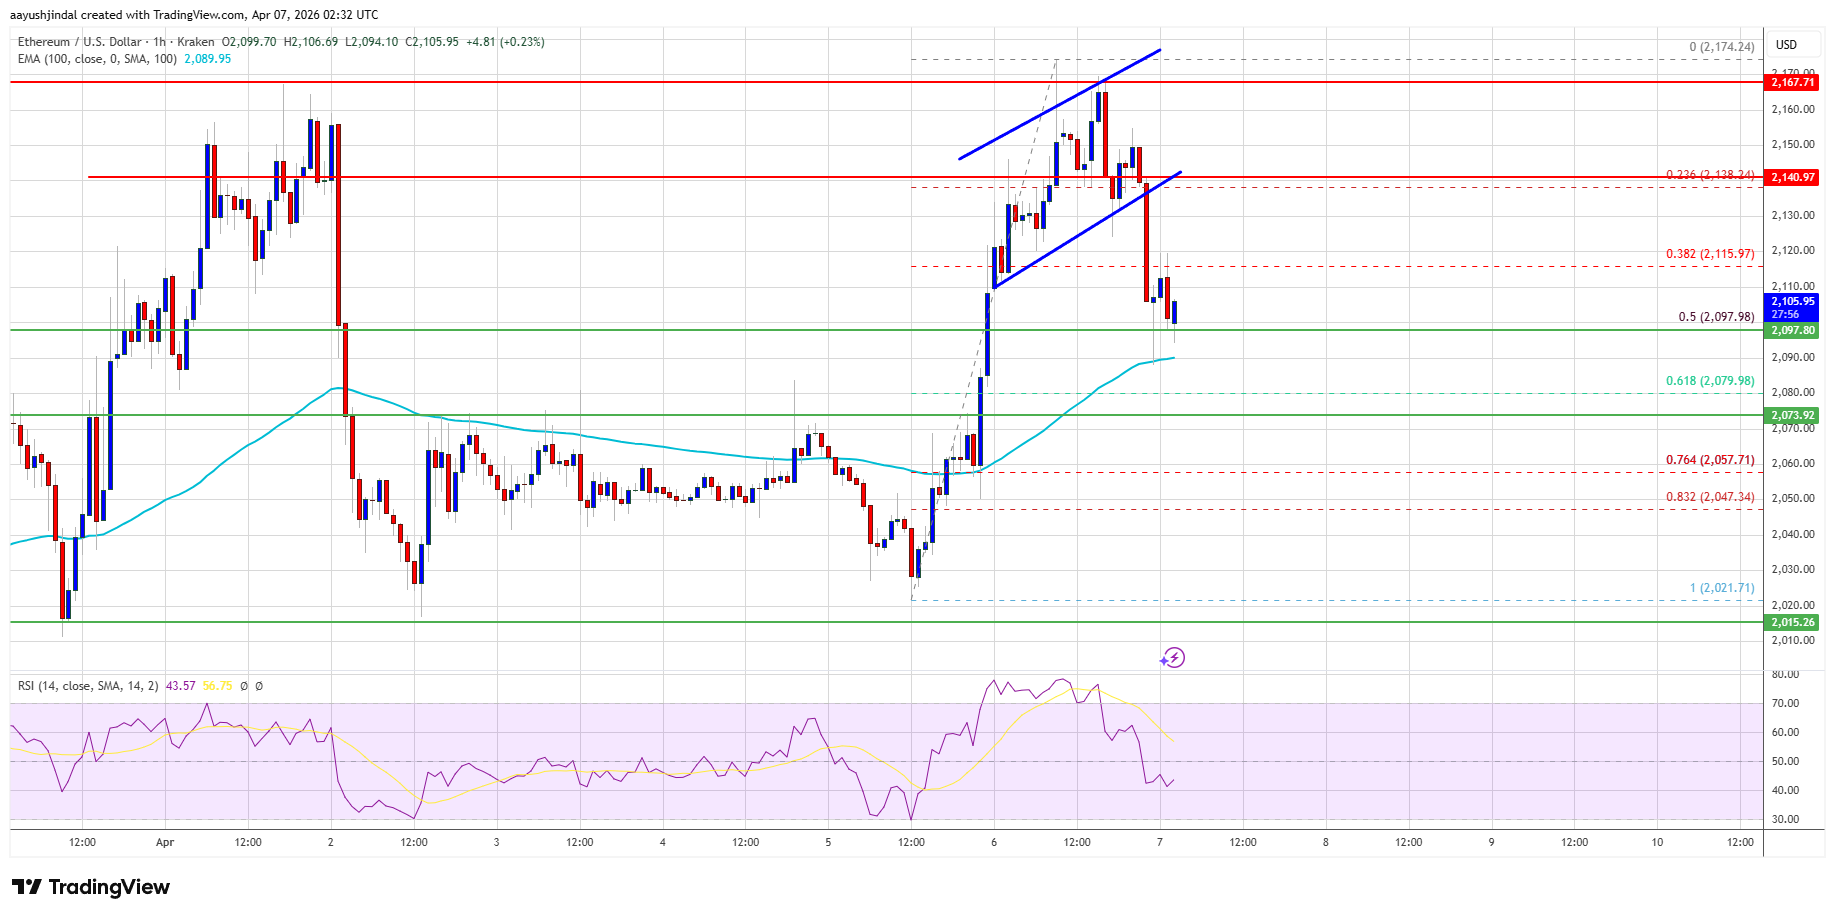
Immediate resistance is seen near the $2,120 level. The first key resistance is near the $2,140 level. The next major resistance is near the $2,175 level. A clear move above the $2,175 resistance might send the price toward the $2,220 resistance. An upside break above the $2,220 region might call for more gains in the coming days. In the stated case, Ether could rise toward the $2,350 resistance zone or even $2,380 in the near term.
More Losses In ETH?
If Ethereum fails to clear the $2,140 resistance, it could start a fresh decline. Initial support on the downside is near the $2,080 level or the 61.8% Fib retracement level of the upward move from the $2,021 swing low to the $2,174 high. The first major support sits near the $2,065 zone.
A clear move below the $2,065 support might push the price toward the $2,020 support. Any more losses might send the price toward the $1,980 region. The main support could be $1,965.
Technical Indicators
Hourly MACD – The MACD for ETH/USD is gaining momentum in the bearish zone.
Hourly RSI – The RSI for ETH/USD is now below the 50 zone.
Major Support Level – $2,065
Major Resistance Level – $2,140
Analyst Says $10 Cardano Price Is “Not If, But When” As Bullish Structure Strengthens ZyCrypto
Source link ]]>
Dogecoin Price Crashes but Chart Structure Points to Potential Surge BanklessTimes
Source link ]]>
Bitcoin (BTC) is showing technical warning signs that have caught the attention of market watchers, with one analyst now predicting a dramatic price collapse in the world’s largest cryptocurrency. The analyst noted that a Bitcoin candlestick pattern that previously preceded a devastating crash to below $20,000 has reappeared on the weekly chart, reigniting fears that history may be repeating itself. If it does, it could completely rewrite the narrative of this entire market cycle.
Historical Setup Signals Bitcoin Potential Crash To $19,000
Market analyst Tony Severino has issued a stark warning to Bitcoin investors and holders, sharing a technical analysis on X that draws a chilling comparison between current price action and a previous cycle crash. The analyst has projected that Bitcoin could decline as low as $19,000 in this bear market.
Related Reading
The chart shared by Severino places two Bitcoin weekly candlestick patterns side by side, revealing a near-identical structural setup between the current market cycle and a previous bear phase. The left panel shows Bitcoin’s recent trajectory from late 2025 to early 2026, while the right panel displays a historical period that ultimately saw prices collapse below $20,000.
Severino expressed his surprise at the chart patterns, noting that it was “absolutely wild” how similar the candlestick structures are between the two periods. He added that even the technical indicators are “almost exactly the same.”

Both chart panels feature a prominent rectangular consolidation zone followed by a pink-highlighted rebound area. The visual symmetry between the two timeframes underpins the analyst’s bearish thesis, suggesting that the current rebound around the pink zone could be short-lived, followed by a potential crash below $19,000 if historical trends repeat.
Notably, the analyst’s bearish forecast drew skepticism from some members of the crypto community. One member argued that a drop to such levels would not simply represent a routine cycle correction, but the largest retracement in Bitcoin’s history. Severino, however, stood firmly on his analysis and forecast, stating that a 74% correction was entirely possible and even normal within Bitcoin’s historical framework. Not backing down, he insisted again that the market may still have significant downside to navigate before any meaningful bottom is established.
Update On BTC’s Price Action
The Bitcoin price has recovered again from its previous level, trading back above $70,000. Last week, the cryptocurrency crashed to as low as $63,000 amid significant volatility and shifts in market sentiment.
Related Reading
However, CoinMarketCap data shows that Bitcoin has gained over 4.8% in the last 24 hours, with its daily trading volume up by more than 23.4%. The sudden price increase has been attributed to sustained inflows into Spot Bitcoin ETFs and easing geopolitical tensions in the Middle East.
Featured image from Pixabay, chart from Tradingview.com
The Cardano Structure Nobody Is Talking About: Analyst Cryptonews.net
Source link ]]>
My name is Godspower Owie, and I was born and brought up in Edo State, Nigeria. I grew up with my three siblings who have always been my idols and mentors, helping me to grow and understand the way of life.
My parents are literally the backbone of my story. They’ve always supported me in good and bad times and never for once left my side whenever I feel lost in this world. Honestly, having such amazing parents makes you feel safe and secure, and I won’t trade them for anything else in this world.
I was exposed to the cryptocurrency world 3 years ago and got so interested in knowing so much about it. It all started when a friend of mine invested in a crypto asset, which he yielded massive gains from his investments.
When I confronted him about cryptocurrency he explained his journey so far in the field. It was impressive getting to know about his consistency and dedication in the space despite the risks involved, and these are the major reasons why I got so interested in cryptocurrency.
Trust me, I’ve had my share of experience with the ups and downs in the market but I never for once lost the passion to grow in the field. This is because I believe growth leads to excellence and that’s my goal in the field. And today, I am an employee of Bitcoinnist and NewsBTC news outlets.
My Bosses and co-workers are the best kinds of people I have ever worked with, in and outside the crypto landscape. I intend to give my all working alongside my amazing colleagues for the growth of these companies.
Sometimes I like to picture myself as an explorer, this is because I like visiting new places, I like learning new things (useful things to be precise), I like meeting new people – people who make an impact in my life no matter how little it is.
One of the things I love and enjoy doing the most is football. It will remain my favorite outdoor activity, probably because I’m so good at it. I am also very good at singing, dancing, acting, fashion and others.
I cherish my time, work, family, and loved ones. I mean, those are probably the most important things in anyone’s life. I don’t chase illusions, I chase dreams.
I know there is still a lot about myself that I need to figure out as I strive to become successful in life. I’m certain I will get there because I know I am not a quitter, and I will give my all till the very end to see myself at the top.
I aspire to be a boss someday, having people work under me just as I’ve worked under great people. This is one of my biggest dreams professionally, and one I do not take lightly. Everyone knows the road ahead is not as easy as it looks, but with God Almighty, my family, and shared passion friends, there is no stopping me.