Ethereum price started a major increase above the $3,350 resistance. ETH is now consolidating gains and holding the key support at $3,280.
- Ethereum started a downside correction after a major rally to $3,400.
- The price is trading above $3,280 and the 100-hourly Simple Moving Average.
- There is a bullish trend line forming with support at $3,280 on the hourly chart of ETH/USD (data feed via Kraken).
- The pair could start a fresh increase if it stays above the $3,280 zone.
Ethereum Price Hits Support
Ethereum price remained stable above $3,300 and started a fresh increase, like Bitcoin. ETH price rallied above the $3,320 and $3,350 resistance levels.
A high was formed at $3,402, and the price recently started a downside correction. There was a move below $3,320. The price dipped below the 23.6% Fib retracement level of the recent wave from the $3,060 swing low to the $3,402 high.
Ethereum price is now trading above $3,280 and the 100-hourly Simple Moving Average. There is also a bullish trend line forming with support at $3,280 on the hourly chart of ETH/USD.
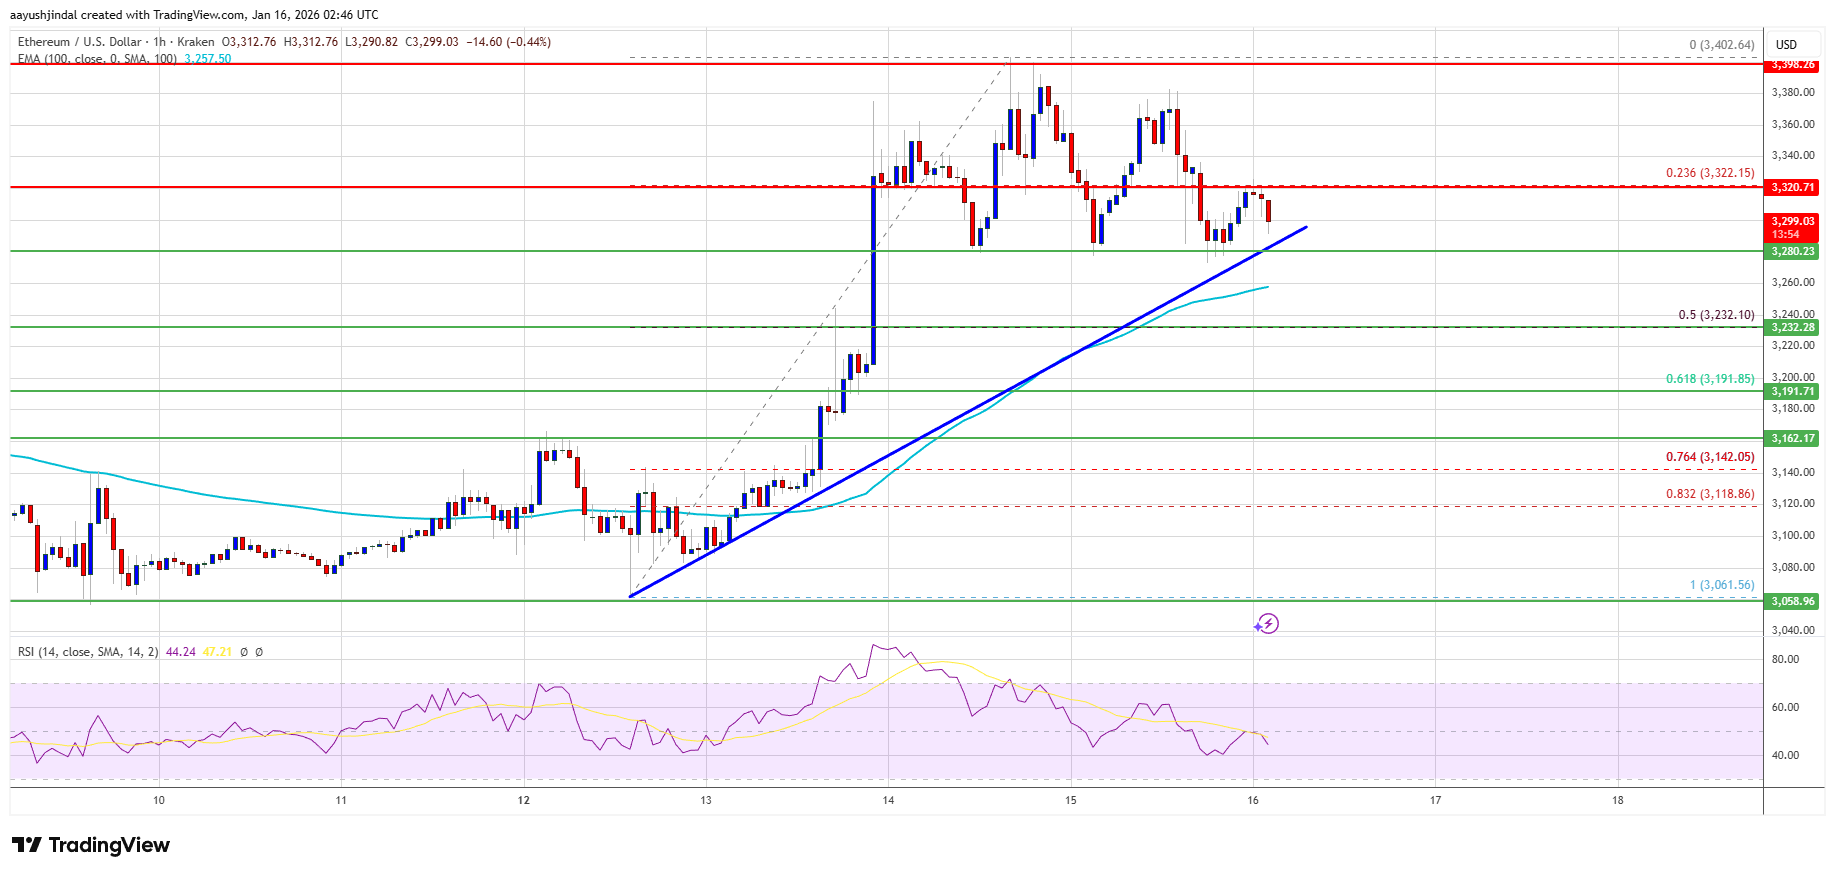
If the bulls can protect more losses below $3,280, the price could attempt another increase. Immediate resistance is seen near the $3,320 level. The first key resistance is near the $3,350 level. The next major resistance is near the $3,385 level. A clear move above the $3,385 resistance might send the price toward the $3,450 resistance. An upside break above the $3,450 region might call for more gains in the coming days. In the stated case, Ether could rise toward the $3,500 resistance zone or even $3,550 in the near term.
Downside Break In ETH?
If Ethereum fails to clear the $3,320 resistance, it could start a fresh decline. Initial support on the downside is near the $3,280 level and the trend line. The first major support sits near the $3,260 zone and the 100 hourly SMA.
A clear move below the $3,260 support might push the price toward the $3,220 support and the 50% Fib retracement level of the recent wave from the $3,060 swing low to the $3,402 high. Any more losses might send the price toward the $3,150 region.
Technical Indicators
Hourly MACD – The MACD for ETH/USD is losing momentum in the bullish zone.
Hourly RSI – The RSI for ETH/USD is now below the 50 zone.
Major Support Level – $3,280
Major Resistance Level – $3,385
Reason to trust
![]()
Strict editorial policy that focuses on accuracy, relevance, and impartiality
Created by industry experts and meticulously reviewed
The highest standards in reporting and publishing
Strict editorial policy that focuses on accuracy, relevance, and impartiality
Morbi pretium leo et nisl aliquam mollis. Quisque arcu lorem, ultricies quis pellentesque nec, ullamcorper eu odio.
Bitcoin price remained supported above the $85,500 zone. BTC is now rising and might aim for a move above the $88,000 resistance zone.
- Bitcoin started a fresh recovery wave above the $87,000 zone.
- The price is trading above $87,000 and the 100 hourly Simple moving average.
- There is a key bearish trend line forming with resistance at $88,200 on the hourly chart of the BTC/USD pair (data feed from Kraken).
- The pair could start another increase if it clears the $88,000 and $88,200 levels.
Bitcoin Price Remains Supported
Bitcoin price remained stable above the $85,500 level. BTC formed a base and recently started a recovery wave above the $86,200 resistance level.
The bulls pushed the price above the $87,000 resistance level. There was a decent upward move and the price was able to clear the 50% Fib retracement level of the recent downside correction from the $88,259 swing high to the $85,853 swing low.
Bitcoin price is now trading above $86,500 and the 100 hourly Simple moving average. On the upside, immediate resistance is near the $87,700 level and the 76.4% Fib retracement level of the recent downside correction from the $88,259 swing high to the $85,853 swing low.
The first key resistance is near the $88,000 level. The next key resistance could be $88,200. There is also a key bearish trend line forming with resistance at $88,200 on the hourly chart of the BTC/USD pair.

A close above the $88,200 resistance might send the price further higher. In the stated case, the price could rise and test the $89,500 resistance level. Any more gains might send the price toward the $90,000 level or even $90,500.
Another Drop In BTC?
If Bitcoin fails to rise above the $88,200 resistance zone, it could start a fresh decline. Immediate support on the downside is near the $87,000 level. The first major support is near the $86,500 level.
The next support is now near the $85,500 zone. Any more losses might send the price toward the $85,000 support in the near term. The main support sits at $84,500.
Technical indicators:
Hourly MACD – The MACD is now gaining pace in the bullish zone.
Hourly RSI (Relative Strength Index) – The RSI for BTC/USD is now above the 50 level.
Major Support Levels – $87,000, followed by $86,500.
Major Resistance Levels – $88,000 and $88,200.