Bitcoin price attempted to start a fresh increase but failed at $89,500. BTC is now struggling below $86,500 and might continue to move down.
- Bitcoin started a fresh decline below the $86,500 zone.
- The price is trading below $86,500 and the 100 hourly Simple moving average.
- There was a break below a bullish trend line with support at $87,250 on the hourly chart of the BTC/USD pair (data feed from Kraken).
- The pair might continue to move down if it settles below the $85,000 zone.
Bitcoin Price Dips Again
Bitcoin price attempted a fresh recovery wave above $88,000 and $88,500. BTC tested the $89,500 resistance zone and reacted to the downside. There was a sharp decline below $88,000.
There was a break below a bullish trend line with support at $87,250 on the hourly chart of the BTC/USD pair. The price even spiked below the $85,000 support. However, the bulls were active near the $84,500 zone. A low was formed at $84,421 and the price is now consolidating losses below the 23.6% Fib retracement level of the downward move from the $89,437 swing high to the $84,421 low.
Bitcoin is now trading below $87,000 and the 100 hourly Simple moving average. If the bulls remain in action, the price could attempt more gains. Immediate resistance is near the $86,600 level. The first key resistance is near the $87,000 level and the 50% Fib retracement level of the downward move from the $89,437 swing high to the $84,421 low.
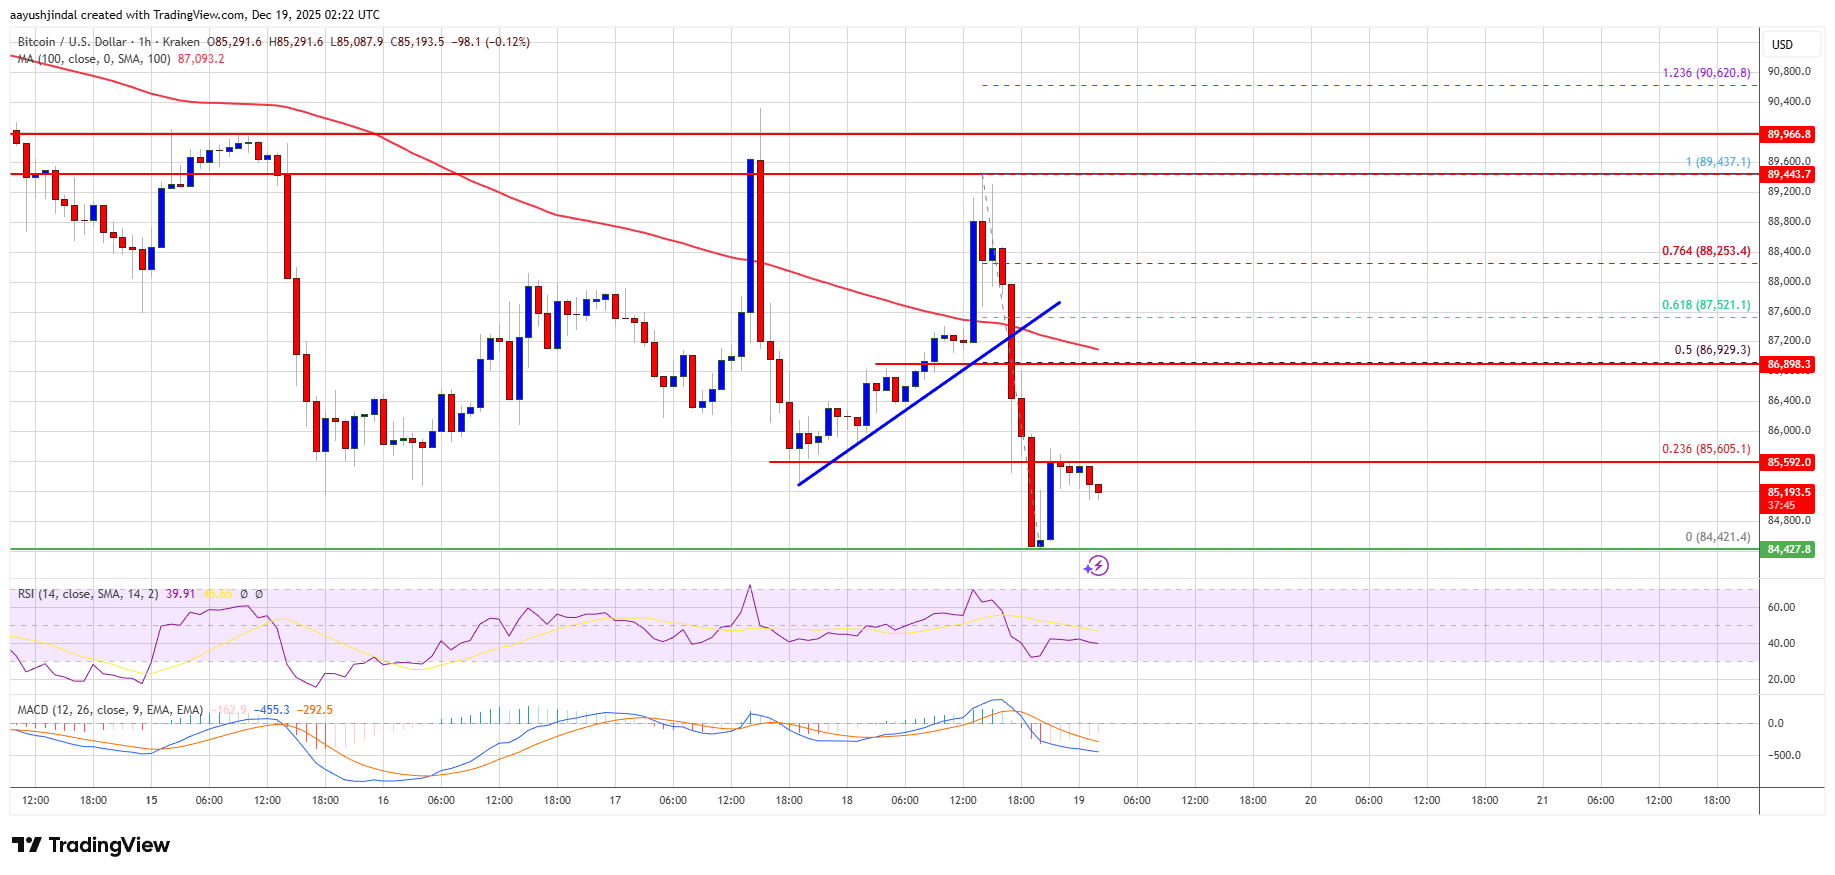
The next resistance could be $88,000. A close above the $88,000 resistance might send the price further higher. In the stated case, the price could rise and test the $88,800 resistance. Any more gains might send the price toward the $89,500 level. The next barrier for the bulls could be $90,000 and $90,500.
More Losses In BTC?
If Bitcoin fails to rise above the $87,000 resistance zone, it could start another decline. Immediate support is near the $85,000 level. The first major support is near the $84,500 level.
The next support is now near the $83,200 zone. Any more losses might send the price toward the $82,500 support in the near term. The main support sits at $80,500, below which BTC might accelerate lower in the near term.
Technical indicators:
Hourly MACD – The MACD is now gaining pace in the bearish zone.
Hourly RSI (Relative Strength Index) – The RSI for BTC/USD is now below the 50 level.
Major Support Levels – $85,000, followed by $84,500.
Major Resistance Levels – $87,000 and $88,000.
Dogecoin (DOGE) Price Prediction: Bulls Defend $0.21 Support—Is DOGE Ready to Break Above Key Resistance Channel? Brave New Coin
Source link ]]>
Reason to trust
![]()
Strict editorial policy that focuses on accuracy, relevance, and impartiality
Created by industry experts and meticulously reviewed
The highest standards in reporting and publishing
Strict editorial policy that focuses on accuracy, relevance, and impartiality
Morbi pretium leo et nisl aliquam mollis. Quisque arcu lorem, ultricies quis pellentesque nec, ullamcorper eu odio.
Bitcoin price started a fresh decline from the $90,000 zone. BTC is back below $82,500 and might continue to move down below $78,000.
- Bitcoin started a fresh decline below the $82,000 zone.
- The price is trading below $80,000 and the 100 hourly Simple moving average.
- There is a key bearish trend line forming with resistance at $82,200 on the hourly chart of the BTC/USD pair (data feed from Kraken).
- The pair could start another decline if it fails to clear the $82,000 resistance zone.
Bitcoin Price Faces Hurdles
Bitcoin price started a fresh decline below the $85,000 level. BTC traded below the $83,000 and $80,000 support levels. Finally, the price tested the $76,500 support zone.
A low was formed at $76,818 and the price recently started a consolidation phase. There was a move above the $78,000 and $78,500 resistance levels. The bulls pushed the price toward the 23.6% Fib retracement level of the downward move from the $91,060 swing high to the $76,818 low.
Bitcoin price is now trading below $80,000 and the 100 hourly Simple moving average. On the upside, immediate resistance is near the $80,200 level. The first key resistance is near the $82,000 level.
There is also a key bearish trend line forming with resistance at $82,200 on the hourly chart of the BTC/USD pair. The next key resistance could be $84,000. It is near the 50% Fib retracement level of the downward move from the $91,060 swing high to the $76,818 low.
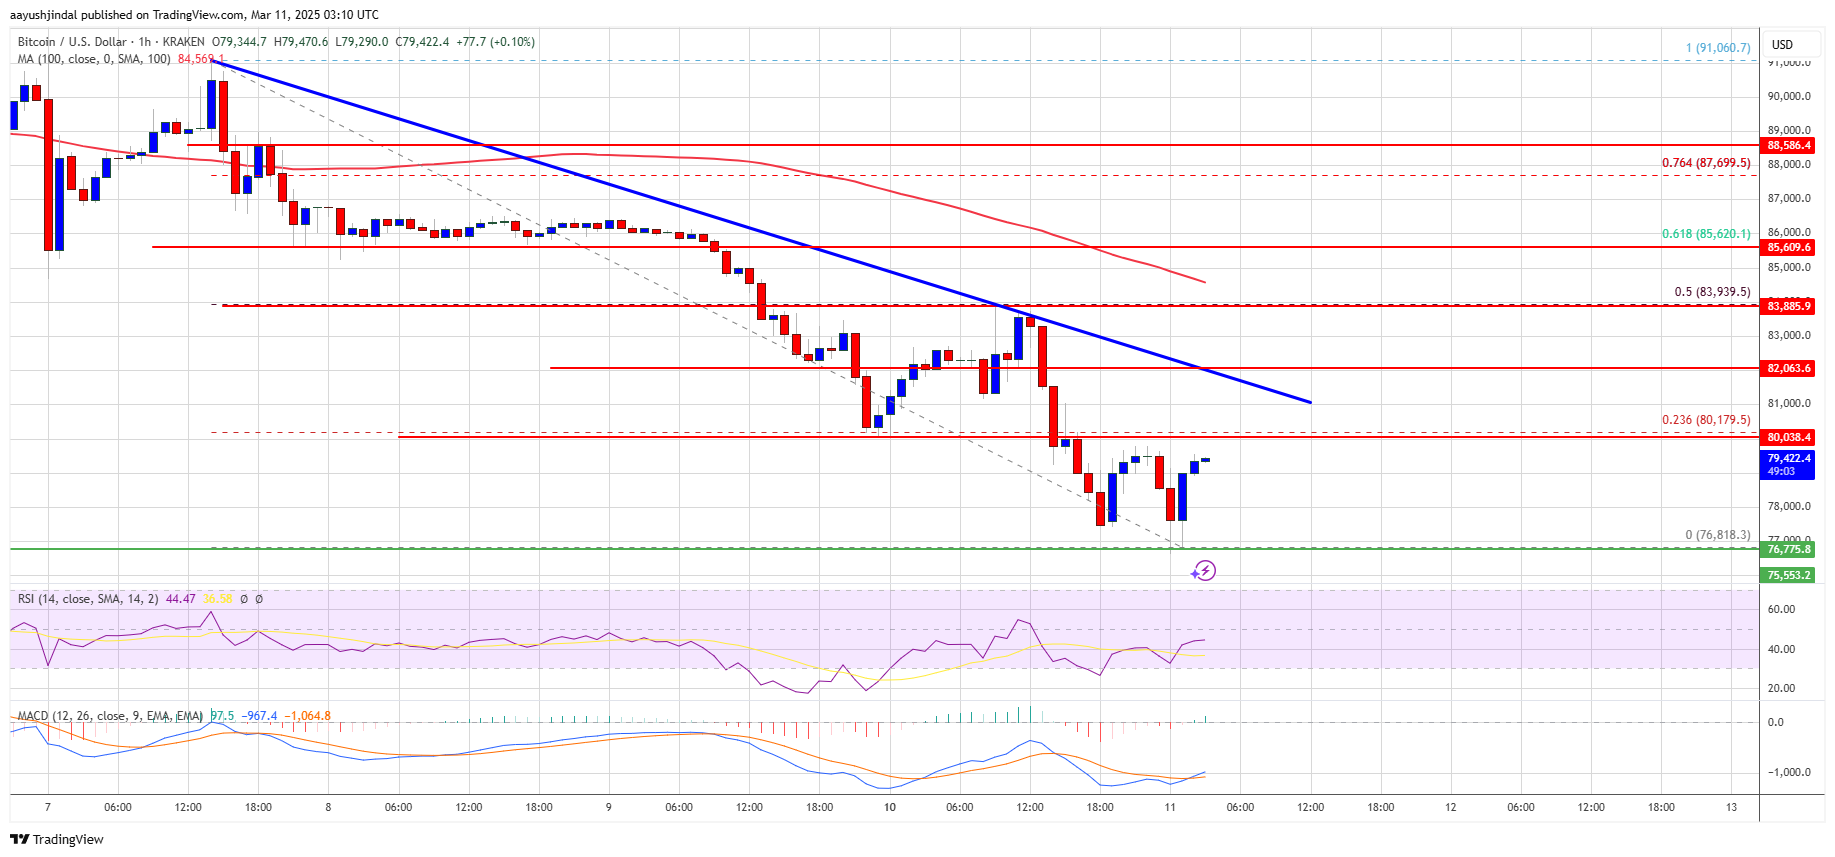
A close above the $84,000 resistance might send the price further higher. In the stated case, the price could rise and test the $85,500 resistance level. Any more gains might send the price toward the $88,000 level or even $96,200.
Another Drop In BTC?
If Bitcoin fails to rise above the $82,000 resistance zone, it could start a fresh decline. Immediate support on the downside is near the $77,200 level. The first major support is near the $76,500 level.
The next support is now near the $75,000 zone. Any more losses might send the price toward the $72,000 support in the near term. The main support sits at $70,000.
Technical indicators:
Hourly MACD – The MACD is now losing pace in the bearish zone.
Hourly RSI (Relative Strength Index) – The RSI for BTC/USD is now below the 50 level.
Major Support Levels – $76,500, followed by $75,000.
Major Resistance Levels – $80,000 and $82,000.