Bitcoin price started a fresh increase and cleared the $74,650 zone. BTC is consolidating and might aim for more gains above the $75,500 level.
- Bitcoin managed to stay above $73,500 and started a fresh increase.
- The price is trading above $74,200 and the 100 hourly simple moving average.
- There was a break above a bearish trend line with resistance at $74,800 on the hourly chart of the BTC/USD pair (data feed from Kraken).
- The pair might extend gains if it stays above the $73,650 and $73,300 levels.
Bitcoin Price Eyes Upside Break
Bitcoin price found support near $73,200 and started a fresh increase. BTC gained pace for a move above the $73,650 and $74,000 resistance levels.
There was a break above a bearish trend line with resistance at $74,800 on the hourly chart of the BTC/USD pair. A high was formed at $75,500, and the price is now correcting gains. There was a move below the 23.6% Fib retracement level of the upward move from the $73,310 swing low to the $75,500 high.
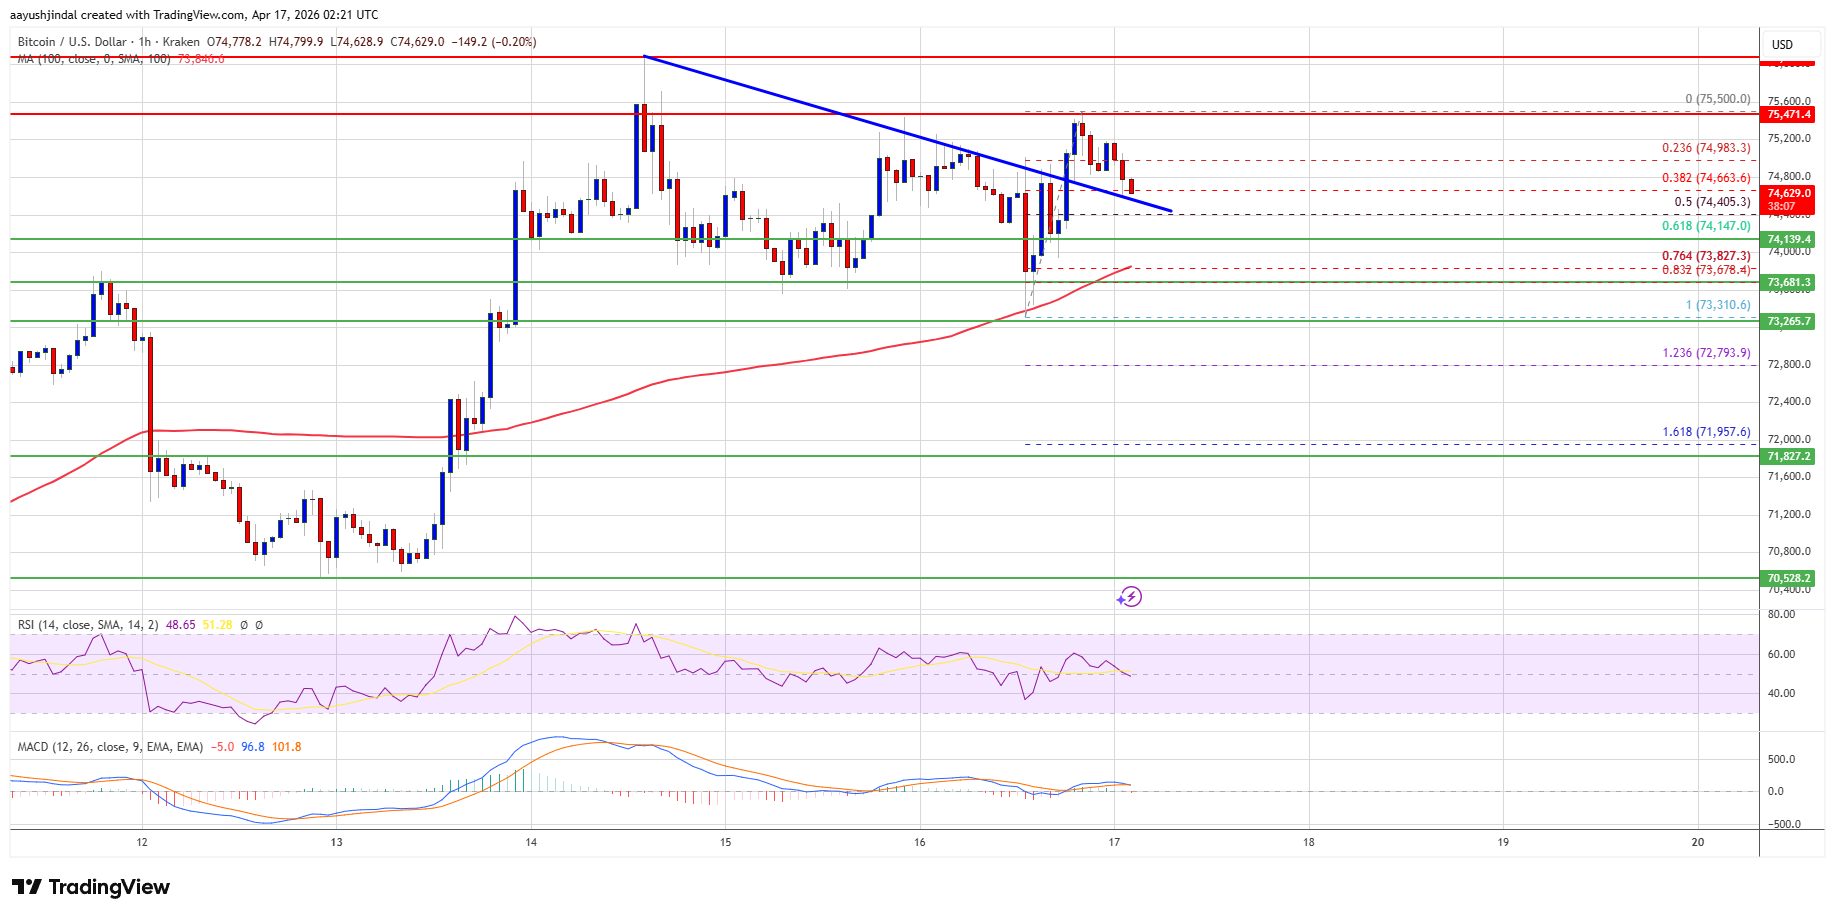
Bitcoin is now trading above $74,200 and the 100 hourly simple moving average. If the price remains stable above $73,800, it could attempt a fresh increase. Immediate resistance is near the $75,000 level. The first key resistance is near the $75,500 level. A close above the $75,500 resistance might send the price further higher. In the stated case, the price could rise and test the $76,200 resistance. Any more gains might send the price toward the $77,400 level. The next barrier for the bulls could be $78,000.
Another Drop In BTC?
If Bitcoin fails to rise above the $75,000 resistance zone, it could start another decline. Immediate support is near the $74,150 level and the 61.8% Fib retracement level of the upward move from the $73,310 swing low to the $75,500 high. The first major support is near the $73,650 level.
The next support is now near the $73,300 zone. Any more losses might send the price toward the $72,000 support in the near term. The main support now sits at $71,200, below which BTC might struggle to recover in the near term.
Technical indicators:
Hourly MACD – The MACD is now losing pace in the bullish zone.
Hourly RSI (Relative Strength Index) – The RSI for BTC/USD is now below the 50 level.
Major Support Levels – $73,650, followed by $73,300.
Major Resistance Levels – $75,000 and $75,500.
Shiba Inu (SHIB) Price Prediction: Rakuten Wallet Adds SHIB Spot Trading While Burns Surge 3,230% openPR.com
Source link ]]>
Dogecoin Drops Now: But a Major Surge Could Be Next Analytics Insight
Source link ]]>
Key takeaways
- Hyperliquid is up 8% in the last 24 hours, maintaining its position in the top 10.
- The coin could rally towards the $50 psychological level if the bullish sentiment persists.
Hyperliquid (HYPE) continues its upward momentum, trading above $44 as of Tuesday after an 8% surge on the previous day. With strengthening on-chain data, favorable derivatives metrics, and technical analysis pointing to further gains, the outlook for HYPE remains bullish, with a target of $50 in sight.
Bullish Sentiment Backed by On-Chain and Derivatives Metrics
On-chain data from CryptoQuant suggests a strong buy-side dominance in both Hyperliquid’s spot and futures markets, with cooling conditions indicating a favorable environment for a potential price rise. The market shows mostly neutral conditions across other metrics, reinforcing the possibility of an upside move.
On the derivatives front, CoinGlass data reveals that HYPE’s futures Open Interest (OI) has surged to $1.96 billion on Tuesday, up from $1.5 billion on April 3. This steady rise in OI points to new capital entering the market, which could propel HYPE’s price higher. This is the highest level of futures OI seen since early November.
Moreover, CoinGlass’ long-to-short ratio for HYPE stands at 1.04, signaling a predominantly bullish sentiment in the market, as more traders expect the price to rally.
Price Forecast: HYPE bulls target $50
The HYPE/USD 4-hour chart is extremely bullish and efficient. HYPE’s price has extended its gains, surpassing the March high of $43.75 and reaching above $44 on Tuesday. If the upward trend continues, HYPE could target the October 30 high of $50.15.
The Relative Strength Index (RSI) on the daily chart is currently at 69, indicating strong bullish momentum as it moves toward overbought territory. Additionally, the Moving Average Convergence Divergence (MACD) indicator recently showed a bullish crossover on April 10, further supporting a positive outlook for HYPE.
Should HYPE experience a pullback, it could find support near the psychological $40 level. However, the prevailing market conditions suggest a strong potential for further upside, with $50 being the next major resistance.
Dogecoin (DOGE) Price Prediction: 73,000 Active Addresses and 28% Surge Tied to SpaceX IPO Reports openPR.com
Source link ]]>
Dogecoin Price Prediction: DOGE Price Nears Triangle Breakout—Is a 35% Surge to $0.13 Imminent? Brave New Coin
Source link ]]>
Dogecoin Stalls Inside The Kumo — Volatility Surge On The Horizon? Cryptonews.net
Source link ]]>
Dogecoin Trapped in Technical No Man’s Land as Volatility Surge Looms Startup Fortune
Source link ]]>
Dogecoin Price Consolidates Near $0.094 Amid NFT Surge and XMoney Rumors as U.S. Investors Watch for AD HOC NEWS
Source link ]]>
Cardano (ADA) Outperforms Market With 10% Surge as Whale Accumulation Reaches 424 Wallet Threshold openPR.com
Source link ]]>