Bitcoin price started a fresh decline from the $69,250 zone. BTC is now struggling to stay above $66,000 and might extend losses in the near term.
- Bitcoin failed to settle above $68,000 and started a fresh decline.
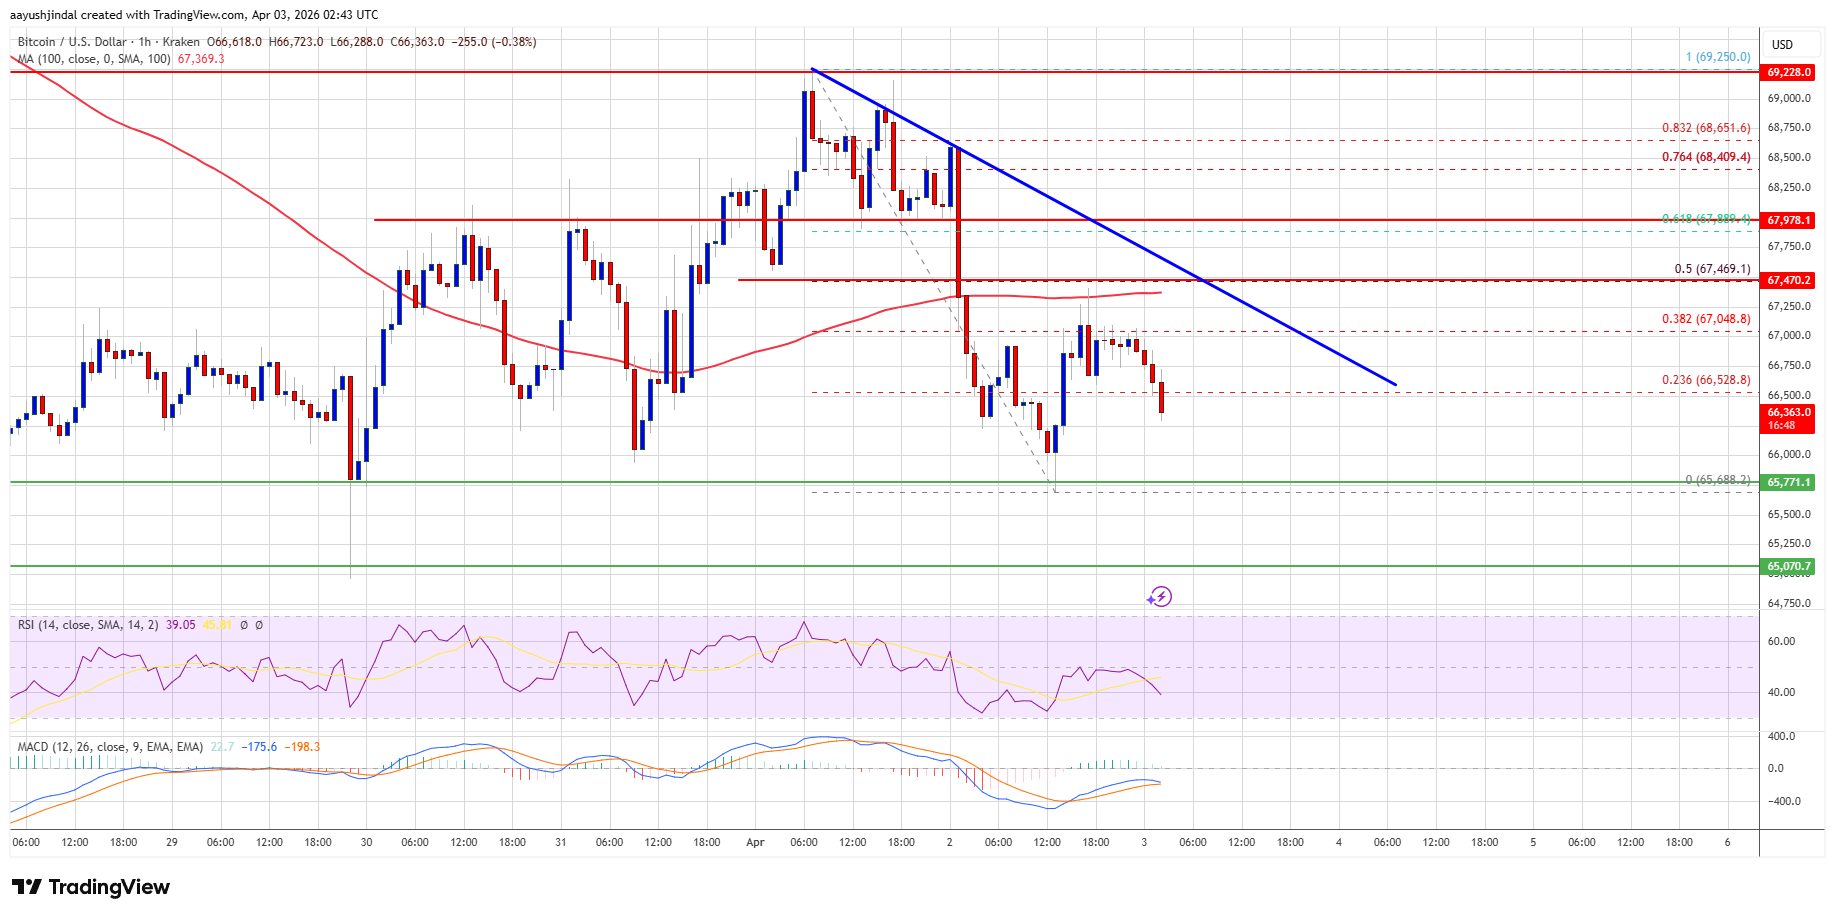
- The price is trading below $67,000 and the 100 hourly simple moving average.
- There is a bearish trend line forming with resistance at $67,450 on the hourly chart of the BTC/USD pair (data feed from Kraken).
- The pair might start another decline if it stays below the $67,500 and $67,800 levels.
Bitcoin Price Dips Again
Bitcoin price failed to stay above the $68,800 zone and started a fresh decline. BTC traded below $68,200 and $68,000 to enter a bearish zone.
The bears even pushed the price below $67,000. A low was formed at $65,688, and the price is now consolidating losses below the 23.6% Fib retracement level of the downward move from the $69,250 swing high to the $65,688 low.
Bitcoin is now trading below $67,000 and the 100 hourly simple moving average. If the price remains stable above $65,500, it could attempt a fresh increase. Immediate resistance is near the $67,000 level.
The first key resistance is near the $67,500 level or the 50% Fib retracement level of the downward move from the $69,250 swing high to the $65,688 low. There is also a bearish trend line forming with resistance at $67,450 on the hourly chart of the BTC/USD pair.
A close above the $67,500 resistance might send the price further higher. In the stated case, the price could rise and test the $68,000 resistance. Any more gains might send the price toward the $68,500 level. The next barrier for the bulls could be $68,800.
More Losses In BTC?
If Bitcoin fails to rise above the $67,500 resistance zone, it could start another decline. Immediate support is near the $66,000 level. The first major support is near the $65,500 level.
The next support is now near the $65,000 zone. Any more losses might send the price toward the $64,200 support in the near term. The main support now sits at $63,500, below which BTC might struggle to recover in the near term.
Technical indicators:
Hourly MACD – The MACD is now gaining pace in the bearish zone.
Hourly RSI (Relative Strength Index) – The RSI for BTC/USD is now below the 50 level.
Major Support Levels – $66,000, followed by $65,500.
Major Resistance Levels – $67,500 and $68,000.

- Ethereum price remains under pressure below the key $2,150 resistance.
- Exchange outflows hint at continued long-term accumulation.
- The $1,800 support is the key level traders are watching.
The Ethereum price is struggling to hold above the $2,000 mark amid mixed signals from technical indicators, derivatives markets, and on-chain activity.
The ETH price has slipped back toward the mid $1,900 range after briefly attempting a recovery above $2,000.
This highlights how fragile the current rebound remains despite signs of stabilisation following February’s sharp sell-off.
While the latest bounce helped Ethereum avoid deeper losses, the broader trend still leans bearish as long as the price remains trapped below $2,000.
Ethereum price outlook remains fragile
From a technical standpoint, Ethereum continues to trade within a descending channel that has defined the market for several months.
The ETH price also sits well below its major moving averages, which are still pointing downward and reinforcing the broader bearish trend.
This setup suggests that the recent recovery may be nothing more than a temporary relief rally rather than the start of a sustained reversal.
Also, on shorter timeframes, Ethereum recently attempted to break through the $2,150 region but faced immediate rejection.
That rejection created another lower high, confirming that sellers remain active whenever the price approaches resistance.
Momentum indicators also reflect the cautious tone currently dominating the market, with the Relative Strength Index (RSI) sitting below the neutral 50 level, which signals weak bullish momentum.

At the same time, the MACD indicator has begun to soften after a short-lived bullish phase, showing that buying pressure is fading.
Exchange flows and derivatives activity paint a mixed picture
Despite the weak technical structure, some on-chain signals suggest that long-term investors are still accumulating Ethereum.
Exchange flow data shows that more ETH is leaving crypto exchanges than entering them.

The net outflows indicate that investors are moving coins into private wallets rather than preparing them for immediate sale.
This behaviour often appears during accumulation phases when holders expect prices to rise over time.
However, the derivatives market is sending a very different message.
Funding rates across perpetual futures markets have surged sharply into positive values from heavily negative values as traders piled into leveraged positions.

Such a rapid increase in leverage shows that market participants are becoming more aggressive with their directional bets.
High leverage can create unstable conditions because even modest price movements can trigger large liquidation cascades.
Key Ethereum price levels to watch this week
From the technical outlook, the Ethereum price is now approaching a critical moment as it trades just above several important support levels.
The first support that traders should watch sits around $1,900, which marks a recent reaction low.
If the ETH price slips below that level, analysts note that the attention would quickly shift toward the $1,800 zone, which has acted as a strong floor since February and currently represents one of the most important supports on the chart.
A breakdown below $1,900 could open the door for a deeper correction and potentially push Ethereum toward the lower boundary of its broader descending channel near $1,776.
On the upside, the first resistance zone appears between $2,027 and $2,050.
A break above that region would suggest that buyers are regaining some momentum.
Beyond that level, the market will likely focus on the $2,138 to $2,150 area, which represents a major technical barrier within the current channel structure.
A decisive breakout above that ceiling could shift sentiment and allow Ethereum to aim for the next resistance near $2,380.
Until such a breakout occurs, however, the Ethereum price is likely to remain stuck between support near $1,800 and resistance near $2,150 as traders wait for the next decisive move.
Dogecoin Teeters on $0.09 Support Amid Defensive Market Rotation and Legal Clouds FXLeaders
Source link ]]>

Trusted Editorial content, reviewed by leading industry experts and seasoned editors. Ad Disclosure
Ethereum is struggling to hold above the $2,000 level as the broader crypto market enters a more fragile phase marked by persistent selling pressure, fading momentum, and elevated uncertainty. Despite several rebound attempts in recent weeks, price action has remained subdued, with liquidity conditions tightening and investor sentiment turning increasingly cautious. The inability to secure sustained acceptance above this psychological threshold has reinforced the perception that the market is still navigating a corrective environment rather than transitioning into a clear recovery phase.
A recent CryptoQuant report provides additional context by highlighting a sharp increase in exchange activity. According to the data, total Ethereum inflows to Binance over the past 30 days reached roughly $33.3 billion — the highest level recorded since last November. This surge comes as ETH trades near $1,955 after a gradual but persistent decline in recent weeks.
Historically, rising inflows to major exchanges tend to indicate a growing supply of assets available for trading. When substantial volumes of Ethereum move onto platforms like Binance, they may be used for spot sales, derivatives collateral, or portfolio rebalancing. Consequently, this spike in inflows signals heightened market activity and potentially increased short-term volatility.
While the recent surge in Ethereum inflows to Binance may initially appear bearish, the report emphasizes that this development should not automatically be interpreted as a negative signal. Elevated exchange inflows can sometimes reflect strategic repositioning rather than immediate selling intent. Investors may be preparing to actively trade, hedge exposure, or adjust portfolio allocations, particularly during periods of heightened volatility when liquidity access becomes more critical.

In addition, strong inflow phases have occasionally preceded periods of price stabilization. When additional supply entering exchanges is met by sufficient demand, markets can transition into consolidation rather than extended declines. This dynamic often depends on broader liquidity conditions, derivatives positioning, and macro sentiment rather than inflows alone.
That said, registering the highest inflow level since last November places Ethereum in a structurally sensitive phase. The market’s reaction to these flows will likely provide clearer directional signals in the coming weeks. If the added supply translates into persistent sell-side pressure, downside risks could remain elevated. Conversely, if demand absorbs this liquidity effectively, the current phase may represent redistribution ahead of a more constructive move rather than sustained weakness.
Ethereum’s weekly chart reflects a structurally fragile environment as price continues trading below the $2,000 psychological threshold. After failing to sustain momentum above the mid-2025 highs near the $4,800 region, ETH has established a sequence of lower highs and lower lows — a classic downtrend formation indicating persistent distribution rather than consolidation.

Technically, Ethereum is now positioned beneath its key moving averages, which previously acted as dynamic support during the rally phase. These averages have rolled over and now function as resistance zones, limiting recovery attempts unless decisively reclaimed. The recent rejection near the $3,000 area reinforced this bearish transition, accelerating downside momentum toward the current ~$1,900 region.
Volume trends show declining participation compared with the expansion phase, suggesting reduced speculative enthusiasm. However, declining volume during corrections can sometimes precede stabilization if selling pressure becomes exhausted.
From a structural perspective, immediate support appears near the $1,800–$1,900 range, where prior consolidation occurred. A sustained break below this zone could expose deeper retracement levels toward historical accumulation areas. Conversely, reclaiming the $2,200–$2,400 region with strong volume would be required to shift short-term momentum back toward a neutral or constructive bias.
Featured image from ChatGPT, chart from TradingView.com
Editorial Process for bitcoinist is centered on delivering thoroughly researched, accurate, and unbiased content. We uphold strict sourcing standards, and each page undergoes diligent review by our team of top technology experts and seasoned editors. This process ensures the integrity, relevance, and value of our content for our readers.
Cardano News Teeters on Edge: Could Sub-$0.80 Crash Be Next? The Tradable
Source link ]]>
Shiba Inu Coin News Teeters on Edge: Will This Critical Support Save Shiba Inu From Another Crash? The Tradable
Source link ]]>
Shiba Inu (SHIB) Price Teeters on Edge as Key Support Crumbles The Tradable
Source link ]]>
As Dogecoin Price Teeters Near Support, DOGE Whales Are Flocking To Bonk and This Surging PayFi Protocol CoinCentral
Source link ]]>
Shiba Inu Teeters Near Breakdown As Resistance Holds Strong TronWeekly
Source link ]]>
Dogecoin Teeters on the Edge: Will It Soar or Sink? La Noticia Digital
Source link ]]>